Cuban vs Immigrants from Venezuela Median Family Income
COMPARE
Cuban
Immigrants from Venezuela
Median Family Income
Median Family Income Comparison
Cubans
Immigrants from Venezuela
$84,981
MEDIAN FAMILY INCOME
0.0/ 100
METRIC RATING
312th/ 347
METRIC RANK
$94,904
MEDIAN FAMILY INCOME
1.9/ 100
METRIC RATING
232nd/ 347
METRIC RANK
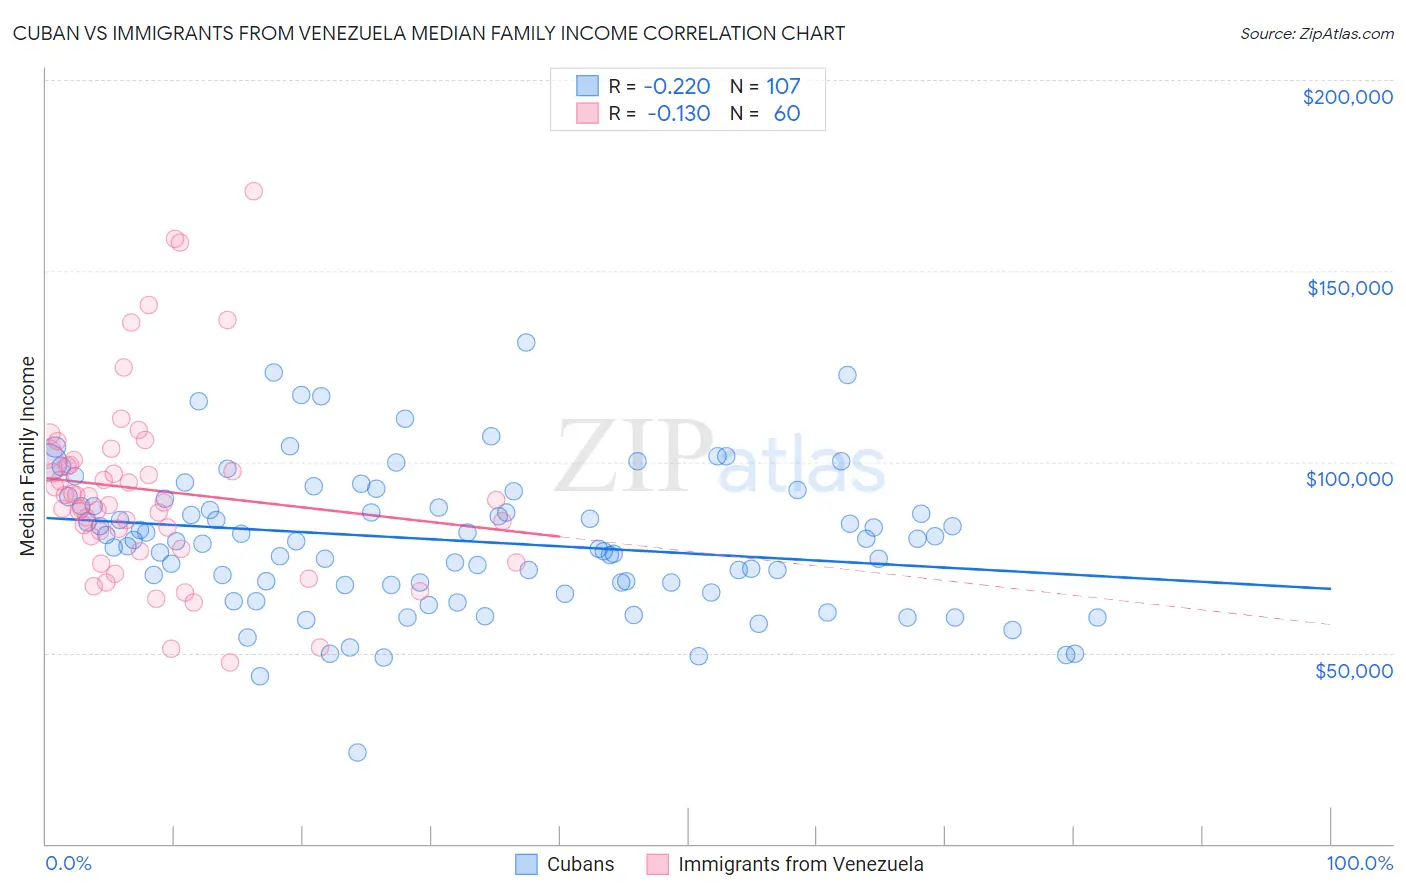
Cuban vs Immigrants from Venezuela Median Family Income Correlation Chart
The statistical analysis conducted on geographies consisting of 448,691,327 people shows a weak negative correlation between the proportion of Cubans and median family income in the United States with a correlation coefficient (R) of -0.220 and weighted average of $84,981. Similarly, the statistical analysis conducted on geographies consisting of 287,745,921 people shows a poor negative correlation between the proportion of Immigrants from Venezuela and median family income in the United States with a correlation coefficient (R) of -0.130 and weighted average of $94,904, a difference of 11.7%.
Median Family Income Correlation Summary
| Measurement | Cuban | Immigrants from Venezuela |
| Minimum | $23,750 | $47,465 |
| Maximum | $131,198 | $170,845 |
| Range | $107,448 | $123,380 |
| Mean | $79,388 | $92,607 |
| Median | $79,353 | $89,644 |
| Interquartile 25% (IQ1) | $67,815 | $78,947 |
| Interquartile 75% (IQ3) | $90,371 | $99,865 |
| Interquartile Range (IQR) | $22,555 | $20,918 |
| Standard Deviation (Sample) | $18,688 | $24,843 |
| Standard Deviation (Population) | $18,601 | $24,635 |
Similar Demographics by Median Family Income
Demographics Similar to Cubans by Median Family Income
In terms of median family income, the demographic groups most similar to Cubans are Honduran ($85,004, a difference of 0.030%), Immigrants from Central America ($85,050, a difference of 0.080%), Choctaw ($84,835, a difference of 0.17%), Haitian ($85,218, a difference of 0.28%), and Immigrants from Bahamas ($84,732, a difference of 0.29%).
| Demographics | Rating | Rank | Median Family Income |
| Paiute | 0.0 /100 | #305 | Tragic $85,414 |
| Immigrants | Dominica | 0.0 /100 | #306 | Tragic $85,411 |
| Chickasaw | 0.0 /100 | #307 | Tragic $85,356 |
| U.S. Virgin Islanders | 0.0 /100 | #308 | Tragic $85,294 |
| Haitians | 0.0 /100 | #309 | Tragic $85,218 |
| Immigrants | Central America | 0.0 /100 | #310 | Tragic $85,050 |
| Hondurans | 0.0 /100 | #311 | Tragic $85,004 |
| Cubans | 0.0 /100 | #312 | Tragic $84,981 |
| Choctaw | 0.0 /100 | #313 | Tragic $84,835 |
| Immigrants | Bahamas | 0.0 /100 | #314 | Tragic $84,732 |
| Apache | 0.0 /100 | #315 | Tragic $84,451 |
| Immigrants | Haiti | 0.0 /100 | #316 | Tragic $84,018 |
| Yakama | 0.0 /100 | #317 | Tragic $83,932 |
| Immigrants | Mexico | 0.0 /100 | #318 | Tragic $83,639 |
| Immigrants | Honduras | 0.0 /100 | #319 | Tragic $83,618 |
Demographics Similar to Immigrants from Venezuela by Median Family Income
In terms of median family income, the demographic groups most similar to Immigrants from Venezuela are Ecuadorian ($95,114, a difference of 0.22%), Immigrants from Bangladesh ($94,665, a difference of 0.25%), Immigrants from Western Africa ($94,638, a difference of 0.28%), Malaysian ($95,230, a difference of 0.34%), and Marshallese ($95,293, a difference of 0.41%).
| Demographics | Rating | Rank | Median Family Income |
| Vietnamese | 3.4 /100 | #225 | Tragic $96,123 |
| Immigrants | Panama | 2.7 /100 | #226 | Tragic $95,647 |
| Alaska Natives | 2.6 /100 | #227 | Tragic $95,573 |
| Immigrants | Azores | 2.4 /100 | #228 | Tragic $95,402 |
| Marshallese | 2.2 /100 | #229 | Tragic $95,293 |
| Malaysians | 2.2 /100 | #230 | Tragic $95,230 |
| Ecuadorians | 2.1 /100 | #231 | Tragic $95,114 |
| Immigrants | Venezuela | 1.9 /100 | #232 | Tragic $94,904 |
| Immigrants | Bangladesh | 1.6 /100 | #233 | Tragic $94,665 |
| Immigrants | Western Africa | 1.6 /100 | #234 | Tragic $94,638 |
| Immigrants | Burma/Myanmar | 1.5 /100 | #235 | Tragic $94,472 |
| Trinidadians and Tobagonians | 1.5 /100 | #236 | Tragic $94,466 |
| Alaskan Athabascans | 1.5 /100 | #237 | Tragic $94,429 |
| Nepalese | 1.3 /100 | #238 | Tragic $94,153 |
| Salvadorans | 1.2 /100 | #239 | Tragic $94,109 |