Cuban vs U.S. Virgin Islander Median Family Income
COMPARE
Cuban
U.S. Virgin Islander
Median Family Income
Median Family Income Comparison
Cubans
U.S. Virgin Islanders
$84,981
MEDIAN FAMILY INCOME
0.0/ 100
METRIC RATING
312th/ 347
METRIC RANK
$85,294
MEDIAN FAMILY INCOME
0.0/ 100
METRIC RATING
308th/ 347
METRIC RANK
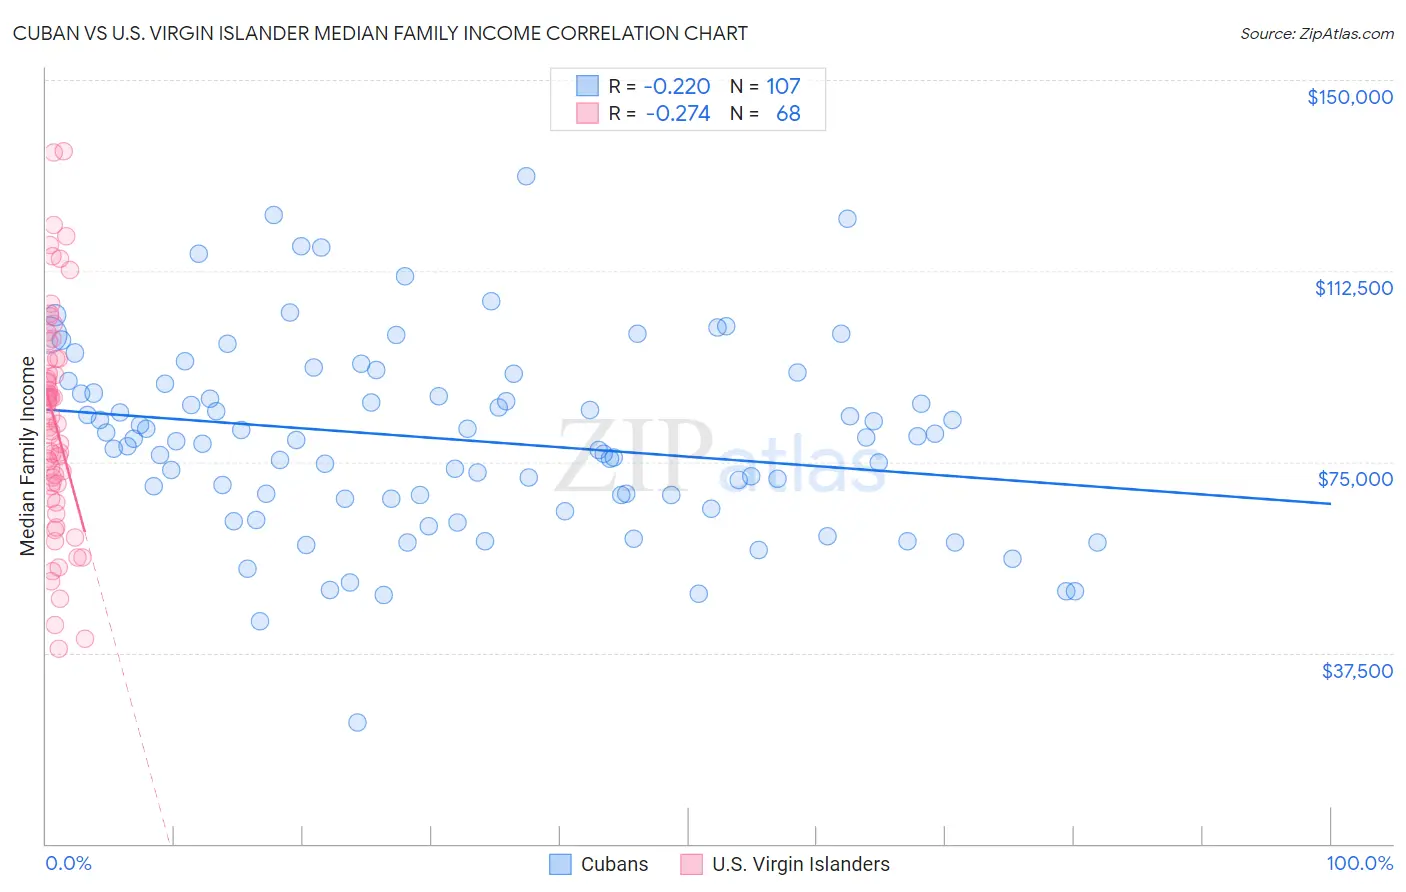
Cuban vs U.S. Virgin Islander Median Family Income Correlation Chart
The statistical analysis conducted on geographies consisting of 448,691,327 people shows a weak negative correlation between the proportion of Cubans and median family income in the United States with a correlation coefficient (R) of -0.220 and weighted average of $84,981. Similarly, the statistical analysis conducted on geographies consisting of 87,505,006 people shows a weak negative correlation between the proportion of U.S. Virgin Islanders and median family income in the United States with a correlation coefficient (R) of -0.274 and weighted average of $85,294, a difference of 0.37%.
Median Family Income Correlation Summary
| Measurement | Cuban | U.S. Virgin Islander |
| Minimum | $23,750 | $38,346 |
| Maximum | $131,198 | $136,000 |
| Range | $107,448 | $97,654 |
| Mean | $79,388 | $82,878 |
| Median | $79,353 | $82,757 |
| Interquartile 25% (IQ1) | $67,815 | $70,515 |
| Interquartile 75% (IQ3) | $90,371 | $95,033 |
| Interquartile Range (IQR) | $22,555 | $24,518 |
| Standard Deviation (Sample) | $18,688 | $21,454 |
| Standard Deviation (Population) | $18,601 | $21,296 |
Demographics Similar to Cubans and U.S. Virgin Islanders by Median Family Income
In terms of median family income, the demographic groups most similar to Cubans are Honduran ($85,004, a difference of 0.030%), Immigrants from Central America ($85,050, a difference of 0.080%), Choctaw ($84,835, a difference of 0.17%), Haitian ($85,218, a difference of 0.28%), and Immigrants from Bahamas ($84,732, a difference of 0.29%). Similarly, the demographic groups most similar to U.S. Virgin Islanders are Chickasaw ($85,356, a difference of 0.070%), Haitian ($85,218, a difference of 0.090%), Paiute ($85,414, a difference of 0.14%), Immigrants from Dominica ($85,411, a difference of 0.14%), and Immigrants from Central America ($85,050, a difference of 0.29%).
| Demographics | Rating | Rank | Median Family Income |
| Ottawa | 0.0 /100 | #300 | Tragic $86,380 |
| Colville | 0.0 /100 | #301 | Tragic $85,792 |
| Spanish American Indians | 0.0 /100 | #302 | Tragic $85,728 |
| Hispanics or Latinos | 0.0 /100 | #303 | Tragic $85,647 |
| Mexicans | 0.0 /100 | #304 | Tragic $85,618 |
| Paiute | 0.0 /100 | #305 | Tragic $85,414 |
| Immigrants | Dominica | 0.0 /100 | #306 | Tragic $85,411 |
| Chickasaw | 0.0 /100 | #307 | Tragic $85,356 |
| U.S. Virgin Islanders | 0.0 /100 | #308 | Tragic $85,294 |
| Haitians | 0.0 /100 | #309 | Tragic $85,218 |
| Immigrants | Central America | 0.0 /100 | #310 | Tragic $85,050 |
| Hondurans | 0.0 /100 | #311 | Tragic $85,004 |
| Cubans | 0.0 /100 | #312 | Tragic $84,981 |
| Choctaw | 0.0 /100 | #313 | Tragic $84,835 |
| Immigrants | Bahamas | 0.0 /100 | #314 | Tragic $84,732 |
| Apache | 0.0 /100 | #315 | Tragic $84,451 |
| Immigrants | Haiti | 0.0 /100 | #316 | Tragic $84,018 |
| Yakama | 0.0 /100 | #317 | Tragic $83,932 |
| Immigrants | Mexico | 0.0 /100 | #318 | Tragic $83,639 |
| Immigrants | Honduras | 0.0 /100 | #319 | Tragic $83,618 |
| Seminole | 0.0 /100 | #320 | Tragic $83,354 |