West Indian vs Immigrants from West Indies Median Family Income
COMPARE
West Indian
Immigrants from West Indies
Median Family Income
Median Family Income Comparison
West Indians
Immigrants from West Indies
$92,765
MEDIAN FAMILY INCOME
0.6/ 100
METRIC RATING
250th/ 347
METRIC RANK
$91,588
MEDIAN FAMILY INCOME
0.3/ 100
METRIC RATING
263rd/ 347
METRIC RANK
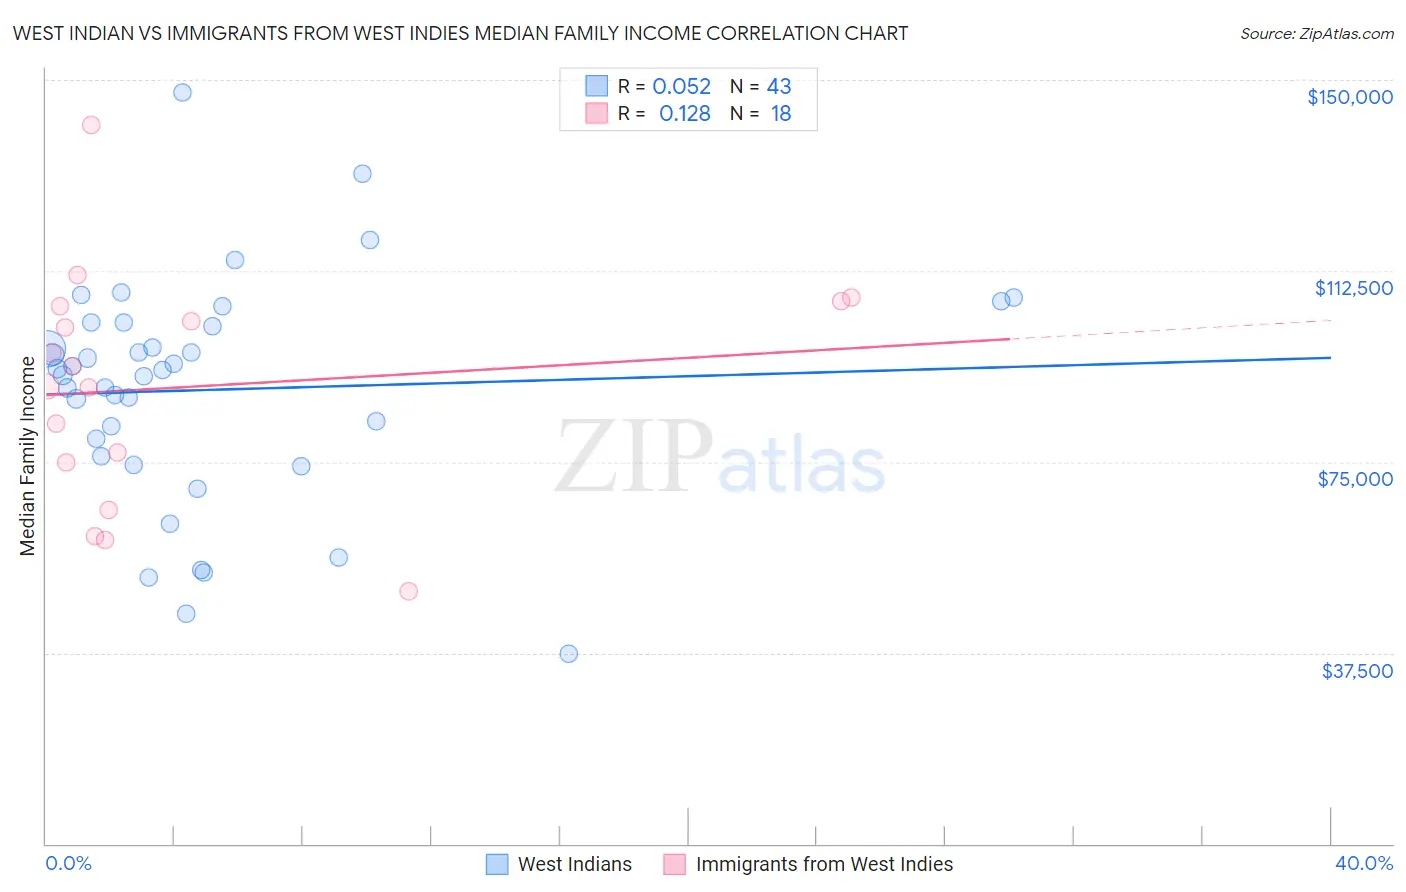
West Indian vs Immigrants from West Indies Median Family Income Correlation Chart
The statistical analysis conducted on geographies consisting of 253,786,025 people shows a slight positive correlation between the proportion of West Indians and median family income in the United States with a correlation coefficient (R) of 0.052 and weighted average of $92,765. Similarly, the statistical analysis conducted on geographies consisting of 72,412,445 people shows a poor positive correlation between the proportion of Immigrants from West Indies and median family income in the United States with a correlation coefficient (R) of 0.128 and weighted average of $91,588, a difference of 1.3%.
Median Family Income Correlation Summary
| Measurement | West Indian | Immigrants from West Indies |
| Minimum | $37,244 | $49,539 |
| Maximum | $147,600 | $141,054 |
| Range | $110,356 | $91,515 |
| Mean | $89,153 | $89,730 |
| Median | $92,948 | $91,813 |
| Interquartile 25% (IQ1) | $76,053 | $74,771 |
| Interquartile 75% (IQ3) | $102,268 | $105,524 |
| Interquartile Range (IQR) | $26,215 | $30,753 |
| Standard Deviation (Sample) | $22,238 | $22,647 |
| Standard Deviation (Population) | $21,978 | $22,009 |
Demographics Similar to West Indians and Immigrants from West Indies by Median Family Income
In terms of median family income, the demographic groups most similar to West Indians are Immigrants from Ecuador ($92,837, a difference of 0.080%), French American Indian ($92,872, a difference of 0.11%), Immigrants from Senegal ($92,912, a difference of 0.16%), Immigrants from Somalia ($92,609, a difference of 0.17%), and Immigrants from El Salvador ($92,545, a difference of 0.24%). Similarly, the demographic groups most similar to Immigrants from West Indies are Senegalese ($91,475, a difference of 0.12%), Liberian ($91,722, a difference of 0.15%), Inupiat ($91,730, a difference of 0.16%), Pennsylvania German ($91,763, a difference of 0.19%), and Cape Verdean ($91,848, a difference of 0.28%).
| Demographics | Rating | Rank | Median Family Income |
| Guyanese | 0.9 /100 | #246 | Tragic $93,373 |
| Immigrants | Senegal | 0.7 /100 | #247 | Tragic $92,912 |
| French American Indians | 0.7 /100 | #248 | Tragic $92,872 |
| Immigrants | Ecuador | 0.7 /100 | #249 | Tragic $92,837 |
| West Indians | 0.6 /100 | #250 | Tragic $92,765 |
| Immigrants | Somalia | 0.6 /100 | #251 | Tragic $92,609 |
| Immigrants | El Salvador | 0.6 /100 | #252 | Tragic $92,545 |
| Immigrants | Guyana | 0.6 /100 | #253 | Tragic $92,513 |
| Immigrants | Barbados | 0.5 /100 | #254 | Tragic $92,419 |
| Immigrants | Laos | 0.5 /100 | #255 | Tragic $92,239 |
| Nicaraguans | 0.5 /100 | #256 | Tragic $92,231 |
| Americans | 0.4 /100 | #257 | Tragic $92,096 |
| Osage | 0.4 /100 | #258 | Tragic $91,926 |
| Cape Verdeans | 0.4 /100 | #259 | Tragic $91,848 |
| Pennsylvania Germans | 0.4 /100 | #260 | Tragic $91,763 |
| Inupiat | 0.4 /100 | #261 | Tragic $91,730 |
| Liberians | 0.4 /100 | #262 | Tragic $91,722 |
| Immigrants | West Indies | 0.3 /100 | #263 | Tragic $91,588 |
| Senegalese | 0.3 /100 | #264 | Tragic $91,475 |
| Hmong | 0.3 /100 | #265 | Tragic $91,296 |
| Central Americans | 0.3 /100 | #266 | Tragic $91,087 |