Cuban vs Yugoslavian Median Family Income
COMPARE
Cuban
Yugoslavian
Median Family Income
Median Family Income Comparison
Cubans
Yugoslavians
$84,981
MEDIAN FAMILY INCOME
0.0/ 100
METRIC RATING
312th/ 347
METRIC RANK
$100,119
MEDIAN FAMILY INCOME
21.3/ 100
METRIC RATING
199th/ 347
METRIC RANK
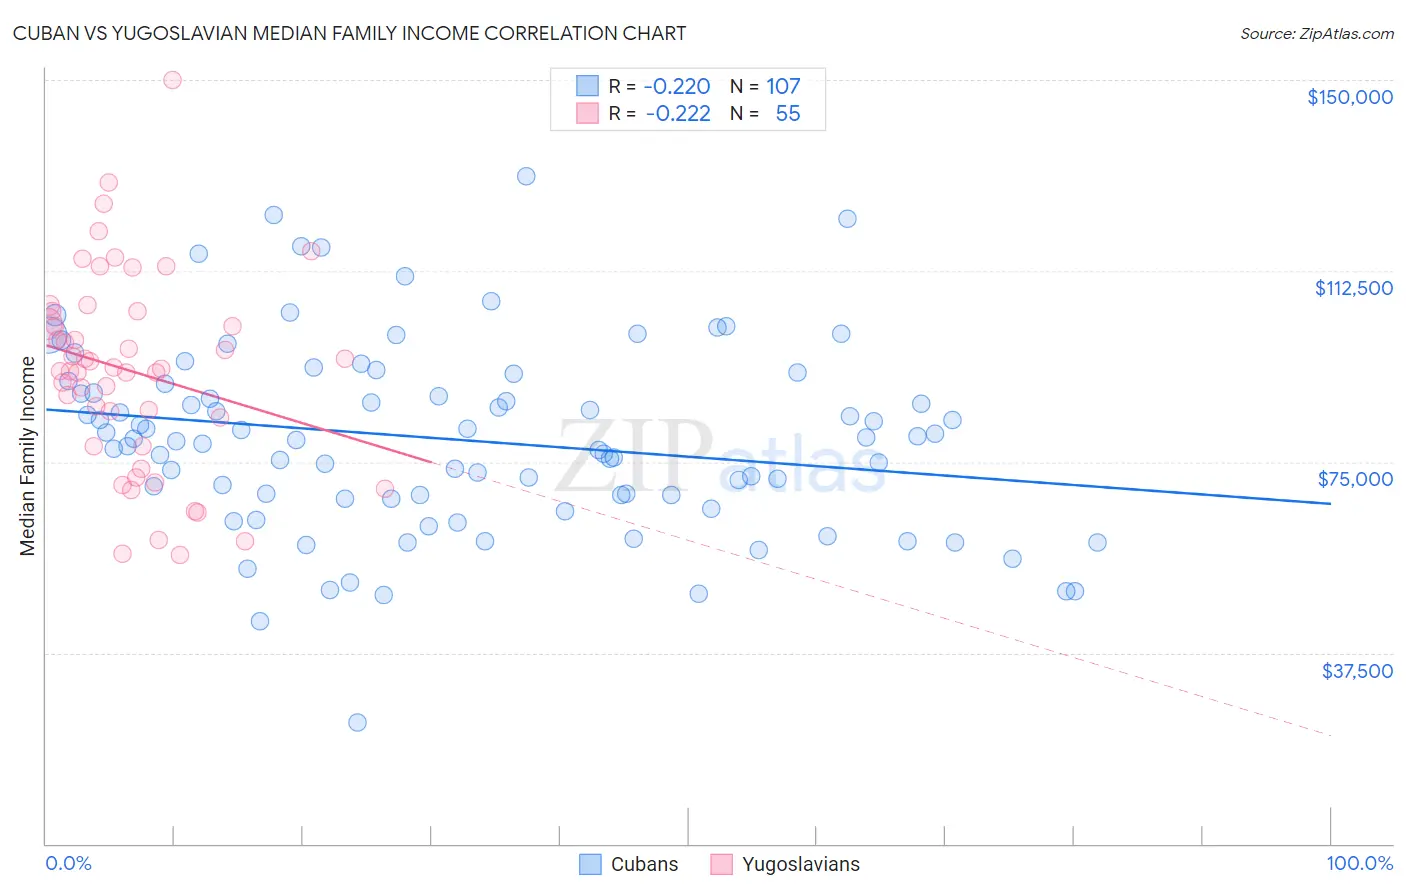
Cuban vs Yugoslavian Median Family Income Correlation Chart
The statistical analysis conducted on geographies consisting of 448,691,327 people shows a weak negative correlation between the proportion of Cubans and median family income in the United States with a correlation coefficient (R) of -0.220 and weighted average of $84,981. Similarly, the statistical analysis conducted on geographies consisting of 285,576,130 people shows a weak negative correlation between the proportion of Yugoslavians and median family income in the United States with a correlation coefficient (R) of -0.222 and weighted average of $100,119, a difference of 17.8%.
Median Family Income Correlation Summary
| Measurement | Cuban | Yugoslavian |
| Minimum | $23,750 | $56,660 |
| Maximum | $131,198 | $150,000 |
| Range | $107,448 | $93,340 |
| Mean | $79,388 | $92,781 |
| Median | $79,353 | $93,214 |
| Interquartile 25% (IQ1) | $67,815 | $78,167 |
| Interquartile 75% (IQ3) | $90,371 | $104,589 |
| Interquartile Range (IQR) | $22,555 | $26,422 |
| Standard Deviation (Sample) | $18,688 | $19,367 |
| Standard Deviation (Population) | $18,601 | $19,191 |
Similar Demographics by Median Family Income
Demographics Similar to Cubans by Median Family Income
In terms of median family income, the demographic groups most similar to Cubans are Honduran ($85,004, a difference of 0.030%), Immigrants from Central America ($85,050, a difference of 0.080%), Choctaw ($84,835, a difference of 0.17%), Haitian ($85,218, a difference of 0.28%), and Immigrants from Bahamas ($84,732, a difference of 0.29%).
| Demographics | Rating | Rank | Median Family Income |
| Paiute | 0.0 /100 | #305 | Tragic $85,414 |
| Immigrants | Dominica | 0.0 /100 | #306 | Tragic $85,411 |
| Chickasaw | 0.0 /100 | #307 | Tragic $85,356 |
| U.S. Virgin Islanders | 0.0 /100 | #308 | Tragic $85,294 |
| Haitians | 0.0 /100 | #309 | Tragic $85,218 |
| Immigrants | Central America | 0.0 /100 | #310 | Tragic $85,050 |
| Hondurans | 0.0 /100 | #311 | Tragic $85,004 |
| Cubans | 0.0 /100 | #312 | Tragic $84,981 |
| Choctaw | 0.0 /100 | #313 | Tragic $84,835 |
| Immigrants | Bahamas | 0.0 /100 | #314 | Tragic $84,732 |
| Apache | 0.0 /100 | #315 | Tragic $84,451 |
| Immigrants | Haiti | 0.0 /100 | #316 | Tragic $84,018 |
| Yakama | 0.0 /100 | #317 | Tragic $83,932 |
| Immigrants | Mexico | 0.0 /100 | #318 | Tragic $83,639 |
| Immigrants | Honduras | 0.0 /100 | #319 | Tragic $83,618 |
Demographics Similar to Yugoslavians by Median Family Income
In terms of median family income, the demographic groups most similar to Yugoslavians are Immigrants from Africa ($100,256, a difference of 0.14%), Spanish ($99,977, a difference of 0.14%), Immigrants from Cameroon ($100,289, a difference of 0.17%), Samoan ($100,344, a difference of 0.22%), and Immigrants from Thailand ($99,840, a difference of 0.28%).
| Demographics | Rating | Rank | Median Family Income |
| Immigrants | Kenya | 26.5 /100 | #192 | Fair $100,679 |
| Iraqis | 26.3 /100 | #193 | Fair $100,658 |
| Uruguayans | 26.3 /100 | #194 | Fair $100,656 |
| Immigrants | South America | 23.9 /100 | #195 | Fair $100,414 |
| Samoans | 23.3 /100 | #196 | Fair $100,344 |
| Immigrants | Cameroon | 22.8 /100 | #197 | Fair $100,289 |
| Immigrants | Africa | 22.5 /100 | #198 | Fair $100,256 |
| Yugoslavians | 21.3 /100 | #199 | Fair $100,119 |
| Spanish | 20.1 /100 | #200 | Fair $99,977 |
| Immigrants | Thailand | 19.0 /100 | #201 | Poor $99,840 |
| Whites/Caucasians | 18.7 /100 | #202 | Poor $99,800 |
| Scotch-Irish | 17.1 /100 | #203 | Poor $99,591 |
| Ghanaians | 12.6 /100 | #204 | Poor $98,877 |
| Hawaiians | 12.5 /100 | #205 | Poor $98,869 |
| Immigrants | Iraq | 12.1 /100 | #206 | Poor $98,786 |