Cuban vs Zimbabwean Median Family Income
COMPARE
Cuban
Zimbabwean
Median Family Income
Median Family Income Comparison
Cubans
Zimbabweans
$84,981
MEDIAN FAMILY INCOME
0.0/ 100
METRIC RATING
312th/ 347
METRIC RANK
$110,011
MEDIAN FAMILY INCOME
97.7/ 100
METRIC RATING
95th/ 347
METRIC RANK
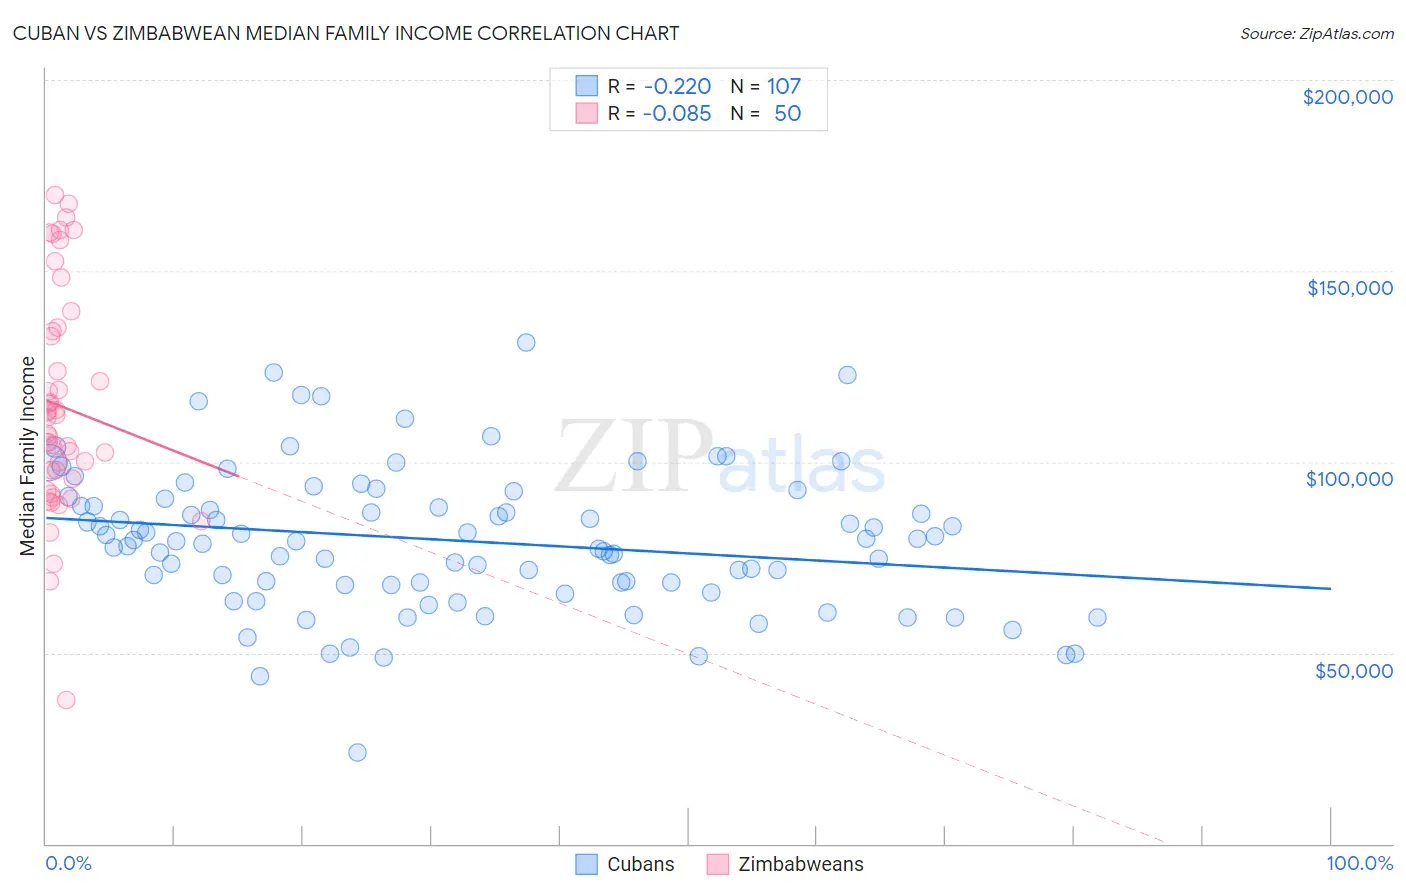
Cuban vs Zimbabwean Median Family Income Correlation Chart
The statistical analysis conducted on geographies consisting of 448,691,327 people shows a weak negative correlation between the proportion of Cubans and median family income in the United States with a correlation coefficient (R) of -0.220 and weighted average of $84,981. Similarly, the statistical analysis conducted on geographies consisting of 69,185,684 people shows a slight negative correlation between the proportion of Zimbabweans and median family income in the United States with a correlation coefficient (R) of -0.085 and weighted average of $110,011, a difference of 29.4%.
Median Family Income Correlation Summary
| Measurement | Cuban | Zimbabwean |
| Minimum | $23,750 | $37,500 |
| Maximum | $131,198 | $169,922 |
| Range | $107,448 | $132,422 |
| Mean | $79,388 | $114,541 |
| Median | $79,353 | $109,407 |
| Interquartile 25% (IQ1) | $67,815 | $95,466 |
| Interquartile 75% (IQ3) | $90,371 | $134,100 |
| Interquartile Range (IQR) | $22,555 | $38,634 |
| Standard Deviation (Sample) | $18,688 | $28,953 |
| Standard Deviation (Population) | $18,601 | $28,662 |
Similar Demographics by Median Family Income
Demographics Similar to Cubans by Median Family Income
In terms of median family income, the demographic groups most similar to Cubans are Honduran ($85,004, a difference of 0.030%), Immigrants from Central America ($85,050, a difference of 0.080%), Choctaw ($84,835, a difference of 0.17%), Haitian ($85,218, a difference of 0.28%), and Immigrants from Bahamas ($84,732, a difference of 0.29%).
| Demographics | Rating | Rank | Median Family Income |
| Paiute | 0.0 /100 | #305 | Tragic $85,414 |
| Immigrants | Dominica | 0.0 /100 | #306 | Tragic $85,411 |
| Chickasaw | 0.0 /100 | #307 | Tragic $85,356 |
| U.S. Virgin Islanders | 0.0 /100 | #308 | Tragic $85,294 |
| Haitians | 0.0 /100 | #309 | Tragic $85,218 |
| Immigrants | Central America | 0.0 /100 | #310 | Tragic $85,050 |
| Hondurans | 0.0 /100 | #311 | Tragic $85,004 |
| Cubans | 0.0 /100 | #312 | Tragic $84,981 |
| Choctaw | 0.0 /100 | #313 | Tragic $84,835 |
| Immigrants | Bahamas | 0.0 /100 | #314 | Tragic $84,732 |
| Apache | 0.0 /100 | #315 | Tragic $84,451 |
| Immigrants | Haiti | 0.0 /100 | #316 | Tragic $84,018 |
| Yakama | 0.0 /100 | #317 | Tragic $83,932 |
| Immigrants | Mexico | 0.0 /100 | #318 | Tragic $83,639 |
| Immigrants | Honduras | 0.0 /100 | #319 | Tragic $83,618 |
Demographics Similar to Zimbabweans by Median Family Income
In terms of median family income, the demographic groups most similar to Zimbabweans are Immigrants from Moldova ($109,975, a difference of 0.030%), Korean ($110,103, a difference of 0.080%), Immigrants from Kazakhstan ($110,137, a difference of 0.11%), Immigrants from Lebanon ($110,159, a difference of 0.13%), and Jordanian ($109,865, a difference of 0.13%).
| Demographics | Rating | Rank | Median Family Income |
| Romanians | 98.8 /100 | #88 | Exceptional $111,243 |
| Immigrants | Argentina | 98.5 /100 | #89 | Exceptional $110,873 |
| Northern Europeans | 98.3 /100 | #90 | Exceptional $110,635 |
| Immigrants | Southern Europe | 98.3 /100 | #91 | Exceptional $110,614 |
| Immigrants | Lebanon | 97.9 /100 | #92 | Exceptional $110,159 |
| Immigrants | Kazakhstan | 97.8 /100 | #93 | Exceptional $110,137 |
| Koreans | 97.8 /100 | #94 | Exceptional $110,103 |
| Zimbabweans | 97.7 /100 | #95 | Exceptional $110,011 |
| Immigrants | Moldova | 97.7 /100 | #96 | Exceptional $109,975 |
| Jordanians | 97.5 /100 | #97 | Exceptional $109,865 |
| Immigrants | Kuwait | 97.4 /100 | #98 | Exceptional $109,731 |
| Armenians | 97.3 /100 | #99 | Exceptional $109,692 |
| Macedonians | 97.3 /100 | #100 | Exceptional $109,668 |
| Immigrants | Ukraine | 97.2 /100 | #101 | Exceptional $109,645 |
| Assyrians/Chaldeans/Syriacs | 97.2 /100 | #102 | Exceptional $109,622 |