Crow vs Costa Rican Unemployment Among Ages 20 to 24 years
COMPARE
Crow
Costa Rican
Unemployment Among Ages 20 to 24 years
Unemployment Among Ages 20 to 24 years Comparison
Crow
Costa Ricans
18.7%
UNEMPLOYMENT AMONG AGES 20 TO 24 YEARS
0.0/ 100
METRIC RATING
344th/ 347
METRIC RANK
10.5%
UNEMPLOYMENT AMONG AGES 20 TO 24 YEARS
9.6/ 100
METRIC RATING
216th/ 347
METRIC RANK
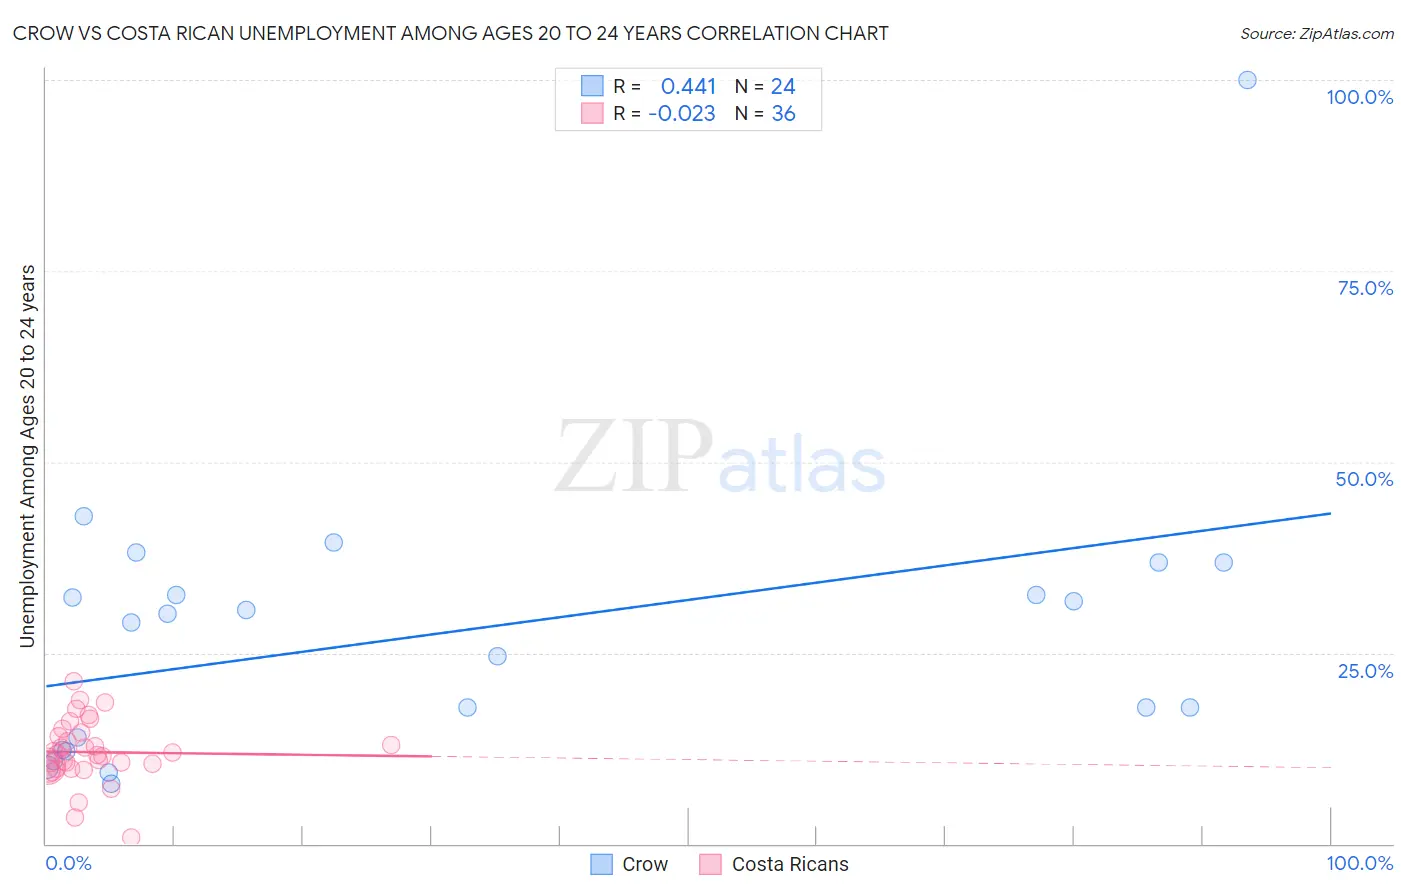
Crow vs Costa Rican Unemployment Among Ages 20 to 24 years Correlation Chart
The statistical analysis conducted on geographies consisting of 58,497,942 people shows a moderate positive correlation between the proportion of Crow and unemployment rate among population between the ages 20 and 24 in the United States with a correlation coefficient (R) of 0.441 and weighted average of 18.7%. Similarly, the statistical analysis conducted on geographies consisting of 249,783,382 people shows no correlation between the proportion of Costa Ricans and unemployment rate among population between the ages 20 and 24 in the United States with a correlation coefficient (R) of -0.023 and weighted average of 10.5%, a difference of 78.1%.
Unemployment Among Ages 20 to 24 years Correlation Summary
| Measurement | Crow | Costa Rican |
| Minimum | 7.8% | 0.80% |
| Maximum | 100.0% | 21.3% |
| Range | 92.2% | 20.5% |
| Mean | 27.8% | 12.0% |
| Median | 29.6% | 11.7% |
| Interquartile 25% (IQ1) | 13.1% | 10.1% |
| Interquartile 75% (IQ3) | 34.7% | 14.3% |
| Interquartile Range (IQR) | 21.7% | 4.3% |
| Standard Deviation (Sample) | 19.0% | 4.1% |
| Standard Deviation (Population) | 18.6% | 4.1% |
Similar Demographics by Unemployment Among Ages 20 to 24 years
Demographics Similar to Crow by Unemployment Among Ages 20 to 24 years
In terms of unemployment among ages 20 to 24 years, the demographic groups most similar to Crow are Tsimshian (18.0%, a difference of 4.2%), Hopi (19.9%, a difference of 6.2%), Yup'ik (20.9%, a difference of 11.4%), Inupiat (20.9%, a difference of 11.7%), and Puerto Rican (16.7%, a difference of 12.5%).
| Demographics | Rating | Rank | Unemployment Among Ages 20 to 24 years |
| Immigrants | Guyana | 0.0 /100 | #333 | Tragic 13.9% |
| Guyanese | 0.0 /100 | #334 | Tragic 14.0% |
| Sioux | 0.0 /100 | #335 | Tragic 14.2% |
| Pima | 0.0 /100 | #336 | Tragic 14.2% |
| Paiute | 0.0 /100 | #337 | Tragic 14.3% |
| Immigrants | St. Vincent and the Grenadines | 0.0 /100 | #338 | Tragic 14.3% |
| Immigrants | Yemen | 0.0 /100 | #339 | Tragic 14.9% |
| Yuman | 0.0 /100 | #340 | Tragic 15.8% |
| Navajo | 0.0 /100 | #341 | Tragic 16.1% |
| Puerto Ricans | 0.0 /100 | #342 | Tragic 16.7% |
| Tsimshian | 0.0 /100 | #343 | Tragic 18.0% |
| Crow | 0.0 /100 | #344 | Tragic 18.7% |
| Hopi | 0.0 /100 | #345 | Tragic 19.9% |
| Yup'ik | 0.0 /100 | #346 | Tragic 20.9% |
| Inupiat | 0.0 /100 | #347 | Tragic 20.9% |
Demographics Similar to Costa Ricans by Unemployment Among Ages 20 to 24 years
In terms of unemployment among ages 20 to 24 years, the demographic groups most similar to Costa Ricans are Cherokee (10.5%, a difference of 0.030%), Honduran (10.5%, a difference of 0.090%), Nonimmigrants (10.5%, a difference of 0.090%), Immigrants from Southern Europe (10.5%, a difference of 0.18%), and Kiowa (10.5%, a difference of 0.20%).
| Demographics | Rating | Rank | Unemployment Among Ages 20 to 24 years |
| Peruvians | 17.2 /100 | #209 | Poor 10.5% |
| Immigrants | Belgium | 16.9 /100 | #210 | Poor 10.5% |
| Immigrants | Guatemala | 14.6 /100 | #211 | Poor 10.5% |
| Immigrants | Sri Lanka | 14.0 /100 | #212 | Poor 10.5% |
| Guatemalans | 12.2 /100 | #213 | Poor 10.5% |
| Kiowa | 11.7 /100 | #214 | Poor 10.5% |
| Hondurans | 10.5 /100 | #215 | Poor 10.5% |
| Costa Ricans | 9.6 /100 | #216 | Tragic 10.5% |
| Cherokee | 9.3 /100 | #217 | Tragic 10.5% |
| Immigrants | Nonimmigrants | 8.8 /100 | #218 | Tragic 10.5% |
| Immigrants | Southern Europe | 8.0 /100 | #219 | Tragic 10.5% |
| Eastern Europeans | 6.9 /100 | #220 | Tragic 10.6% |
| Central Americans | 6.8 /100 | #221 | Tragic 10.6% |
| Immigrants | Poland | 6.4 /100 | #222 | Tragic 10.6% |
| Arabs | 5.6 /100 | #223 | Tragic 10.6% |