Cree vs Immigrants from Lithuania Median Female Earnings
COMPARE
Cree
Immigrants from Lithuania
Median Female Earnings
Median Female Earnings Comparison
Cree
Immigrants from Lithuania
$37,018
MEDIAN FEMALE EARNINGS
0.4/ 100
METRIC RATING
268th/ 347
METRIC RANK
$43,317
MEDIAN FEMALE EARNINGS
99.9/ 100
METRIC RATING
52nd/ 347
METRIC RANK
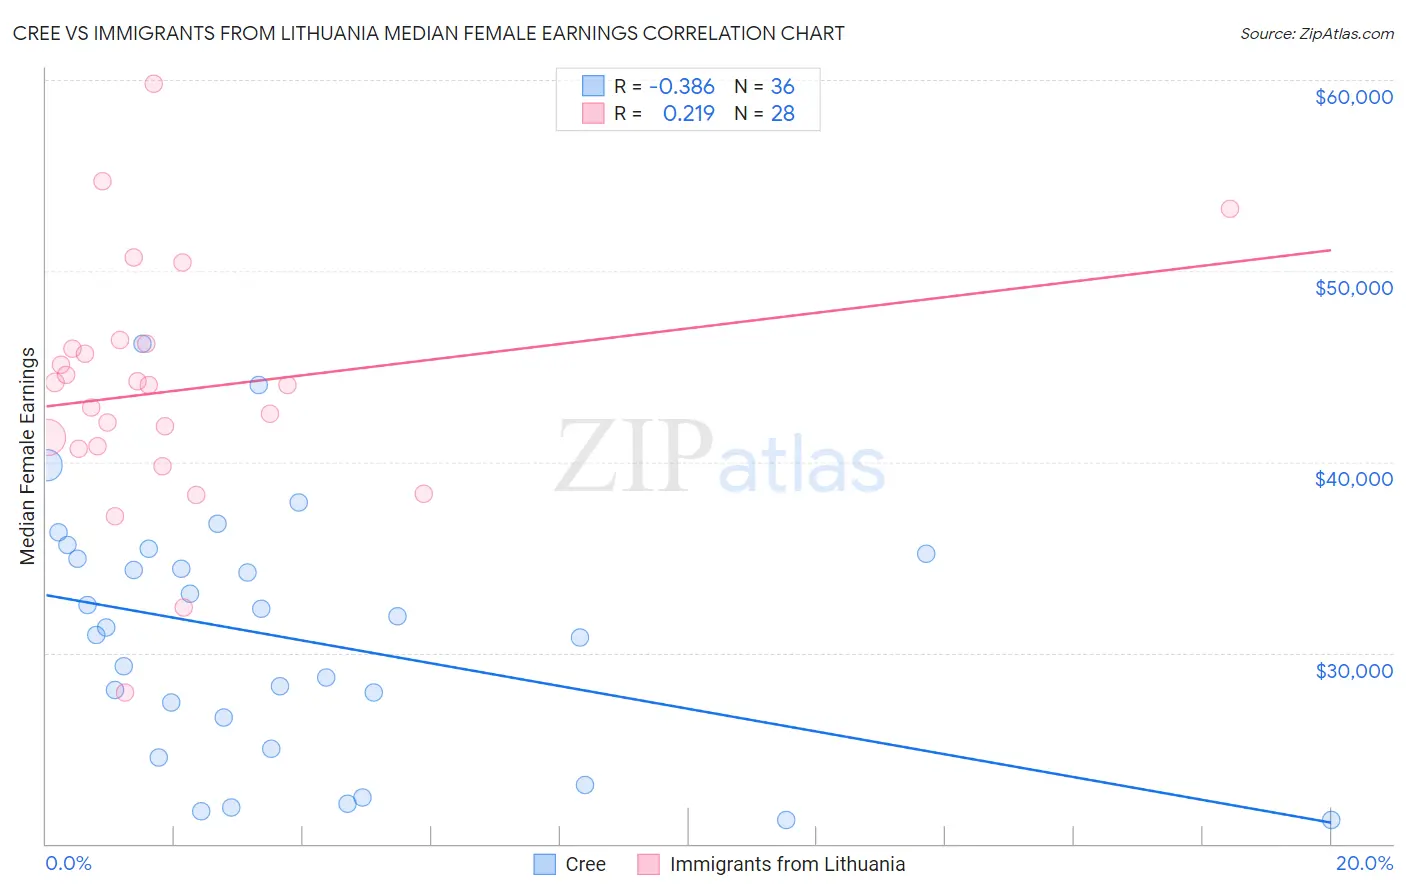
Cree vs Immigrants from Lithuania Median Female Earnings Correlation Chart
The statistical analysis conducted on geographies consisting of 76,188,527 people shows a mild negative correlation between the proportion of Cree and median female earnings in the United States with a correlation coefficient (R) of -0.386 and weighted average of $37,018. Similarly, the statistical analysis conducted on geographies consisting of 117,702,564 people shows a weak positive correlation between the proportion of Immigrants from Lithuania and median female earnings in the United States with a correlation coefficient (R) of 0.219 and weighted average of $43,317, a difference of 17.0%.
Median Female Earnings Correlation Summary
| Measurement | Cree | Immigrants from Lithuania |
| Minimum | $21,250 | $27,947 |
| Maximum | $46,168 | $59,782 |
| Range | $24,918 | $31,835 |
| Mean | $30,765 | $43,754 |
| Median | $31,124 | $44,042 |
| Interquartile 25% (IQ1) | $25,810 | $40,753 |
| Interquartile 75% (IQ3) | $35,030 | $46,071 |
| Interquartile Range (IQR) | $9,221 | $5,319 |
| Standard Deviation (Sample) | $6,370 | $6,428 |
| Standard Deviation (Population) | $6,281 | $6,312 |
Similar Demographics by Median Female Earnings
Demographics Similar to Cree by Median Female Earnings
In terms of median female earnings, the demographic groups most similar to Cree are Nonimmigrants ($37,024, a difference of 0.010%), Immigrants from Venezuela ($37,003, a difference of 0.040%), Dominican ($37,046, a difference of 0.070%), Immigrants from Belize ($37,056, a difference of 0.10%), and Salvadoran ($37,083, a difference of 0.18%).
| Demographics | Rating | Rank | Median Female Earnings |
| Malaysians | 0.7 /100 | #261 | Tragic $37,298 |
| Venezuelans | 0.7 /100 | #262 | Tragic $37,282 |
| German Russians | 0.5 /100 | #263 | Tragic $37,105 |
| Salvadorans | 0.4 /100 | #264 | Tragic $37,083 |
| Immigrants | Belize | 0.4 /100 | #265 | Tragic $37,056 |
| Dominicans | 0.4 /100 | #266 | Tragic $37,046 |
| Immigrants | Nonimmigrants | 0.4 /100 | #267 | Tragic $37,024 |
| Cree | 0.4 /100 | #268 | Tragic $37,018 |
| Immigrants | Venezuela | 0.4 /100 | #269 | Tragic $37,003 |
| French American Indians | 0.3 /100 | #270 | Tragic $36,920 |
| Nicaraguans | 0.3 /100 | #271 | Tragic $36,904 |
| Immigrants | Dominican Republic | 0.3 /100 | #272 | Tragic $36,857 |
| Immigrants | Laos | 0.3 /100 | #273 | Tragic $36,841 |
| Immigrants | El Salvador | 0.2 /100 | #274 | Tragic $36,673 |
| Africans | 0.1 /100 | #275 | Tragic $36,530 |
Demographics Similar to Immigrants from Lithuania by Median Female Earnings
In terms of median female earnings, the demographic groups most similar to Immigrants from Lithuania are Immigrants from Eastern Europe ($43,309, a difference of 0.020%), Australian ($43,308, a difference of 0.020%), Egyptian ($43,305, a difference of 0.030%), Maltese ($43,357, a difference of 0.090%), and Immigrants from Uzbekistan ($43,363, a difference of 0.11%).
| Demographics | Rating | Rank | Median Female Earnings |
| Immigrants | Europe | 100.0 /100 | #45 | Exceptional $43,523 |
| Immigrants | Bolivia | 100.0 /100 | #46 | Exceptional $43,467 |
| Bolivians | 100.0 /100 | #47 | Exceptional $43,445 |
| Immigrants | Indonesia | 100.0 /100 | #48 | Exceptional $43,412 |
| Immigrants | Serbia | 100.0 /100 | #49 | Exceptional $43,385 |
| Immigrants | Uzbekistan | 100.0 /100 | #50 | Exceptional $43,363 |
| Maltese | 100.0 /100 | #51 | Exceptional $43,357 |
| Immigrants | Lithuania | 99.9 /100 | #52 | Exceptional $43,317 |
| Immigrants | Eastern Europe | 99.9 /100 | #53 | Exceptional $43,309 |
| Australians | 99.9 /100 | #54 | Exceptional $43,308 |
| Egyptians | 99.9 /100 | #55 | Exceptional $43,305 |
| Immigrants | Croatia | 99.9 /100 | #56 | Exceptional $43,258 |
| Ethiopians | 99.9 /100 | #57 | Exceptional $43,243 |
| Paraguayans | 99.9 /100 | #58 | Exceptional $43,173 |
| Estonians | 99.9 /100 | #59 | Exceptional $43,106 |