Cree vs Immigrants from Latvia Median Female Earnings
COMPARE
Cree
Immigrants from Latvia
Median Female Earnings
Median Female Earnings Comparison
Cree
Immigrants from Latvia
$37,018
MEDIAN FEMALE EARNINGS
0.4/ 100
METRIC RATING
268th/ 347
METRIC RANK
$43,099
MEDIAN FEMALE EARNINGS
99.9/ 100
METRIC RATING
60th/ 347
METRIC RANK
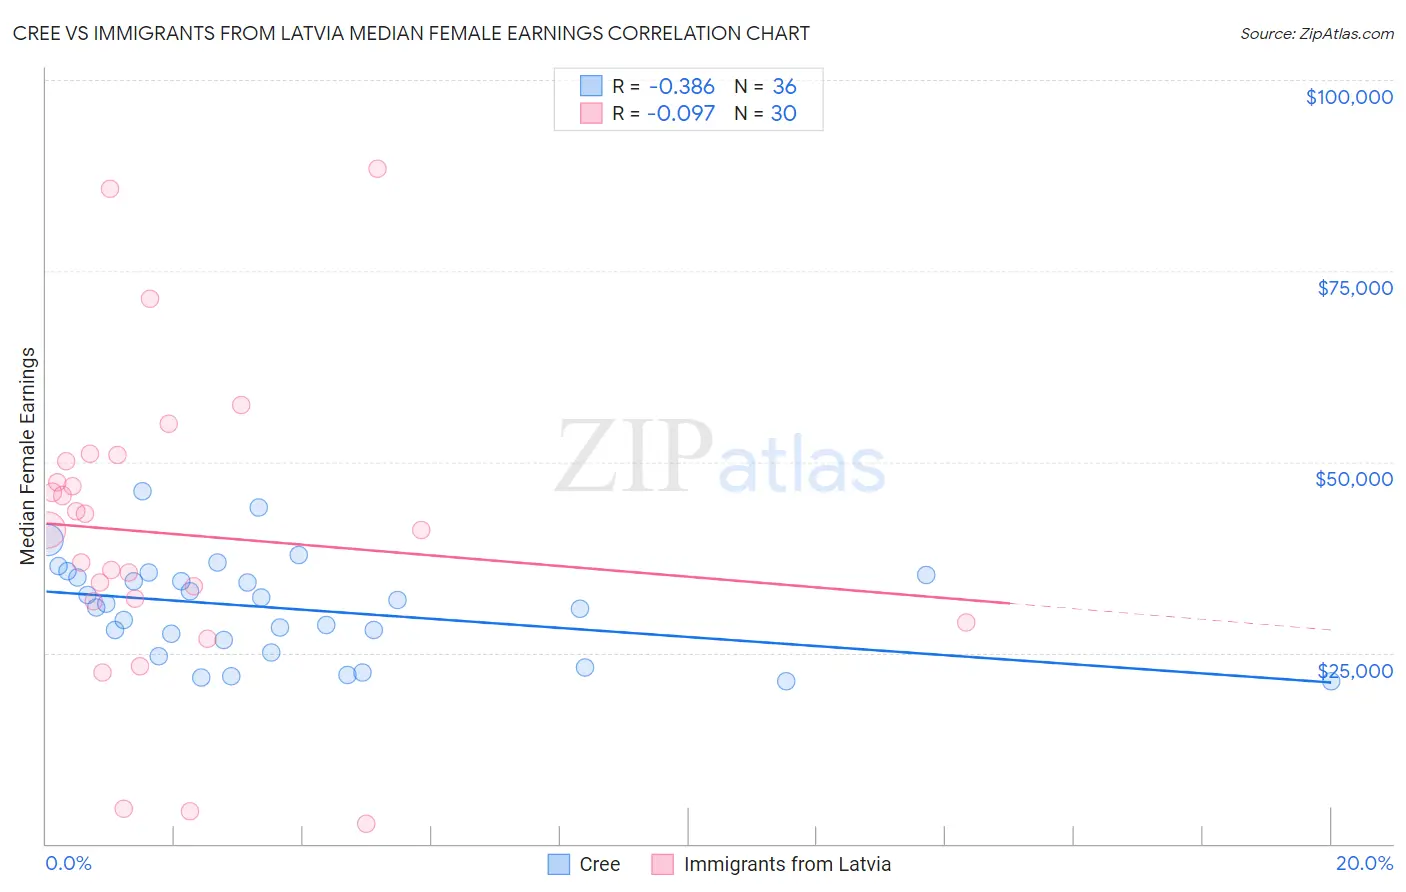
Cree vs Immigrants from Latvia Median Female Earnings Correlation Chart
The statistical analysis conducted on geographies consisting of 76,188,527 people shows a mild negative correlation between the proportion of Cree and median female earnings in the United States with a correlation coefficient (R) of -0.386 and weighted average of $37,018. Similarly, the statistical analysis conducted on geographies consisting of 113,735,642 people shows a slight negative correlation between the proportion of Immigrants from Latvia and median female earnings in the United States with a correlation coefficient (R) of -0.097 and weighted average of $43,099, a difference of 16.4%.
Median Female Earnings Correlation Summary
| Measurement | Cree | Immigrants from Latvia |
| Minimum | $21,250 | $2,606 |
| Maximum | $46,168 | $88,365 |
| Range | $24,918 | $85,759 |
| Mean | $30,765 | $40,583 |
| Median | $31,124 | $41,080 |
| Interquartile 25% (IQ1) | $25,810 | $31,765 |
| Interquartile 75% (IQ3) | $35,030 | $50,109 |
| Interquartile Range (IQR) | $9,221 | $18,344 |
| Standard Deviation (Sample) | $6,370 | $19,932 |
| Standard Deviation (Population) | $6,281 | $19,597 |
Similar Demographics by Median Female Earnings
Demographics Similar to Cree by Median Female Earnings
In terms of median female earnings, the demographic groups most similar to Cree are Nonimmigrants ($37,024, a difference of 0.010%), Immigrants from Venezuela ($37,003, a difference of 0.040%), Dominican ($37,046, a difference of 0.070%), Immigrants from Belize ($37,056, a difference of 0.10%), and Salvadoran ($37,083, a difference of 0.18%).
| Demographics | Rating | Rank | Median Female Earnings |
| Malaysians | 0.7 /100 | #261 | Tragic $37,298 |
| Venezuelans | 0.7 /100 | #262 | Tragic $37,282 |
| German Russians | 0.5 /100 | #263 | Tragic $37,105 |
| Salvadorans | 0.4 /100 | #264 | Tragic $37,083 |
| Immigrants | Belize | 0.4 /100 | #265 | Tragic $37,056 |
| Dominicans | 0.4 /100 | #266 | Tragic $37,046 |
| Immigrants | Nonimmigrants | 0.4 /100 | #267 | Tragic $37,024 |
| Cree | 0.4 /100 | #268 | Tragic $37,018 |
| Immigrants | Venezuela | 0.4 /100 | #269 | Tragic $37,003 |
| French American Indians | 0.3 /100 | #270 | Tragic $36,920 |
| Nicaraguans | 0.3 /100 | #271 | Tragic $36,904 |
| Immigrants | Dominican Republic | 0.3 /100 | #272 | Tragic $36,857 |
| Immigrants | Laos | 0.3 /100 | #273 | Tragic $36,841 |
| Immigrants | El Salvador | 0.2 /100 | #274 | Tragic $36,673 |
| Africans | 0.1 /100 | #275 | Tragic $36,530 |
Demographics Similar to Immigrants from Latvia by Median Female Earnings
In terms of median female earnings, the demographic groups most similar to Immigrants from Latvia are Estonian ($43,106, a difference of 0.020%), Immigrants from Bulgaria ($43,085, a difference of 0.030%), Afghan ($43,077, a difference of 0.050%), Immigrants from Ukraine ($43,069, a difference of 0.070%), and Immigrants from Pakistan ($43,052, a difference of 0.11%).
| Demographics | Rating | Rank | Median Female Earnings |
| Immigrants | Eastern Europe | 99.9 /100 | #53 | Exceptional $43,309 |
| Australians | 99.9 /100 | #54 | Exceptional $43,308 |
| Egyptians | 99.9 /100 | #55 | Exceptional $43,305 |
| Immigrants | Croatia | 99.9 /100 | #56 | Exceptional $43,258 |
| Ethiopians | 99.9 /100 | #57 | Exceptional $43,243 |
| Paraguayans | 99.9 /100 | #58 | Exceptional $43,173 |
| Estonians | 99.9 /100 | #59 | Exceptional $43,106 |
| Immigrants | Latvia | 99.9 /100 | #60 | Exceptional $43,099 |
| Immigrants | Bulgaria | 99.9 /100 | #61 | Exceptional $43,085 |
| Afghans | 99.9 /100 | #62 | Exceptional $43,077 |
| Immigrants | Ukraine | 99.9 /100 | #63 | Exceptional $43,069 |
| Immigrants | Pakistan | 99.9 /100 | #64 | Exceptional $43,052 |
| Sierra Leoneans | 99.9 /100 | #65 | Exceptional $42,868 |
| Immigrants | Norway | 99.9 /100 | #66 | Exceptional $42,837 |
| Immigrants | Egypt | 99.9 /100 | #67 | Exceptional $42,837 |