Cree vs Immigrants from Netherlands Wage/Income Gap
COMPARE
Cree
Immigrants from Netherlands
Wage/Income Gap
Wage/Income Gap Comparison
Cree
Immigrants from Netherlands
24.5%
WAGE/INCOME GAP
95.6/ 100
METRIC RATING
120th/ 347
METRIC RANK
28.5%
WAGE/INCOME GAP
0.2/ 100
METRIC RATING
304th/ 347
METRIC RANK
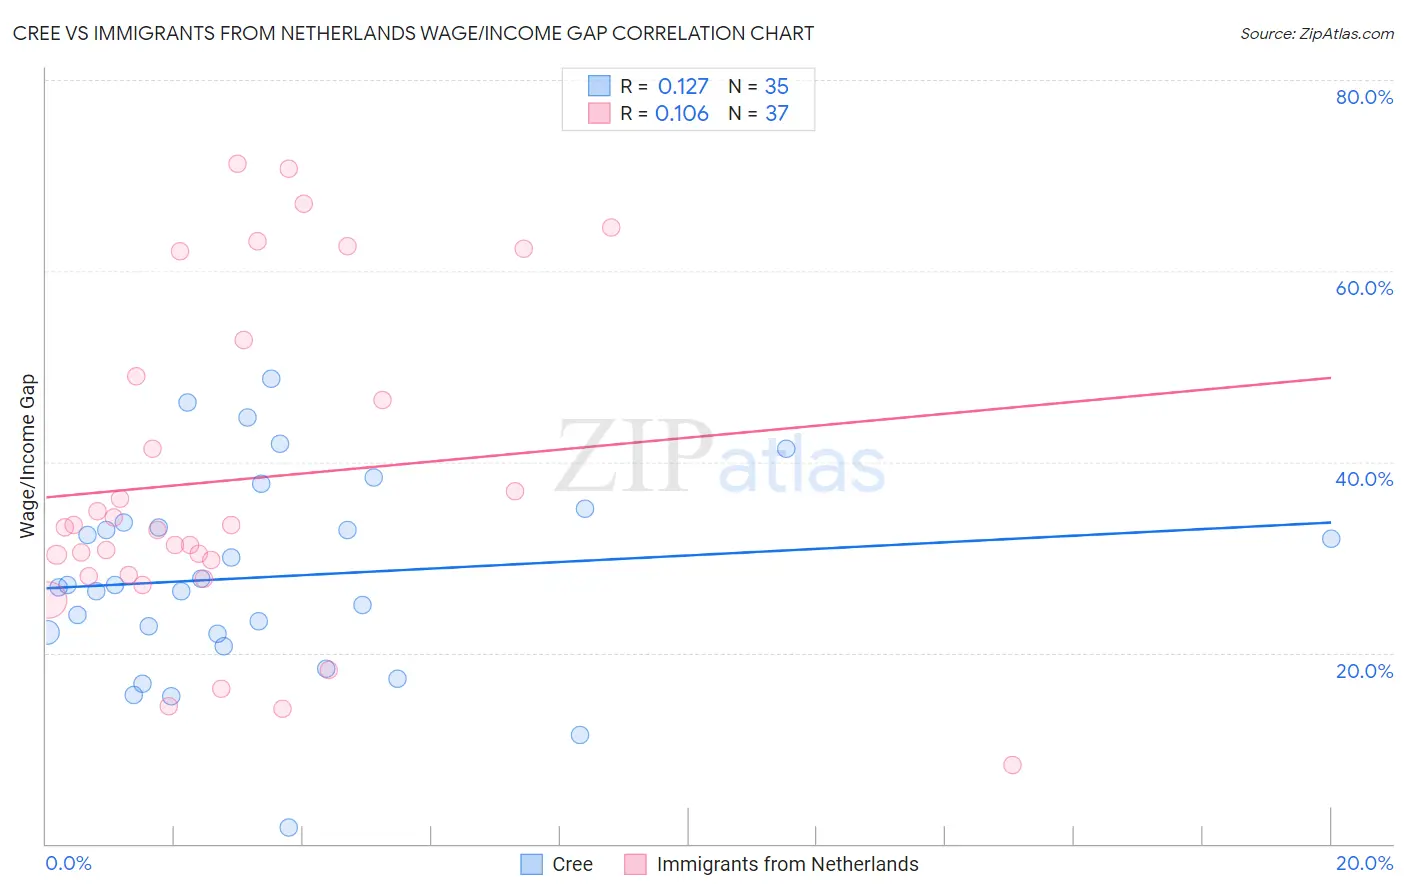
Cree vs Immigrants from Netherlands Wage/Income Gap Correlation Chart
The statistical analysis conducted on geographies consisting of 76,178,665 people shows a poor positive correlation between the proportion of Cree and wage/income gap percentage in the United States with a correlation coefficient (R) of 0.127 and weighted average of 24.5%. Similarly, the statistical analysis conducted on geographies consisting of 237,766,220 people shows a poor positive correlation between the proportion of Immigrants from Netherlands and wage/income gap percentage in the United States with a correlation coefficient (R) of 0.106 and weighted average of 28.5%, a difference of 16.4%.
Wage/Income Gap Correlation Summary
| Measurement | Cree | Immigrants from Netherlands |
| Minimum | 1.7% | 8.2% |
| Maximum | 48.7% | 71.2% |
| Range | 47.0% | 63.0% |
| Mean | 28.0% | 38.1% |
| Median | 27.1% | 33.2% |
| Interquartile 25% (IQ1) | 21.9% | 28.1% |
| Interquartile 75% (IQ3) | 33.6% | 50.9% |
| Interquartile Range (IQR) | 11.7% | 22.8% |
| Standard Deviation (Sample) | 10.3% | 17.1% |
| Standard Deviation (Population) | 10.2% | 16.9% |
Similar Demographics by Wage/Income Gap
Demographics Similar to Cree by Wage/Income Gap
In terms of wage/income gap, the demographic groups most similar to Cree are Kenyan (24.5%, a difference of 0.070%), Immigrants from Micronesia (24.4%, a difference of 0.090%), Immigrants from Afghanistan (24.4%, a difference of 0.13%), Alaska Native (24.4%, a difference of 0.19%), and Immigrants from Thailand (24.5%, a difference of 0.27%).
| Demographics | Rating | Rank | Wage/Income Gap |
| Sioux | 96.9 /100 | #113 | Exceptional 24.3% |
| Panamanians | 96.5 /100 | #114 | Exceptional 24.4% |
| Immigrants | Kenya | 96.4 /100 | #115 | Exceptional 24.4% |
| Alaska Natives | 96.0 /100 | #116 | Exceptional 24.4% |
| Immigrants | Afghanistan | 95.9 /100 | #117 | Exceptional 24.4% |
| Immigrants | Micronesia | 95.8 /100 | #118 | Exceptional 24.4% |
| Kenyans | 95.8 /100 | #119 | Exceptional 24.5% |
| Cree | 95.6 /100 | #120 | Exceptional 24.5% |
| Immigrants | Thailand | 94.9 /100 | #121 | Exceptional 24.5% |
| Apache | 94.8 /100 | #122 | Exceptional 24.5% |
| Natives/Alaskans | 94.6 /100 | #123 | Exceptional 24.6% |
| Immigrants | South America | 93.9 /100 | #124 | Exceptional 24.6% |
| Spanish Americans | 93.8 /100 | #125 | Exceptional 24.6% |
| Immigrants | Uruguay | 93.8 /100 | #126 | Exceptional 24.6% |
| German Russians | 93.7 /100 | #127 | Exceptional 24.6% |
Demographics Similar to Immigrants from Netherlands by Wage/Income Gap
In terms of wage/income gap, the demographic groups most similar to Immigrants from Netherlands are Immigrants from South Africa (28.5%, a difference of 0.020%), White/Caucasian (28.5%, a difference of 0.060%), Immigrants from Denmark (28.5%, a difference of 0.070%), Scotch-Irish (28.5%, a difference of 0.080%), and Irish (28.5%, a difference of 0.080%).
| Demographics | Rating | Rank | Wage/Income Gap |
| Immigrants | North America | 0.2 /100 | #297 | Tragic 28.4% |
| Austrians | 0.2 /100 | #298 | Tragic 28.4% |
| Immigrants | North Macedonia | 0.2 /100 | #299 | Tragic 28.4% |
| Immigrants | Northern Europe | 0.2 /100 | #300 | Tragic 28.5% |
| Immigrants | Canada | 0.2 /100 | #301 | Tragic 28.5% |
| Scotch-Irish | 0.2 /100 | #302 | Tragic 28.5% |
| Irish | 0.2 /100 | #303 | Tragic 28.5% |
| Immigrants | Netherlands | 0.2 /100 | #304 | Tragic 28.5% |
| Immigrants | South Africa | 0.1 /100 | #305 | Tragic 28.5% |
| Whites/Caucasians | 0.1 /100 | #306 | Tragic 28.5% |
| Immigrants | Denmark | 0.1 /100 | #307 | Tragic 28.5% |
| Poles | 0.1 /100 | #308 | Tragic 28.5% |
| Macedonians | 0.1 /100 | #309 | Tragic 28.6% |
| Finns | 0.1 /100 | #310 | Tragic 28.6% |
| Immigrants | Lithuania | 0.1 /100 | #311 | Tragic 28.6% |