Cree vs Alaskan Athabascan Median Female Earnings
COMPARE
Cree
Alaskan Athabascan
Median Female Earnings
Median Female Earnings Comparison
Cree
Alaskan Athabascans
$37,018
MEDIAN FEMALE EARNINGS
0.4/ 100
METRIC RATING
268th/ 347
METRIC RANK
$37,905
MEDIAN FEMALE EARNINGS
2.3/ 100
METRIC RATING
248th/ 347
METRIC RANK
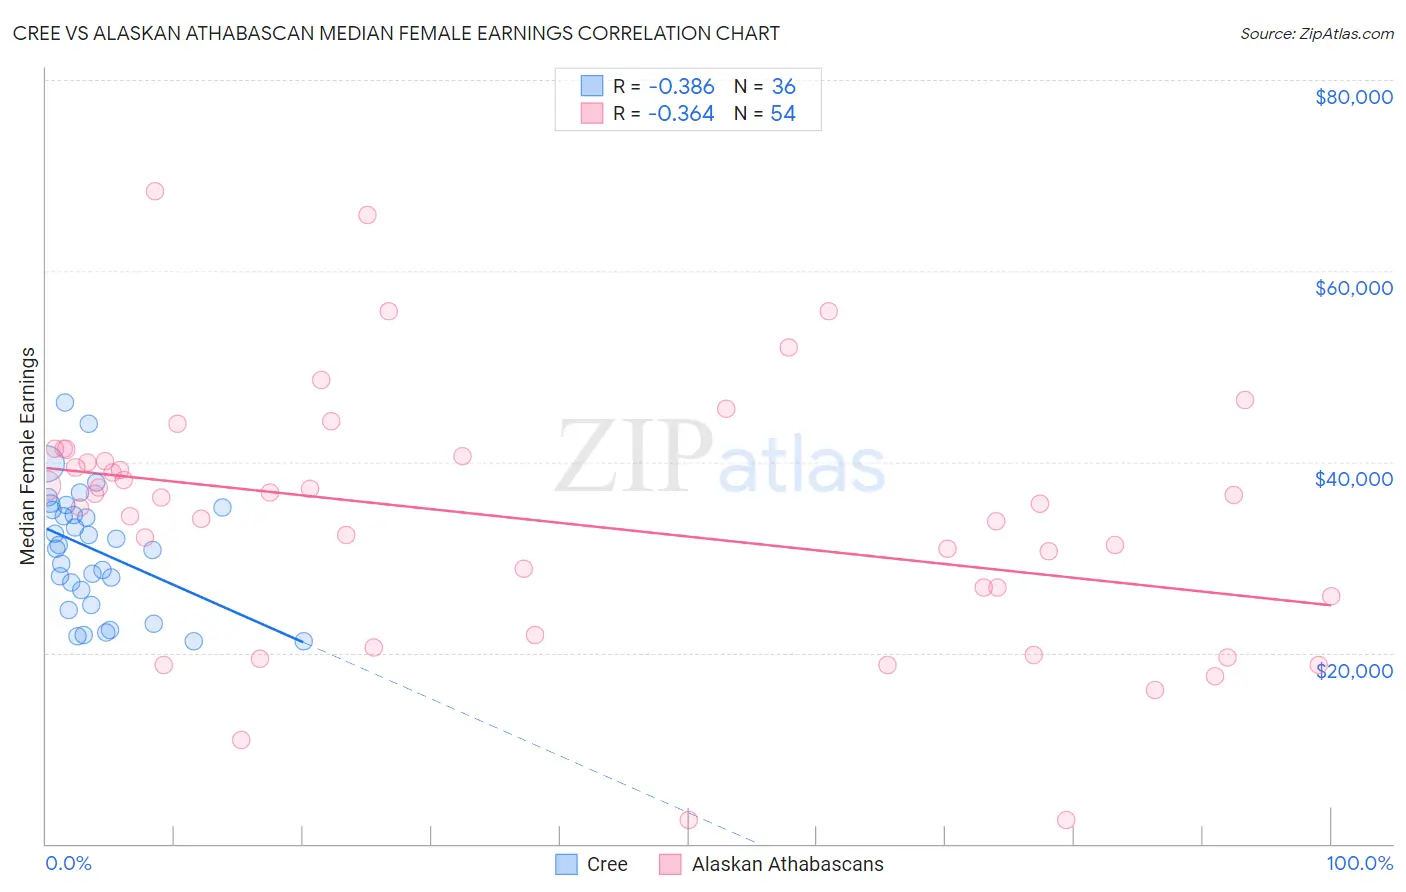
Cree vs Alaskan Athabascan Median Female Earnings Correlation Chart
The statistical analysis conducted on geographies consisting of 76,188,527 people shows a mild negative correlation between the proportion of Cree and median female earnings in the United States with a correlation coefficient (R) of -0.386 and weighted average of $37,018. Similarly, the statistical analysis conducted on geographies consisting of 45,800,514 people shows a mild negative correlation between the proportion of Alaskan Athabascans and median female earnings in the United States with a correlation coefficient (R) of -0.364 and weighted average of $37,905, a difference of 2.4%.
Median Female Earnings Correlation Summary
| Measurement | Cree | Alaskan Athabascan |
| Minimum | $21,250 | $2,499 |
| Maximum | $46,168 | $68,290 |
| Range | $24,918 | $65,791 |
| Mean | $30,765 | $33,896 |
| Median | $31,124 | $35,954 |
| Interquartile 25% (IQ1) | $25,810 | $25,923 |
| Interquartile 75% (IQ3) | $35,030 | $40,625 |
| Interquartile Range (IQR) | $9,221 | $14,702 |
| Standard Deviation (Sample) | $6,370 | $13,459 |
| Standard Deviation (Population) | $6,281 | $13,333 |
Demographics Similar to Cree and Alaskan Athabascans by Median Female Earnings
In terms of median female earnings, the demographic groups most similar to Cree are Nonimmigrants ($37,024, a difference of 0.010%), Dominican ($37,046, a difference of 0.070%), Immigrants from Belize ($37,056, a difference of 0.10%), Salvadoran ($37,083, a difference of 0.18%), and German Russian ($37,105, a difference of 0.24%). Similarly, the demographic groups most similar to Alaskan Athabascans are Swiss ($37,904, a difference of 0.0%), Immigrants from Iraq ($37,864, a difference of 0.11%), Welsh ($37,856, a difference of 0.13%), Immigrants from Dominica ($37,825, a difference of 0.21%), and Danish ($37,730, a difference of 0.46%).
| Demographics | Rating | Rank | Median Female Earnings |
| Alaskan Athabascans | 2.3 /100 | #248 | Tragic $37,905 |
| Swiss | 2.3 /100 | #249 | Tragic $37,904 |
| Immigrants | Iraq | 2.2 /100 | #250 | Tragic $37,864 |
| Welsh | 2.1 /100 | #251 | Tragic $37,856 |
| Immigrants | Dominica | 2.0 /100 | #252 | Tragic $37,825 |
| Danes | 1.6 /100 | #253 | Tragic $37,730 |
| Whites/Caucasians | 1.1 /100 | #254 | Tragic $37,531 |
| Colville | 1.1 /100 | #255 | Tragic $37,514 |
| Samoans | 1.0 /100 | #256 | Tragic $37,498 |
| Hawaiians | 1.0 /100 | #257 | Tragic $37,497 |
| Belizeans | 0.9 /100 | #258 | Tragic $37,429 |
| Scotch-Irish | 0.8 /100 | #259 | Tragic $37,383 |
| Dutch | 0.7 /100 | #260 | Tragic $37,339 |
| Malaysians | 0.7 /100 | #261 | Tragic $37,298 |
| Venezuelans | 0.7 /100 | #262 | Tragic $37,282 |
| German Russians | 0.5 /100 | #263 | Tragic $37,105 |
| Salvadorans | 0.4 /100 | #264 | Tragic $37,083 |
| Immigrants | Belize | 0.4 /100 | #265 | Tragic $37,056 |
| Dominicans | 0.4 /100 | #266 | Tragic $37,046 |
| Immigrants | Nonimmigrants | 0.4 /100 | #267 | Tragic $37,024 |
| Cree | 0.4 /100 | #268 | Tragic $37,018 |