Cree vs Osage Median Female Earnings
COMPARE
Cree
Osage
Median Female Earnings
Median Female Earnings Comparison
Cree
Osage
$37,018
MEDIAN FEMALE EARNINGS
0.4/ 100
METRIC RATING
268th/ 347
METRIC RANK
$36,034
MEDIAN FEMALE EARNINGS
0.0/ 100
METRIC RATING
286th/ 347
METRIC RANK
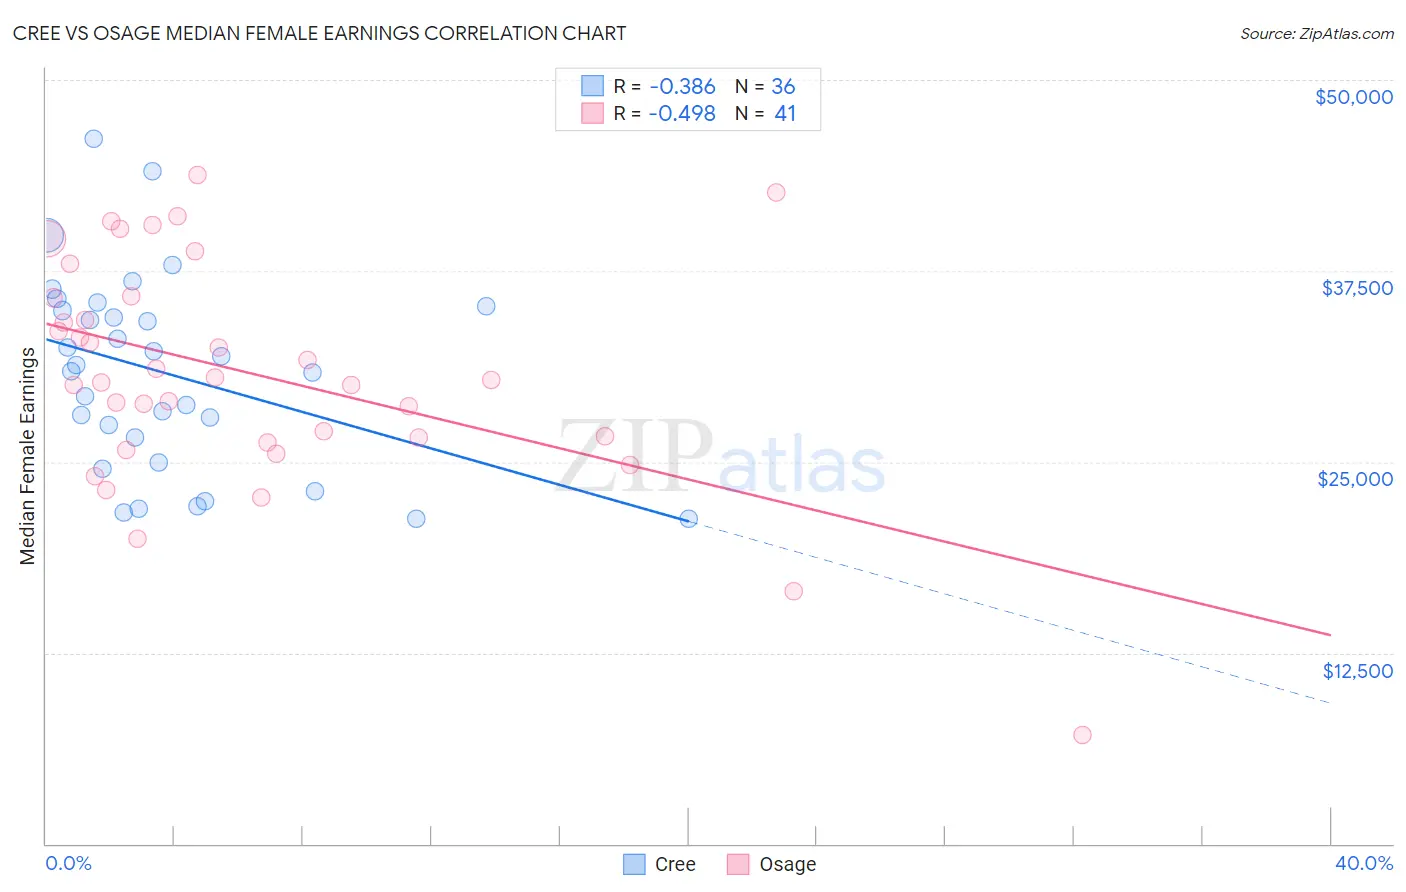
Cree vs Osage Median Female Earnings Correlation Chart
The statistical analysis conducted on geographies consisting of 76,188,527 people shows a mild negative correlation between the proportion of Cree and median female earnings in the United States with a correlation coefficient (R) of -0.386 and weighted average of $37,018. Similarly, the statistical analysis conducted on geographies consisting of 91,783,866 people shows a moderate negative correlation between the proportion of Osage and median female earnings in the United States with a correlation coefficient (R) of -0.498 and weighted average of $36,034, a difference of 2.7%.
Median Female Earnings Correlation Summary
| Measurement | Cree | Osage |
| Minimum | $21,250 | $7,083 |
| Maximum | $46,168 | $43,750 |
| Range | $24,918 | $36,667 |
| Mean | $30,765 | $30,795 |
| Median | $31,124 | $30,332 |
| Interquartile 25% (IQ1) | $25,810 | $26,425 |
| Interquartile 75% (IQ3) | $35,030 | $35,787 |
| Interquartile Range (IQR) | $9,221 | $9,362 |
| Standard Deviation (Sample) | $6,370 | $7,435 |
| Standard Deviation (Population) | $6,281 | $7,343 |
Demographics Similar to Cree and Osage by Median Female Earnings
In terms of median female earnings, the demographic groups most similar to Cree are Nonimmigrants ($37,024, a difference of 0.010%), Immigrants from Venezuela ($37,003, a difference of 0.040%), French American Indian ($36,920, a difference of 0.27%), Nicaraguan ($36,904, a difference of 0.31%), and Immigrants from Dominican Republic ($36,857, a difference of 0.44%). Similarly, the demographic groups most similar to Osage are Immigrants from Nicaragua ($36,023, a difference of 0.030%), Paiute ($36,056, a difference of 0.060%), Indonesian ($36,140, a difference of 0.29%), Immigrants from Haiti ($36,203, a difference of 0.47%), and Haitian ($36,374, a difference of 0.94%).
| Demographics | Rating | Rank | Median Female Earnings |
| Immigrants | Nonimmigrants | 0.4 /100 | #267 | Tragic $37,024 |
| Cree | 0.4 /100 | #268 | Tragic $37,018 |
| Immigrants | Venezuela | 0.4 /100 | #269 | Tragic $37,003 |
| French American Indians | 0.3 /100 | #270 | Tragic $36,920 |
| Nicaraguans | 0.3 /100 | #271 | Tragic $36,904 |
| Immigrants | Dominican Republic | 0.3 /100 | #272 | Tragic $36,857 |
| Immigrants | Laos | 0.3 /100 | #273 | Tragic $36,841 |
| Immigrants | El Salvador | 0.2 /100 | #274 | Tragic $36,673 |
| Africans | 0.1 /100 | #275 | Tragic $36,530 |
| Central Americans | 0.1 /100 | #276 | Tragic $36,492 |
| Marshallese | 0.1 /100 | #277 | Tragic $36,459 |
| U.S. Virgin Islanders | 0.1 /100 | #278 | Tragic $36,424 |
| Immigrants | Caribbean | 0.1 /100 | #279 | Tragic $36,414 |
| Iroquois | 0.1 /100 | #280 | Tragic $36,408 |
| Spanish Americans | 0.1 /100 | #281 | Tragic $36,391 |
| Haitians | 0.1 /100 | #282 | Tragic $36,374 |
| Immigrants | Haiti | 0.1 /100 | #283 | Tragic $36,203 |
| Indonesians | 0.1 /100 | #284 | Tragic $36,140 |
| Paiute | 0.1 /100 | #285 | Tragic $36,056 |
| Osage | 0.0 /100 | #286 | Tragic $36,034 |
| Immigrants | Nicaragua | 0.0 /100 | #287 | Tragic $36,023 |