Cree vs Immigrants from Sweden Median Female Earnings
COMPARE
Cree
Immigrants from Sweden
Median Female Earnings
Median Female Earnings Comparison
Cree
Immigrants from Sweden
$37,018
MEDIAN FEMALE EARNINGS
0.4/ 100
METRIC RATING
268th/ 347
METRIC RANK
$44,774
MEDIAN FEMALE EARNINGS
100.0/ 100
METRIC RATING
25th/ 347
METRIC RANK
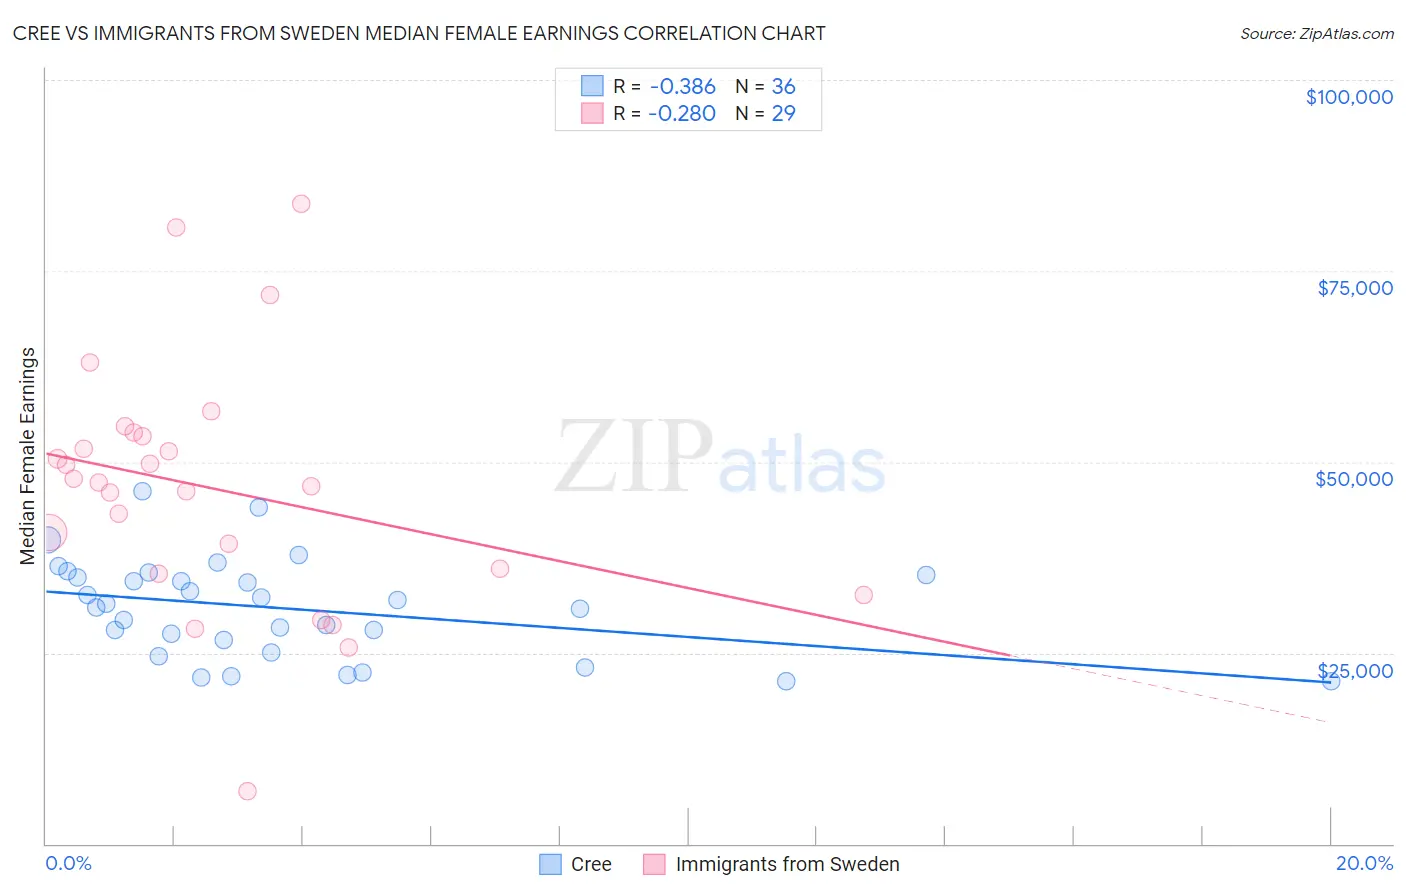
Cree vs Immigrants from Sweden Median Female Earnings Correlation Chart
The statistical analysis conducted on geographies consisting of 76,188,527 people shows a mild negative correlation between the proportion of Cree and median female earnings in the United States with a correlation coefficient (R) of -0.386 and weighted average of $37,018. Similarly, the statistical analysis conducted on geographies consisting of 164,714,291 people shows a weak negative correlation between the proportion of Immigrants from Sweden and median female earnings in the United States with a correlation coefficient (R) of -0.280 and weighted average of $44,774, a difference of 20.9%.
Median Female Earnings Correlation Summary
| Measurement | Cree | Immigrants from Sweden |
| Minimum | $21,250 | $6,800 |
| Maximum | $46,168 | $83,727 |
| Range | $24,918 | $76,927 |
| Mean | $30,765 | $46,568 |
| Median | $31,124 | $47,333 |
| Interquartile 25% (IQ1) | $25,810 | $35,642 |
| Interquartile 75% (IQ3) | $35,030 | $53,626 |
| Interquartile Range (IQR) | $9,221 | $17,985 |
| Standard Deviation (Sample) | $6,370 | $16,157 |
| Standard Deviation (Population) | $6,281 | $15,876 |
Similar Demographics by Median Female Earnings
Demographics Similar to Cree by Median Female Earnings
In terms of median female earnings, the demographic groups most similar to Cree are Nonimmigrants ($37,024, a difference of 0.010%), Immigrants from Venezuela ($37,003, a difference of 0.040%), Dominican ($37,046, a difference of 0.070%), Immigrants from Belize ($37,056, a difference of 0.10%), and Salvadoran ($37,083, a difference of 0.18%).
| Demographics | Rating | Rank | Median Female Earnings |
| Malaysians | 0.7 /100 | #261 | Tragic $37,298 |
| Venezuelans | 0.7 /100 | #262 | Tragic $37,282 |
| German Russians | 0.5 /100 | #263 | Tragic $37,105 |
| Salvadorans | 0.4 /100 | #264 | Tragic $37,083 |
| Immigrants | Belize | 0.4 /100 | #265 | Tragic $37,056 |
| Dominicans | 0.4 /100 | #266 | Tragic $37,046 |
| Immigrants | Nonimmigrants | 0.4 /100 | #267 | Tragic $37,024 |
| Cree | 0.4 /100 | #268 | Tragic $37,018 |
| Immigrants | Venezuela | 0.4 /100 | #269 | Tragic $37,003 |
| French American Indians | 0.3 /100 | #270 | Tragic $36,920 |
| Nicaraguans | 0.3 /100 | #271 | Tragic $36,904 |
| Immigrants | Dominican Republic | 0.3 /100 | #272 | Tragic $36,857 |
| Immigrants | Laos | 0.3 /100 | #273 | Tragic $36,841 |
| Immigrants | El Salvador | 0.2 /100 | #274 | Tragic $36,673 |
| Africans | 0.1 /100 | #275 | Tragic $36,530 |
Demographics Similar to Immigrants from Sweden by Median Female Earnings
In terms of median female earnings, the demographic groups most similar to Immigrants from Sweden are Immigrants from Belarus ($44,757, a difference of 0.040%), Immigrants from Korea ($44,847, a difference of 0.16%), Turkish ($44,695, a difference of 0.18%), Immigrants from Russia ($44,680, a difference of 0.21%), and Burmese ($44,911, a difference of 0.31%).
| Demographics | Rating | Rank | Median Female Earnings |
| Cypriots | 100.0 /100 | #18 | Exceptional $45,570 |
| Eastern Europeans | 100.0 /100 | #19 | Exceptional $45,385 |
| Immigrants | Japan | 100.0 /100 | #20 | Exceptional $45,323 |
| Cambodians | 100.0 /100 | #21 | Exceptional $45,014 |
| Immigrants | Greece | 100.0 /100 | #22 | Exceptional $44,976 |
| Burmese | 100.0 /100 | #23 | Exceptional $44,911 |
| Immigrants | Korea | 100.0 /100 | #24 | Exceptional $44,847 |
| Immigrants | Sweden | 100.0 /100 | #25 | Exceptional $44,774 |
| Immigrants | Belarus | 100.0 /100 | #26 | Exceptional $44,757 |
| Turks | 100.0 /100 | #27 | Exceptional $44,695 |
| Immigrants | Russia | 100.0 /100 | #28 | Exceptional $44,680 |
| Immigrants | Belgium | 100.0 /100 | #29 | Exceptional $44,587 |
| Asians | 100.0 /100 | #30 | Exceptional $44,586 |
| Immigrants | France | 100.0 /100 | #31 | Exceptional $44,541 |
| Immigrants | Northern Europe | 100.0 /100 | #32 | Exceptional $44,366 |