Cree vs Immigrants from Cabo Verde Median Female Earnings
COMPARE
Cree
Immigrants from Cabo Verde
Median Female Earnings
Median Female Earnings Comparison
Cree
Immigrants from Cabo Verde
$37,018
MEDIAN FEMALE EARNINGS
0.4/ 100
METRIC RATING
268th/ 347
METRIC RANK
$38,208
MEDIAN FEMALE EARNINGS
4.3/ 100
METRIC RATING
237th/ 347
METRIC RANK
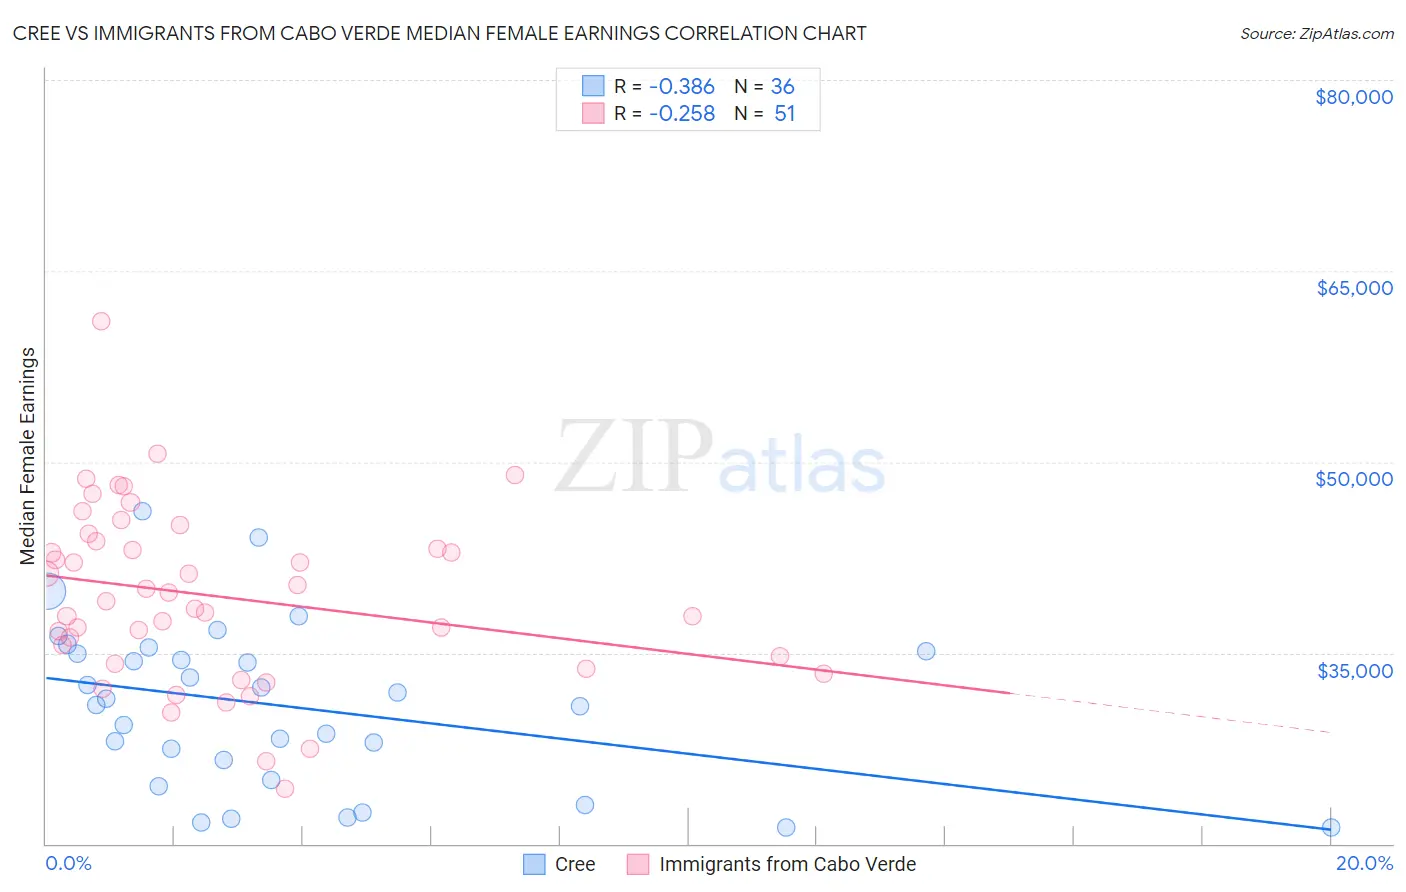
Cree vs Immigrants from Cabo Verde Median Female Earnings Correlation Chart
The statistical analysis conducted on geographies consisting of 76,188,527 people shows a mild negative correlation between the proportion of Cree and median female earnings in the United States with a correlation coefficient (R) of -0.386 and weighted average of $37,018. Similarly, the statistical analysis conducted on geographies consisting of 38,158,316 people shows a weak negative correlation between the proportion of Immigrants from Cabo Verde and median female earnings in the United States with a correlation coefficient (R) of -0.258 and weighted average of $38,208, a difference of 3.2%.
Median Female Earnings Correlation Summary
| Measurement | Cree | Immigrants from Cabo Verde |
| Minimum | $21,250 | $24,340 |
| Maximum | $46,168 | $61,096 |
| Range | $24,918 | $36,756 |
| Mean | $30,765 | $39,427 |
| Median | $31,124 | $39,071 |
| Interquartile 25% (IQ1) | $25,810 | $34,187 |
| Interquartile 75% (IQ3) | $35,030 | $43,779 |
| Interquartile Range (IQR) | $9,221 | $9,592 |
| Standard Deviation (Sample) | $6,370 | $6,953 |
| Standard Deviation (Population) | $6,281 | $6,885 |
Similar Demographics by Median Female Earnings
Demographics Similar to Cree by Median Female Earnings
In terms of median female earnings, the demographic groups most similar to Cree are Nonimmigrants ($37,024, a difference of 0.010%), Immigrants from Venezuela ($37,003, a difference of 0.040%), Dominican ($37,046, a difference of 0.070%), Immigrants from Belize ($37,056, a difference of 0.10%), and Salvadoran ($37,083, a difference of 0.18%).
| Demographics | Rating | Rank | Median Female Earnings |
| Malaysians | 0.7 /100 | #261 | Tragic $37,298 |
| Venezuelans | 0.7 /100 | #262 | Tragic $37,282 |
| German Russians | 0.5 /100 | #263 | Tragic $37,105 |
| Salvadorans | 0.4 /100 | #264 | Tragic $37,083 |
| Immigrants | Belize | 0.4 /100 | #265 | Tragic $37,056 |
| Dominicans | 0.4 /100 | #266 | Tragic $37,046 |
| Immigrants | Nonimmigrants | 0.4 /100 | #267 | Tragic $37,024 |
| Cree | 0.4 /100 | #268 | Tragic $37,018 |
| Immigrants | Venezuela | 0.4 /100 | #269 | Tragic $37,003 |
| French American Indians | 0.3 /100 | #270 | Tragic $36,920 |
| Nicaraguans | 0.3 /100 | #271 | Tragic $36,904 |
| Immigrants | Dominican Republic | 0.3 /100 | #272 | Tragic $36,857 |
| Immigrants | Laos | 0.3 /100 | #273 | Tragic $36,841 |
| Immigrants | El Salvador | 0.2 /100 | #274 | Tragic $36,673 |
| Africans | 0.1 /100 | #275 | Tragic $36,530 |
Demographics Similar to Immigrants from Cabo Verde by Median Female Earnings
In terms of median female earnings, the demographic groups most similar to Immigrants from Cabo Verde are Sudanese ($38,215, a difference of 0.020%), Liberian ($38,215, a difference of 0.020%), Alaska Native ($38,202, a difference of 0.020%), English ($38,196, a difference of 0.030%), and Finnish ($38,173, a difference of 0.090%).
| Demographics | Rating | Rank | Median Female Earnings |
| Basques | 5.7 /100 | #230 | Tragic $38,352 |
| Somalis | 5.5 /100 | #231 | Tragic $38,333 |
| Scandinavians | 5.2 /100 | #232 | Tragic $38,306 |
| Tongans | 5.1 /100 | #233 | Tragic $38,288 |
| Celtics | 5.0 /100 | #234 | Tragic $38,283 |
| Sudanese | 4.4 /100 | #235 | Tragic $38,215 |
| Liberians | 4.4 /100 | #236 | Tragic $38,215 |
| Immigrants | Cabo Verde | 4.3 /100 | #237 | Tragic $38,208 |
| Alaska Natives | 4.3 /100 | #238 | Tragic $38,202 |
| English | 4.2 /100 | #239 | Tragic $38,196 |
| Finns | 4.0 /100 | #240 | Tragic $38,173 |
| Spanish | 3.5 /100 | #241 | Tragic $38,098 |
| Immigrants | Burma/Myanmar | 3.0 /100 | #242 | Tragic $38,028 |
| Germans | 2.8 /100 | #243 | Tragic $37,986 |
| Immigrants | Liberia | 2.7 /100 | #244 | Tragic $37,970 |