Cree vs Sri Lankan Median Female Earnings
COMPARE
Cree
Sri Lankan
Median Female Earnings
Median Female Earnings Comparison
Cree
Sri Lankans
$37,018
MEDIAN FEMALE EARNINGS
0.4/ 100
METRIC RATING
268th/ 347
METRIC RANK
$40,496
MEDIAN FEMALE EARNINGS
84.0/ 100
METRIC RATING
142nd/ 347
METRIC RANK
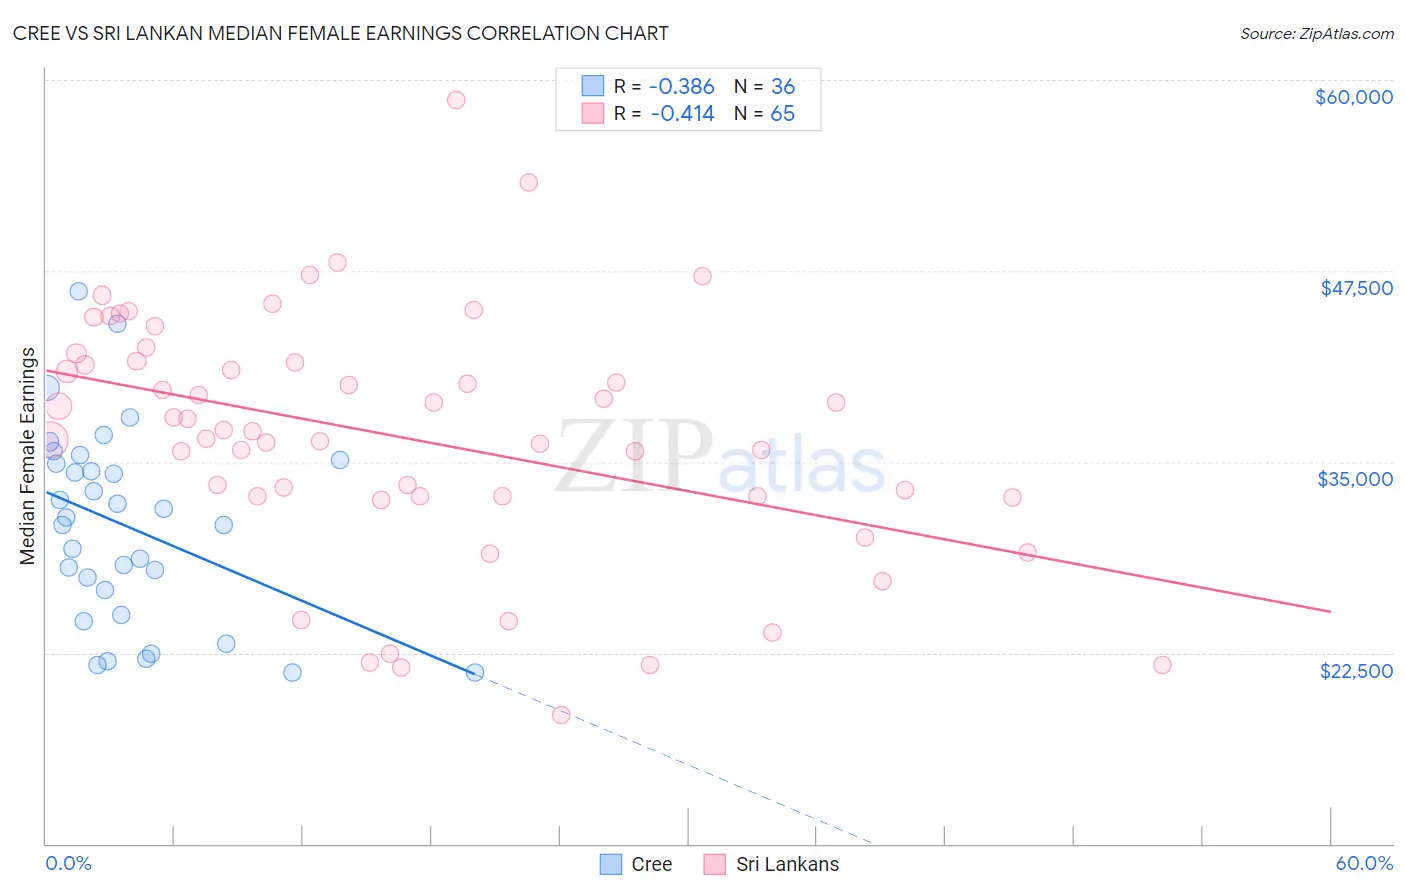
Cree vs Sri Lankan Median Female Earnings Correlation Chart
The statistical analysis conducted on geographies consisting of 76,188,527 people shows a mild negative correlation between the proportion of Cree and median female earnings in the United States with a correlation coefficient (R) of -0.386 and weighted average of $37,018. Similarly, the statistical analysis conducted on geographies consisting of 440,466,993 people shows a moderate negative correlation between the proportion of Sri Lankans and median female earnings in the United States with a correlation coefficient (R) of -0.414 and weighted average of $40,496, a difference of 9.4%.
Median Female Earnings Correlation Summary
| Measurement | Cree | Sri Lankan |
| Minimum | $21,250 | $18,441 |
| Maximum | $46,168 | $58,654 |
| Range | $24,918 | $40,213 |
| Mean | $30,765 | $36,602 |
| Median | $31,124 | $36,994 |
| Interquartile 25% (IQ1) | $25,810 | $32,729 |
| Interquartile 75% (IQ3) | $35,030 | $41,553 |
| Interquartile Range (IQR) | $9,221 | $8,824 |
| Standard Deviation (Sample) | $6,370 | $8,074 |
| Standard Deviation (Population) | $6,281 | $8,012 |
Similar Demographics by Median Female Earnings
Demographics Similar to Cree by Median Female Earnings
In terms of median female earnings, the demographic groups most similar to Cree are Nonimmigrants ($37,024, a difference of 0.010%), Immigrants from Venezuela ($37,003, a difference of 0.040%), Dominican ($37,046, a difference of 0.070%), Immigrants from Belize ($37,056, a difference of 0.10%), and Salvadoran ($37,083, a difference of 0.18%).
| Demographics | Rating | Rank | Median Female Earnings |
| Malaysians | 0.7 /100 | #261 | Tragic $37,298 |
| Venezuelans | 0.7 /100 | #262 | Tragic $37,282 |
| German Russians | 0.5 /100 | #263 | Tragic $37,105 |
| Salvadorans | 0.4 /100 | #264 | Tragic $37,083 |
| Immigrants | Belize | 0.4 /100 | #265 | Tragic $37,056 |
| Dominicans | 0.4 /100 | #266 | Tragic $37,046 |
| Immigrants | Nonimmigrants | 0.4 /100 | #267 | Tragic $37,024 |
| Cree | 0.4 /100 | #268 | Tragic $37,018 |
| Immigrants | Venezuela | 0.4 /100 | #269 | Tragic $37,003 |
| French American Indians | 0.3 /100 | #270 | Tragic $36,920 |
| Nicaraguans | 0.3 /100 | #271 | Tragic $36,904 |
| Immigrants | Dominican Republic | 0.3 /100 | #272 | Tragic $36,857 |
| Immigrants | Laos | 0.3 /100 | #273 | Tragic $36,841 |
| Immigrants | El Salvador | 0.2 /100 | #274 | Tragic $36,673 |
| Africans | 0.1 /100 | #275 | Tragic $36,530 |
Demographics Similar to Sri Lankans by Median Female Earnings
In terms of median female earnings, the demographic groups most similar to Sri Lankans are Immigrants from Syria ($40,499, a difference of 0.010%), Northern European ($40,491, a difference of 0.010%), Immigrants from North Macedonia ($40,488, a difference of 0.020%), Brazilian ($40,483, a difference of 0.030%), and Serbian ($40,539, a difference of 0.10%).
| Demographics | Rating | Rank | Median Female Earnings |
| Immigrants | Nepal | 89.0 /100 | #135 | Excellent $40,704 |
| Immigrants | Eastern Africa | 87.7 /100 | #136 | Excellent $40,644 |
| Pakistanis | 86.6 /100 | #137 | Excellent $40,596 |
| Taiwanese | 86.1 /100 | #138 | Excellent $40,576 |
| Immigrants | South Eastern Asia | 85.7 /100 | #139 | Excellent $40,558 |
| Serbians | 85.2 /100 | #140 | Excellent $40,539 |
| Immigrants | Syria | 84.1 /100 | #141 | Excellent $40,499 |
| Sri Lankans | 84.0 /100 | #142 | Excellent $40,496 |
| Northern Europeans | 83.9 /100 | #143 | Excellent $40,491 |
| Immigrants | North Macedonia | 83.8 /100 | #144 | Excellent $40,488 |
| Brazilians | 83.6 /100 | #145 | Excellent $40,483 |
| Ghanaians | 82.1 /100 | #146 | Excellent $40,429 |
| Vietnamese | 80.4 /100 | #147 | Excellent $40,377 |
| Poles | 80.2 /100 | #148 | Excellent $40,371 |
| Immigrants | Cameroon | 79.7 /100 | #149 | Good $40,354 |