Cree vs Comanche Median Female Earnings
COMPARE
Cree
Comanche
Median Female Earnings
Median Female Earnings Comparison
Cree
Comanche
$37,018
MEDIAN FEMALE EARNINGS
0.4/ 100
METRIC RATING
268th/ 347
METRIC RANK
$35,661
MEDIAN FEMALE EARNINGS
0.0/ 100
METRIC RATING
295th/ 347
METRIC RANK
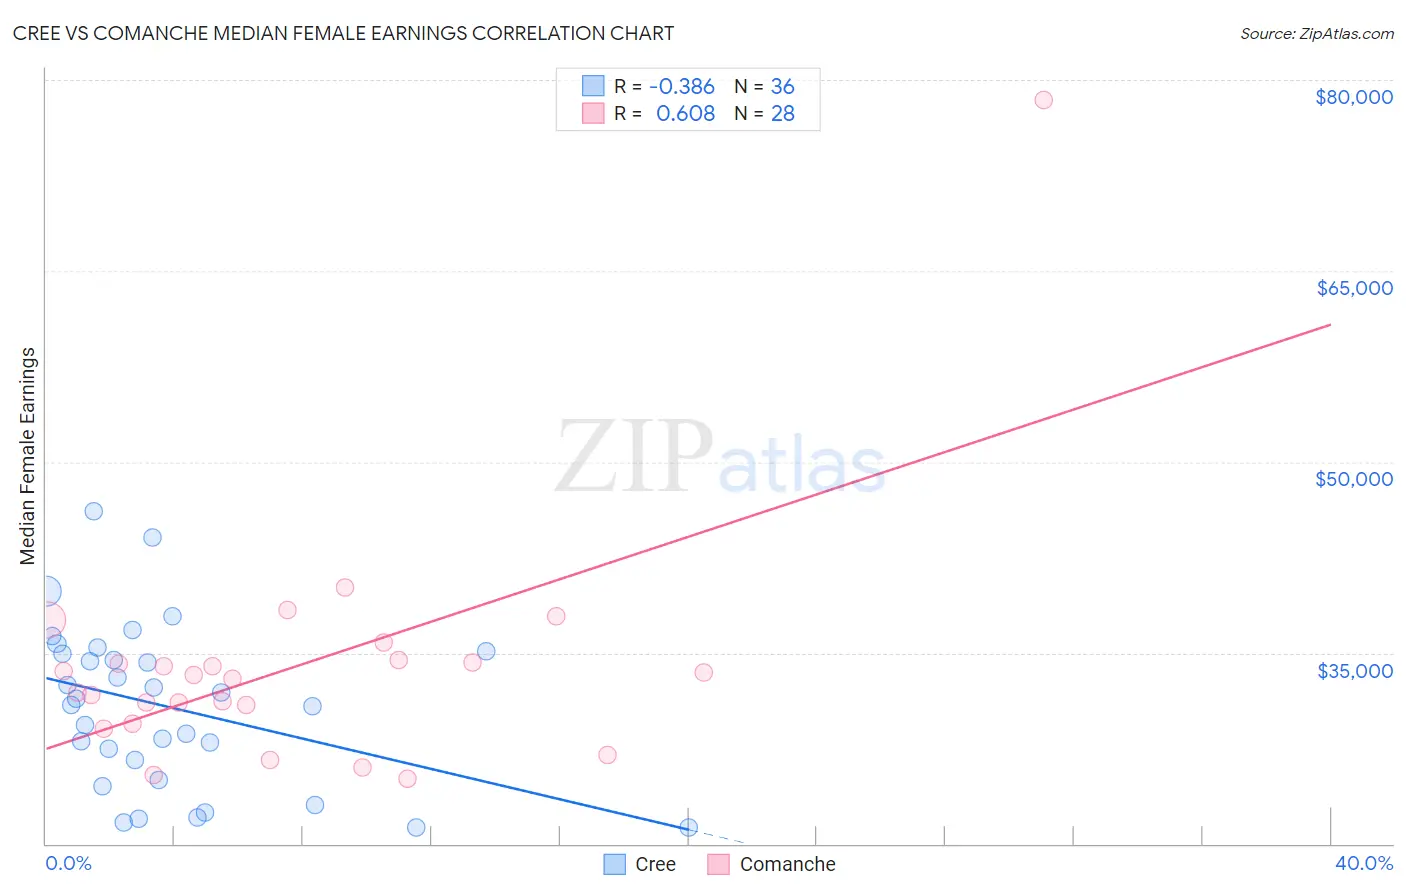
Cree vs Comanche Median Female Earnings Correlation Chart
The statistical analysis conducted on geographies consisting of 76,188,527 people shows a mild negative correlation between the proportion of Cree and median female earnings in the United States with a correlation coefficient (R) of -0.386 and weighted average of $37,018. Similarly, the statistical analysis conducted on geographies consisting of 109,756,357 people shows a significant positive correlation between the proportion of Comanche and median female earnings in the United States with a correlation coefficient (R) of 0.608 and weighted average of $35,661, a difference of 3.8%.
Median Female Earnings Correlation Summary
| Measurement | Cree | Comanche |
| Minimum | $21,250 | $25,100 |
| Maximum | $46,168 | $78,452 |
| Range | $24,918 | $53,352 |
| Mean | $30,765 | $33,877 |
| Median | $31,124 | $33,076 |
| Interquartile 25% (IQ1) | $25,810 | $30,131 |
| Interquartile 75% (IQ3) | $35,030 | $34,372 |
| Interquartile Range (IQR) | $9,221 | $4,241 |
| Standard Deviation (Sample) | $6,370 | $9,585 |
| Standard Deviation (Population) | $6,281 | $9,413 |
Similar Demographics by Median Female Earnings
Demographics Similar to Cree by Median Female Earnings
In terms of median female earnings, the demographic groups most similar to Cree are Nonimmigrants ($37,024, a difference of 0.010%), Immigrants from Venezuela ($37,003, a difference of 0.040%), Dominican ($37,046, a difference of 0.070%), Immigrants from Belize ($37,056, a difference of 0.10%), and Salvadoran ($37,083, a difference of 0.18%).
| Demographics | Rating | Rank | Median Female Earnings |
| Malaysians | 0.7 /100 | #261 | Tragic $37,298 |
| Venezuelans | 0.7 /100 | #262 | Tragic $37,282 |
| German Russians | 0.5 /100 | #263 | Tragic $37,105 |
| Salvadorans | 0.4 /100 | #264 | Tragic $37,083 |
| Immigrants | Belize | 0.4 /100 | #265 | Tragic $37,056 |
| Dominicans | 0.4 /100 | #266 | Tragic $37,046 |
| Immigrants | Nonimmigrants | 0.4 /100 | #267 | Tragic $37,024 |
| Cree | 0.4 /100 | #268 | Tragic $37,018 |
| Immigrants | Venezuela | 0.4 /100 | #269 | Tragic $37,003 |
| French American Indians | 0.3 /100 | #270 | Tragic $36,920 |
| Nicaraguans | 0.3 /100 | #271 | Tragic $36,904 |
| Immigrants | Dominican Republic | 0.3 /100 | #272 | Tragic $36,857 |
| Immigrants | Laos | 0.3 /100 | #273 | Tragic $36,841 |
| Immigrants | El Salvador | 0.2 /100 | #274 | Tragic $36,673 |
| Africans | 0.1 /100 | #275 | Tragic $36,530 |
Demographics Similar to Comanche by Median Female Earnings
In terms of median female earnings, the demographic groups most similar to Comanche are Cheyenne ($35,673, a difference of 0.030%), Guatemalan ($35,695, a difference of 0.090%), Mexican American Indian ($35,629, a difference of 0.090%), American ($35,777, a difference of 0.32%), and Hmong ($35,498, a difference of 0.46%).
| Demographics | Rating | Rank | Median Female Earnings |
| Immigrants | Zaire | 0.0 /100 | #288 | Tragic $36,017 |
| Bangladeshis | 0.0 /100 | #289 | Tragic $35,960 |
| Central American Indians | 0.0 /100 | #290 | Tragic $35,930 |
| Blackfeet | 0.0 /100 | #291 | Tragic $35,864 |
| Americans | 0.0 /100 | #292 | Tragic $35,777 |
| Guatemalans | 0.0 /100 | #293 | Tragic $35,695 |
| Cheyenne | 0.0 /100 | #294 | Tragic $35,673 |
| Comanche | 0.0 /100 | #295 | Tragic $35,661 |
| Mexican American Indians | 0.0 /100 | #296 | Tragic $35,629 |
| Hmong | 0.0 /100 | #297 | Tragic $35,498 |
| Immigrants | Micronesia | 0.0 /100 | #298 | Tragic $35,477 |
| Immigrants | Guatemala | 0.0 /100 | #299 | Tragic $35,444 |
| Yuman | 0.0 /100 | #300 | Tragic $35,377 |
| Pima | 0.0 /100 | #301 | Tragic $35,326 |
| Blacks/African Americans | 0.0 /100 | #302 | Tragic $35,315 |