Canadian vs Hawaiian Wage/Income Gap
COMPARE
Canadian
Hawaiian
Wage/Income Gap
Wage/Income Gap Comparison
Canadians
Hawaiians
28.1%
WAGE/INCOME GAP
0.3/ 100
METRIC RATING
289th/ 347
METRIC RANK
24.9%
WAGE/INCOME GAP
89.3/ 100
METRIC RATING
141st/ 347
METRIC RANK
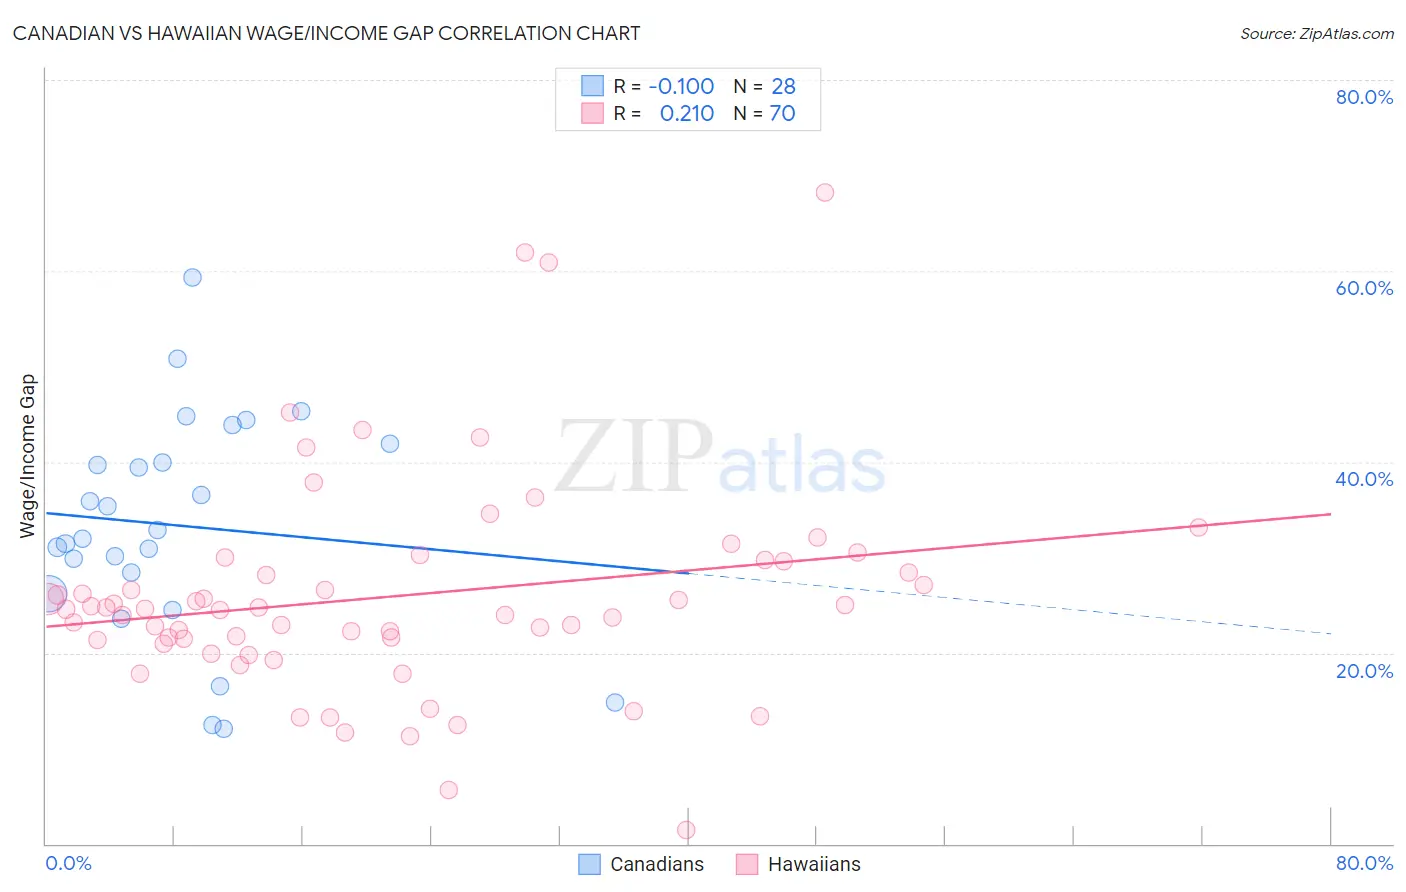
Canadian vs Hawaiian Wage/Income Gap Correlation Chart
The statistical analysis conducted on geographies consisting of 437,073,113 people shows a slight negative correlation between the proportion of Canadians and wage/income gap percentage in the United States with a correlation coefficient (R) of -0.100 and weighted average of 28.1%. Similarly, the statistical analysis conducted on geographies consisting of 327,384,516 people shows a weak positive correlation between the proportion of Hawaiians and wage/income gap percentage in the United States with a correlation coefficient (R) of 0.210 and weighted average of 24.9%, a difference of 13.2%.
Wage/Income Gap Correlation Summary
| Measurement | Canadian | Hawaiian |
| Minimum | 12.0% | 1.4% |
| Maximum | 59.3% | 68.2% |
| Range | 47.3% | 66.8% |
| Mean | 33.3% | 25.9% |
| Median | 32.4% | 24.6% |
| Interquartile 25% (IQ1) | 27.3% | 21.4% |
| Interquartile 75% (IQ3) | 40.9% | 29.6% |
| Interquartile Range (IQR) | 13.6% | 8.2% |
| Standard Deviation (Sample) | 11.4% | 11.4% |
| Standard Deviation (Population) | 11.2% | 11.3% |
Similar Demographics by Wage/Income Gap
Demographics Similar to Canadians by Wage/Income Gap
In terms of wage/income gap, the demographic groups most similar to Canadians are Choctaw (28.1%, a difference of 0.030%), Okinawan (28.1%, a difference of 0.070%), Australian (28.2%, a difference of 0.090%), Immigrants from Austria (28.1%, a difference of 0.11%), and Italian (28.1%, a difference of 0.14%).
| Demographics | Rating | Rank | Wage/Income Gap |
| South Africans | 0.5 /100 | #282 | Tragic 28.0% |
| French Canadians | 0.4 /100 | #283 | Tragic 28.1% |
| Immigrants | Sweden | 0.4 /100 | #284 | Tragic 28.1% |
| Italians | 0.4 /100 | #285 | Tragic 28.1% |
| Immigrants | Austria | 0.4 /100 | #286 | Tragic 28.1% |
| Okinawans | 0.4 /100 | #287 | Tragic 28.1% |
| Choctaw | 0.4 /100 | #288 | Tragic 28.1% |
| Canadians | 0.3 /100 | #289 | Tragic 28.1% |
| Australians | 0.3 /100 | #290 | Tragic 28.2% |
| Czechoslovakians | 0.3 /100 | #291 | Tragic 28.2% |
| Immigrants | Australia | 0.3 /100 | #292 | Tragic 28.2% |
| Immigrants | Israel | 0.3 /100 | #293 | Tragic 28.2% |
| Greeks | 0.3 /100 | #294 | Tragic 28.2% |
| Slovenes | 0.3 /100 | #295 | Tragic 28.3% |
| Northern Europeans | 0.3 /100 | #296 | Tragic 28.3% |
Demographics Similar to Hawaiians by Wage/Income Gap
In terms of wage/income gap, the demographic groups most similar to Hawaiians are Immigrants from Nepal (24.9%, a difference of 0.010%), Hispanic or Latino (24.9%, a difference of 0.040%), Immigrants from Bosnia and Herzegovina (24.8%, a difference of 0.15%), Afghan (24.9%, a difference of 0.20%), and Immigrants from Uganda (24.9%, a difference of 0.22%).
| Demographics | Rating | Rank | Wage/Income Gap |
| Mexican American Indians | 92.2 /100 | #134 | Exceptional 24.7% |
| South American Indians | 92.0 /100 | #135 | Exceptional 24.7% |
| Armenians | 91.3 /100 | #136 | Exceptional 24.8% |
| Immigrants | South Eastern Asia | 90.9 /100 | #137 | Exceptional 24.8% |
| Immigrants | Bosnia and Herzegovina | 90.1 /100 | #138 | Exceptional 24.8% |
| Hispanics or Latinos | 89.5 /100 | #139 | Excellent 24.9% |
| Immigrants | Nepal | 89.3 /100 | #140 | Excellent 24.9% |
| Hawaiians | 89.3 /100 | #141 | Excellent 24.9% |
| Afghans | 88.1 /100 | #142 | Excellent 24.9% |
| Immigrants | Uganda | 88.0 /100 | #143 | Excellent 24.9% |
| Chippewa | 86.9 /100 | #144 | Excellent 25.0% |
| Comanche | 85.2 /100 | #145 | Excellent 25.0% |
| South Americans | 85.2 /100 | #146 | Excellent 25.0% |
| Malaysians | 84.9 /100 | #147 | Excellent 25.0% |
| Iroquois | 83.9 /100 | #148 | Excellent 25.1% |