Swiss vs Hawaiian Wage/Income Gap
COMPARE
Swiss
Hawaiian
Wage/Income Gap
Wage/Income Gap Comparison
Swiss
Hawaiians
30.0%
WAGE/INCOME GAP
0.0/ 100
METRIC RATING
340th/ 347
METRIC RANK
24.9%
WAGE/INCOME GAP
89.3/ 100
METRIC RATING
141st/ 347
METRIC RANK
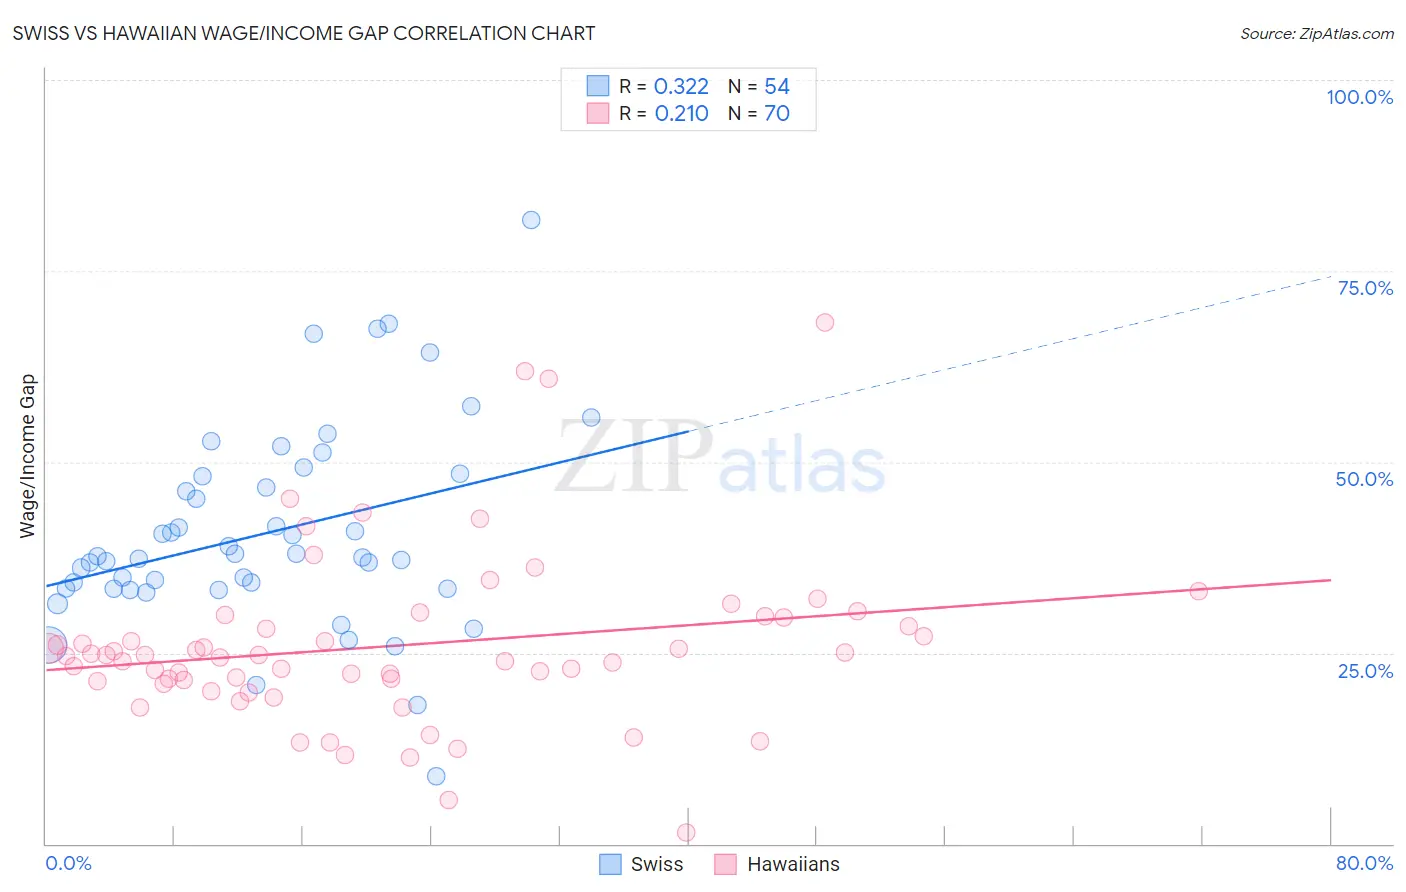
Swiss vs Hawaiian Wage/Income Gap Correlation Chart
The statistical analysis conducted on geographies consisting of 464,189,171 people shows a mild positive correlation between the proportion of Swiss and wage/income gap percentage in the United States with a correlation coefficient (R) of 0.322 and weighted average of 30.0%. Similarly, the statistical analysis conducted on geographies consisting of 327,384,516 people shows a weak positive correlation between the proportion of Hawaiians and wage/income gap percentage in the United States with a correlation coefficient (R) of 0.210 and weighted average of 24.9%, a difference of 20.4%.
Wage/Income Gap Correlation Summary
| Measurement | Swiss | Hawaiian |
| Minimum | 8.8% | 1.4% |
| Maximum | 81.7% | 68.2% |
| Range | 72.9% | 66.8% |
| Mean | 40.7% | 25.9% |
| Median | 37.6% | 24.6% |
| Interquartile 25% (IQ1) | 33.4% | 21.4% |
| Interquartile 75% (IQ3) | 48.0% | 29.6% |
| Interquartile Range (IQR) | 14.6% | 8.2% |
| Standard Deviation (Sample) | 13.2% | 11.4% |
| Standard Deviation (Population) | 13.1% | 11.3% |
Similar Demographics by Wage/Income Gap
Demographics Similar to Swiss by Wage/Income Gap
In terms of wage/income gap, the demographic groups most similar to Swiss are Iranian (29.7%, a difference of 0.83%), Filipino (29.7%, a difference of 0.89%), Dutch (29.6%, a difference of 1.1%), Thai (30.5%, a difference of 1.7%), and English (29.5%, a difference of 1.7%).
| Demographics | Rating | Rank | Wage/Income Gap |
| Europeans | 0.0 /100 | #333 | Tragic 29.4% |
| Swedes | 0.0 /100 | #334 | Tragic 29.4% |
| Immigrants | Taiwan | 0.0 /100 | #335 | Tragic 29.5% |
| English | 0.0 /100 | #336 | Tragic 29.5% |
| Dutch | 0.0 /100 | #337 | Tragic 29.6% |
| Filipinos | 0.0 /100 | #338 | Tragic 29.7% |
| Iranians | 0.0 /100 | #339 | Tragic 29.7% |
| Swiss | 0.0 /100 | #340 | Tragic 30.0% |
| Thais | 0.0 /100 | #341 | Tragic 30.5% |
| Pennsylvania Germans | 0.0 /100 | #342 | Tragic 30.7% |
| Danes | 0.0 /100 | #343 | Tragic 31.0% |
| Assyrians/Chaldeans/Syriacs | 0.0 /100 | #344 | Tragic 31.0% |
| Immigrants | India | 0.0 /100 | #345 | Tragic 31.5% |
| Cajuns | 0.0 /100 | #346 | Tragic 33.9% |
| Houma | 0.0 /100 | #347 | Tragic 38.7% |
Demographics Similar to Hawaiians by Wage/Income Gap
In terms of wage/income gap, the demographic groups most similar to Hawaiians are Immigrants from Nepal (24.9%, a difference of 0.010%), Hispanic or Latino (24.9%, a difference of 0.040%), Immigrants from Bosnia and Herzegovina (24.8%, a difference of 0.15%), Afghan (24.9%, a difference of 0.20%), and Immigrants from Uganda (24.9%, a difference of 0.22%).
| Demographics | Rating | Rank | Wage/Income Gap |
| Mexican American Indians | 92.2 /100 | #134 | Exceptional 24.7% |
| South American Indians | 92.0 /100 | #135 | Exceptional 24.7% |
| Armenians | 91.3 /100 | #136 | Exceptional 24.8% |
| Immigrants | South Eastern Asia | 90.9 /100 | #137 | Exceptional 24.8% |
| Immigrants | Bosnia and Herzegovina | 90.1 /100 | #138 | Exceptional 24.8% |
| Hispanics or Latinos | 89.5 /100 | #139 | Excellent 24.9% |
| Immigrants | Nepal | 89.3 /100 | #140 | Excellent 24.9% |
| Hawaiians | 89.3 /100 | #141 | Excellent 24.9% |
| Afghans | 88.1 /100 | #142 | Excellent 24.9% |
| Immigrants | Uganda | 88.0 /100 | #143 | Excellent 24.9% |
| Chippewa | 86.9 /100 | #144 | Excellent 25.0% |
| Comanche | 85.2 /100 | #145 | Excellent 25.0% |
| South Americans | 85.2 /100 | #146 | Excellent 25.0% |
| Malaysians | 84.9 /100 | #147 | Excellent 25.0% |
| Iroquois | 83.9 /100 | #148 | Excellent 25.1% |