Canadian vs Yugoslavian Wage/Income Gap
COMPARE
Canadian
Yugoslavian
Wage/Income Gap
Wage/Income Gap Comparison
Canadians
Yugoslavians
28.1%
WAGE/INCOME GAP
0.3/ 100
METRIC RATING
289th/ 347
METRIC RANK
26.7%
WAGE/INCOME GAP
9.7/ 100
METRIC RATING
215th/ 347
METRIC RANK
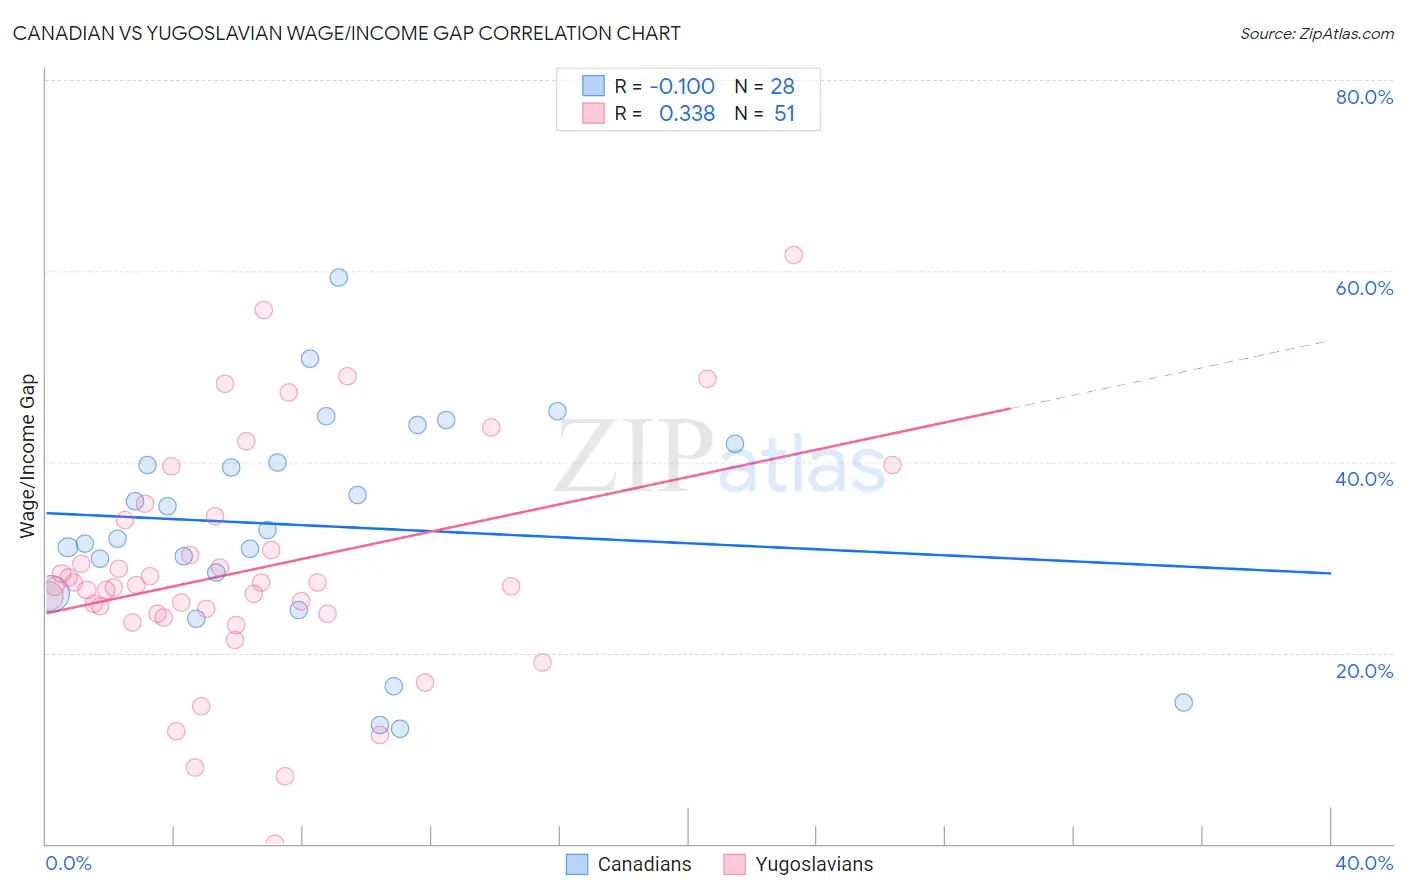
Canadian vs Yugoslavian Wage/Income Gap Correlation Chart
The statistical analysis conducted on geographies consisting of 437,073,113 people shows a slight negative correlation between the proportion of Canadians and wage/income gap percentage in the United States with a correlation coefficient (R) of -0.100 and weighted average of 28.1%. Similarly, the statistical analysis conducted on geographies consisting of 285,593,717 people shows a mild positive correlation between the proportion of Yugoslavians and wage/income gap percentage in the United States with a correlation coefficient (R) of 0.338 and weighted average of 26.7%, a difference of 5.4%.
Wage/Income Gap Correlation Summary
| Measurement | Canadian | Yugoslavian |
| Minimum | 12.0% | 0.038% |
| Maximum | 59.3% | 61.7% |
| Range | 47.3% | 61.6% |
| Mean | 33.3% | 28.6% |
| Median | 32.4% | 27.0% |
| Interquartile 25% (IQ1) | 27.3% | 24.1% |
| Interquartile 75% (IQ3) | 40.9% | 33.9% |
| Interquartile Range (IQR) | 13.6% | 9.8% |
| Standard Deviation (Sample) | 11.4% | 12.0% |
| Standard Deviation (Population) | 11.2% | 11.8% |
Similar Demographics by Wage/Income Gap
Demographics Similar to Canadians by Wage/Income Gap
In terms of wage/income gap, the demographic groups most similar to Canadians are Choctaw (28.1%, a difference of 0.030%), Okinawan (28.1%, a difference of 0.070%), Australian (28.2%, a difference of 0.090%), Immigrants from Austria (28.1%, a difference of 0.11%), and Italian (28.1%, a difference of 0.14%).
| Demographics | Rating | Rank | Wage/Income Gap |
| South Africans | 0.5 /100 | #282 | Tragic 28.0% |
| French Canadians | 0.4 /100 | #283 | Tragic 28.1% |
| Immigrants | Sweden | 0.4 /100 | #284 | Tragic 28.1% |
| Italians | 0.4 /100 | #285 | Tragic 28.1% |
| Immigrants | Austria | 0.4 /100 | #286 | Tragic 28.1% |
| Okinawans | 0.4 /100 | #287 | Tragic 28.1% |
| Choctaw | 0.4 /100 | #288 | Tragic 28.1% |
| Canadians | 0.3 /100 | #289 | Tragic 28.1% |
| Australians | 0.3 /100 | #290 | Tragic 28.2% |
| Czechoslovakians | 0.3 /100 | #291 | Tragic 28.2% |
| Immigrants | Australia | 0.3 /100 | #292 | Tragic 28.2% |
| Immigrants | Israel | 0.3 /100 | #293 | Tragic 28.2% |
| Greeks | 0.3 /100 | #294 | Tragic 28.2% |
| Slovenes | 0.3 /100 | #295 | Tragic 28.3% |
| Northern Europeans | 0.3 /100 | #296 | Tragic 28.3% |
Demographics Similar to Yugoslavians by Wage/Income Gap
In terms of wage/income gap, the demographic groups most similar to Yugoslavians are Immigrants from Portugal (26.7%, a difference of 0.040%), Immigrants from China (26.7%, a difference of 0.090%), Immigrants from Iraq (26.7%, a difference of 0.10%), Brazilian (26.7%, a difference of 0.10%), and Immigrants from Saudi Arabia (26.7%, a difference of 0.12%).
| Demographics | Rating | Rank | Wage/Income Gap |
| Egyptians | 12.7 /100 | #208 | Poor 26.6% |
| Immigrants | Kuwait | 12.6 /100 | #209 | Poor 26.6% |
| Arabs | 12.3 /100 | #210 | Poor 26.6% |
| Mongolians | 11.4 /100 | #211 | Poor 26.6% |
| Iraqis | 11.2 /100 | #212 | Poor 26.6% |
| Immigrants | Iraq | 10.3 /100 | #213 | Poor 26.7% |
| Immigrants | China | 10.3 /100 | #214 | Poor 26.7% |
| Yugoslavians | 9.7 /100 | #215 | Tragic 26.7% |
| Immigrants | Portugal | 9.5 /100 | #216 | Tragic 26.7% |
| Brazilians | 9.2 /100 | #217 | Tragic 26.7% |
| Immigrants | Saudi Arabia | 9.1 /100 | #218 | Tragic 26.7% |
| Immigrants | Poland | 8.9 /100 | #219 | Tragic 26.7% |
| Immigrants | Latvia | 8.9 /100 | #220 | Tragic 26.7% |
| Immigrants | Spain | 8.5 /100 | #221 | Tragic 26.8% |
| Bolivians | 8.3 /100 | #222 | Tragic 26.8% |