Canadian vs Hawaiian Unemployment
COMPARE
Canadian
Hawaiian
Unemployment
Unemployment Comparison
Canadians
Hawaiians
5.0%
UNEMPLOYMENT
97.7/ 100
METRIC RATING
79th/ 347
METRIC RANK
5.5%
UNEMPLOYMENT
5.4/ 100
METRIC RATING
229th/ 347
METRIC RANK
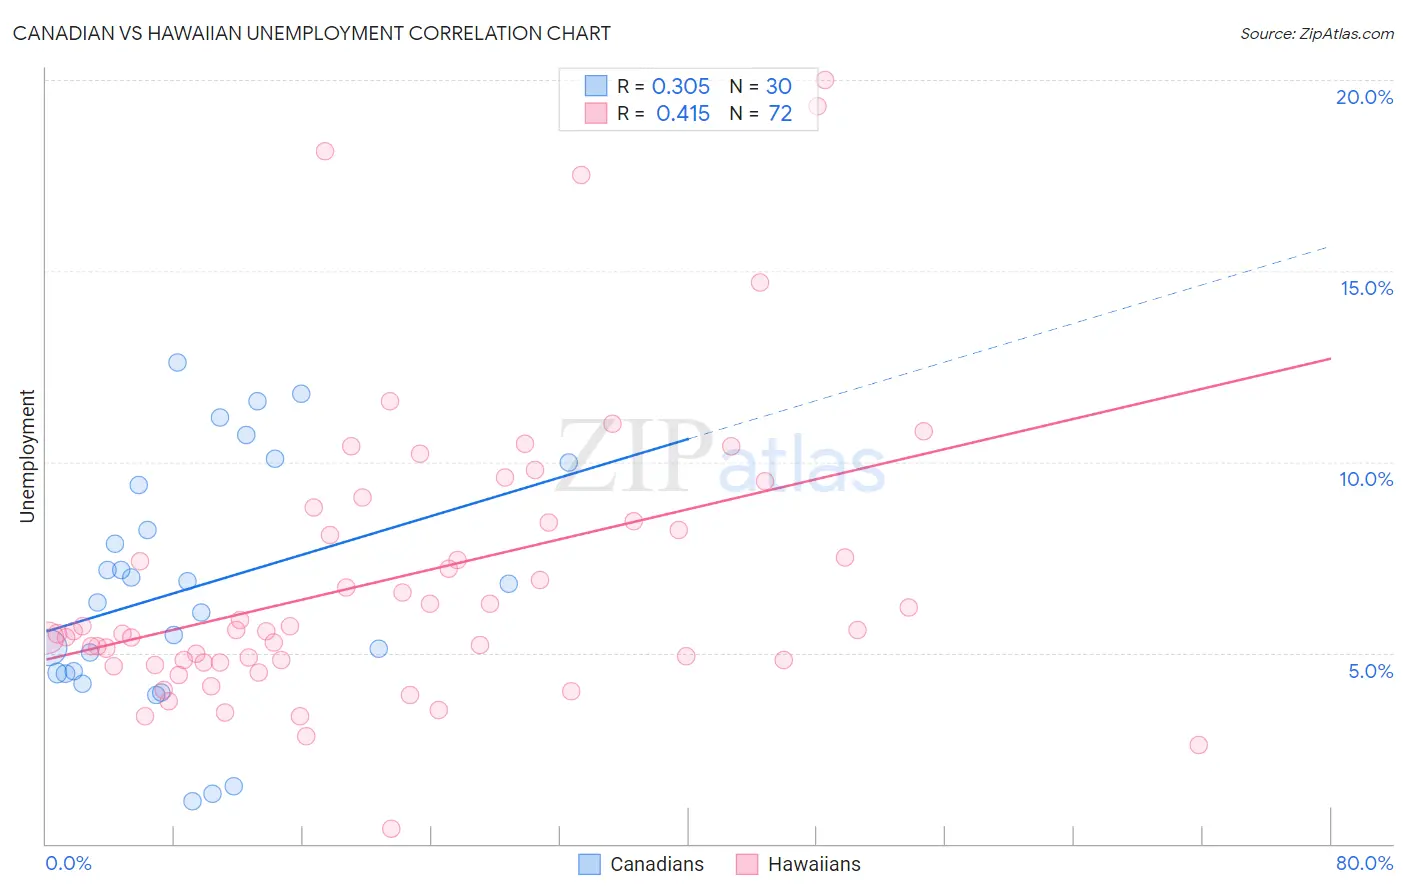
Canadian vs Hawaiian Unemployment Correlation Chart
The statistical analysis conducted on geographies consisting of 436,779,128 people shows a mild positive correlation between the proportion of Canadians and unemployment in the United States with a correlation coefficient (R) of 0.305 and weighted average of 5.0%. Similarly, the statistical analysis conducted on geographies consisting of 327,226,507 people shows a moderate positive correlation between the proportion of Hawaiians and unemployment in the United States with a correlation coefficient (R) of 0.415 and weighted average of 5.5%, a difference of 10.8%.
Unemployment Correlation Summary
| Measurement | Canadian | Hawaiian |
| Minimum | 1.1% | 0.40% |
| Maximum | 12.6% | 20.0% |
| Range | 11.5% | 19.6% |
| Mean | 6.7% | 7.0% |
| Median | 6.6% | 5.6% |
| Interquartile 25% (IQ1) | 4.5% | 4.8% |
| Interquartile 75% (IQ3) | 9.4% | 8.4% |
| Interquartile Range (IQR) | 4.9% | 3.6% |
| Standard Deviation (Sample) | 3.2% | 3.8% |
| Standard Deviation (Population) | 3.1% | 3.8% |
Similar Demographics by Unemployment
Demographics Similar to Canadians by Unemployment
In terms of unemployment, the demographic groups most similar to Canadians are Immigrants from Sweden (5.0%, a difference of 0.070%), Basque (5.0%, a difference of 0.080%), Fijian (5.0%, a difference of 0.090%), Hmong (5.0%, a difference of 0.10%), and Okinawan (4.9%, a difference of 0.12%).
| Demographics | Rating | Rank | Unemployment |
| Burmese | 98.3 /100 | #72 | Exceptional 4.9% |
| Paraguayans | 98.3 /100 | #73 | Exceptional 4.9% |
| Immigrants | Northern Europe | 98.2 /100 | #74 | Exceptional 4.9% |
| Turks | 98.0 /100 | #75 | Exceptional 4.9% |
| German Russians | 98.0 /100 | #76 | Exceptional 4.9% |
| Cypriots | 97.9 /100 | #77 | Exceptional 4.9% |
| Okinawans | 97.9 /100 | #78 | Exceptional 4.9% |
| Canadians | 97.7 /100 | #79 | Exceptional 5.0% |
| Immigrants | Sweden | 97.6 /100 | #80 | Exceptional 5.0% |
| Basques | 97.6 /100 | #81 | Exceptional 5.0% |
| Fijians | 97.6 /100 | #82 | Exceptional 5.0% |
| Hmong | 97.6 /100 | #83 | Exceptional 5.0% |
| Russians | 97.4 /100 | #84 | Exceptional 5.0% |
| Immigrants | Australia | 97.0 /100 | #85 | Exceptional 5.0% |
| Hungarians | 96.9 /100 | #86 | Exceptional 5.0% |
Demographics Similar to Hawaiians by Unemployment
In terms of unemployment, the demographic groups most similar to Hawaiians are Ottawa (5.5%, a difference of 0.0%), Immigrants from Africa (5.5%, a difference of 0.13%), Comanche (5.5%, a difference of 0.13%), Immigrants from Syria (5.5%, a difference of 0.18%), and Panamanian (5.5%, a difference of 0.21%).
| Demographics | Rating | Rank | Unemployment |
| Iroquois | 10.3 /100 | #222 | Poor 5.4% |
| Seminole | 9.2 /100 | #223 | Tragic 5.4% |
| Israelis | 8.8 /100 | #224 | Tragic 5.4% |
| South American Indians | 7.8 /100 | #225 | Tragic 5.5% |
| Samoans | 7.1 /100 | #226 | Tragic 5.5% |
| Immigrants | Lebanon | 7.0 /100 | #227 | Tragic 5.5% |
| Guamanians/Chamorros | 6.3 /100 | #228 | Tragic 5.5% |
| Hawaiians | 5.4 /100 | #229 | Tragic 5.5% |
| Ottawa | 5.4 /100 | #230 | Tragic 5.5% |
| Immigrants | Africa | 4.9 /100 | #231 | Tragic 5.5% |
| Comanche | 4.9 /100 | #232 | Tragic 5.5% |
| Immigrants | Syria | 4.8 /100 | #233 | Tragic 5.5% |
| Panamanians | 4.7 /100 | #234 | Tragic 5.5% |
| Immigrants | Panama | 3.4 /100 | #235 | Tragic 5.5% |
| Immigrants | Cambodia | 3.3 /100 | #236 | Tragic 5.5% |