American vs Hawaiian Wage/Income Gap
COMPARE
American
Hawaiian
Wage/Income Gap
Wage/Income Gap Comparison
Americans
Hawaiians
27.8%
WAGE/INCOME GAP
0.7/ 100
METRIC RATING
274th/ 347
METRIC RANK
24.9%
WAGE/INCOME GAP
89.3/ 100
METRIC RATING
141st/ 347
METRIC RANK
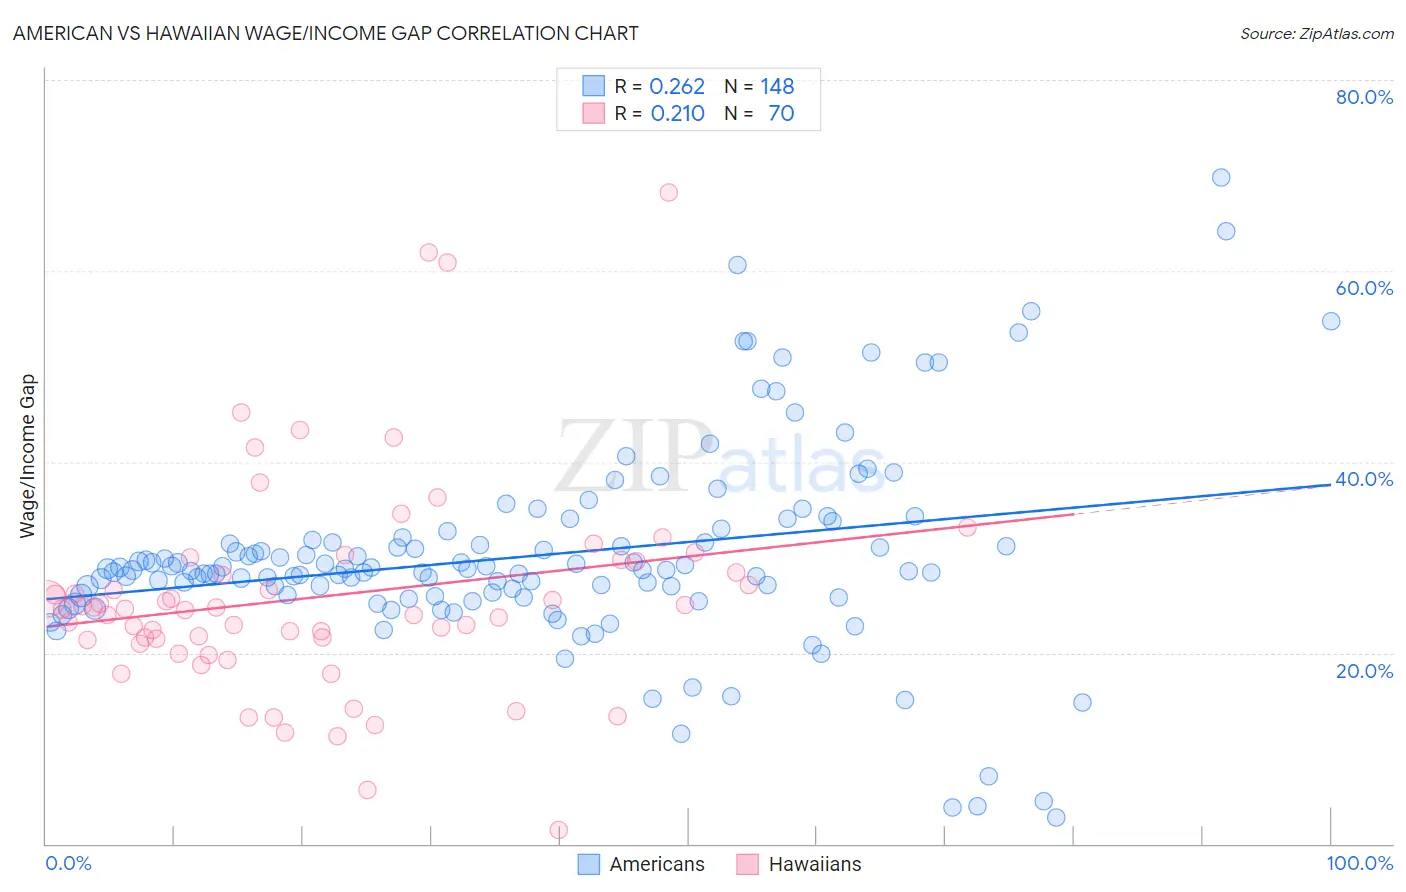
American vs Hawaiian Wage/Income Gap Correlation Chart
The statistical analysis conducted on geographies consisting of 577,977,110 people shows a weak positive correlation between the proportion of Americans and wage/income gap percentage in the United States with a correlation coefficient (R) of 0.262 and weighted average of 27.8%. Similarly, the statistical analysis conducted on geographies consisting of 327,384,516 people shows a weak positive correlation between the proportion of Hawaiians and wage/income gap percentage in the United States with a correlation coefficient (R) of 0.210 and weighted average of 24.9%, a difference of 11.9%.
Wage/Income Gap Correlation Summary
| Measurement | American | Hawaiian |
| Minimum | 2.7% | 1.4% |
| Maximum | 69.8% | 68.2% |
| Range | 67.1% | 66.8% |
| Mean | 30.2% | 25.9% |
| Median | 28.7% | 24.6% |
| Interquartile 25% (IQ1) | 26.0% | 21.4% |
| Interquartile 75% (IQ3) | 31.7% | 29.6% |
| Interquartile Range (IQR) | 5.7% | 8.2% |
| Standard Deviation (Sample) | 10.5% | 11.4% |
| Standard Deviation (Population) | 10.5% | 11.3% |
Similar Demographics by Wage/Income Gap
Demographics Similar to Americans by Wage/Income Gap
In terms of wage/income gap, the demographic groups most similar to Americans are Bulgarian (27.8%, a difference of 0.040%), Immigrants from Japan (27.9%, a difference of 0.080%), Lebanese (27.9%, a difference of 0.11%), Latvian (27.9%, a difference of 0.11%), and Immigrants from Korea (27.8%, a difference of 0.15%).
| Demographics | Rating | Rank | Wage/Income Gap |
| Turks | 1.0 /100 | #267 | Tragic 27.7% |
| New Zealanders | 1.0 /100 | #268 | Tragic 27.7% |
| Potawatomi | 0.9 /100 | #269 | Tragic 27.7% |
| Immigrants | Western Europe | 0.9 /100 | #270 | Tragic 27.8% |
| Ute | 0.8 /100 | #271 | Tragic 27.8% |
| Immigrants | Korea | 0.8 /100 | #272 | Tragic 27.8% |
| Bulgarians | 0.7 /100 | #273 | Tragic 27.8% |
| Americans | 0.7 /100 | #274 | Tragic 27.8% |
| Immigrants | Japan | 0.7 /100 | #275 | Tragic 27.9% |
| Lebanese | 0.7 /100 | #276 | Tragic 27.9% |
| Latvians | 0.7 /100 | #277 | Tragic 27.9% |
| Immigrants | England | 0.6 /100 | #278 | Tragic 27.9% |
| Romanians | 0.5 /100 | #279 | Tragic 28.0% |
| Russians | 0.5 /100 | #280 | Tragic 28.0% |
| Burmese | 0.5 /100 | #281 | Tragic 28.0% |
Demographics Similar to Hawaiians by Wage/Income Gap
In terms of wage/income gap, the demographic groups most similar to Hawaiians are Immigrants from Nepal (24.9%, a difference of 0.010%), Hispanic or Latino (24.9%, a difference of 0.040%), Immigrants from Bosnia and Herzegovina (24.8%, a difference of 0.15%), Afghan (24.9%, a difference of 0.20%), and Immigrants from Uganda (24.9%, a difference of 0.22%).
| Demographics | Rating | Rank | Wage/Income Gap |
| Mexican American Indians | 92.2 /100 | #134 | Exceptional 24.7% |
| South American Indians | 92.0 /100 | #135 | Exceptional 24.7% |
| Armenians | 91.3 /100 | #136 | Exceptional 24.8% |
| Immigrants | South Eastern Asia | 90.9 /100 | #137 | Exceptional 24.8% |
| Immigrants | Bosnia and Herzegovina | 90.1 /100 | #138 | Exceptional 24.8% |
| Hispanics or Latinos | 89.5 /100 | #139 | Excellent 24.9% |
| Immigrants | Nepal | 89.3 /100 | #140 | Excellent 24.9% |
| Hawaiians | 89.3 /100 | #141 | Excellent 24.9% |
| Afghans | 88.1 /100 | #142 | Excellent 24.9% |
| Immigrants | Uganda | 88.0 /100 | #143 | Excellent 24.9% |
| Chippewa | 86.9 /100 | #144 | Excellent 25.0% |
| Comanche | 85.2 /100 | #145 | Excellent 25.0% |
| South Americans | 85.2 /100 | #146 | Excellent 25.0% |
| Malaysians | 84.9 /100 | #147 | Excellent 25.0% |
| Iroquois | 83.9 /100 | #148 | Excellent 25.1% |