Canadian vs Hawaiian Vision Disability
COMPARE
Canadian
Hawaiian
Vision Disability
Vision Disability Comparison
Canadians
Hawaiians
2.2%
VISION DISABILITY
25.8/ 100
METRIC RATING
191st/ 347
METRIC RANK
2.3%
VISION DISABILITY
2.9/ 100
METRIC RATING
227th/ 347
METRIC RANK
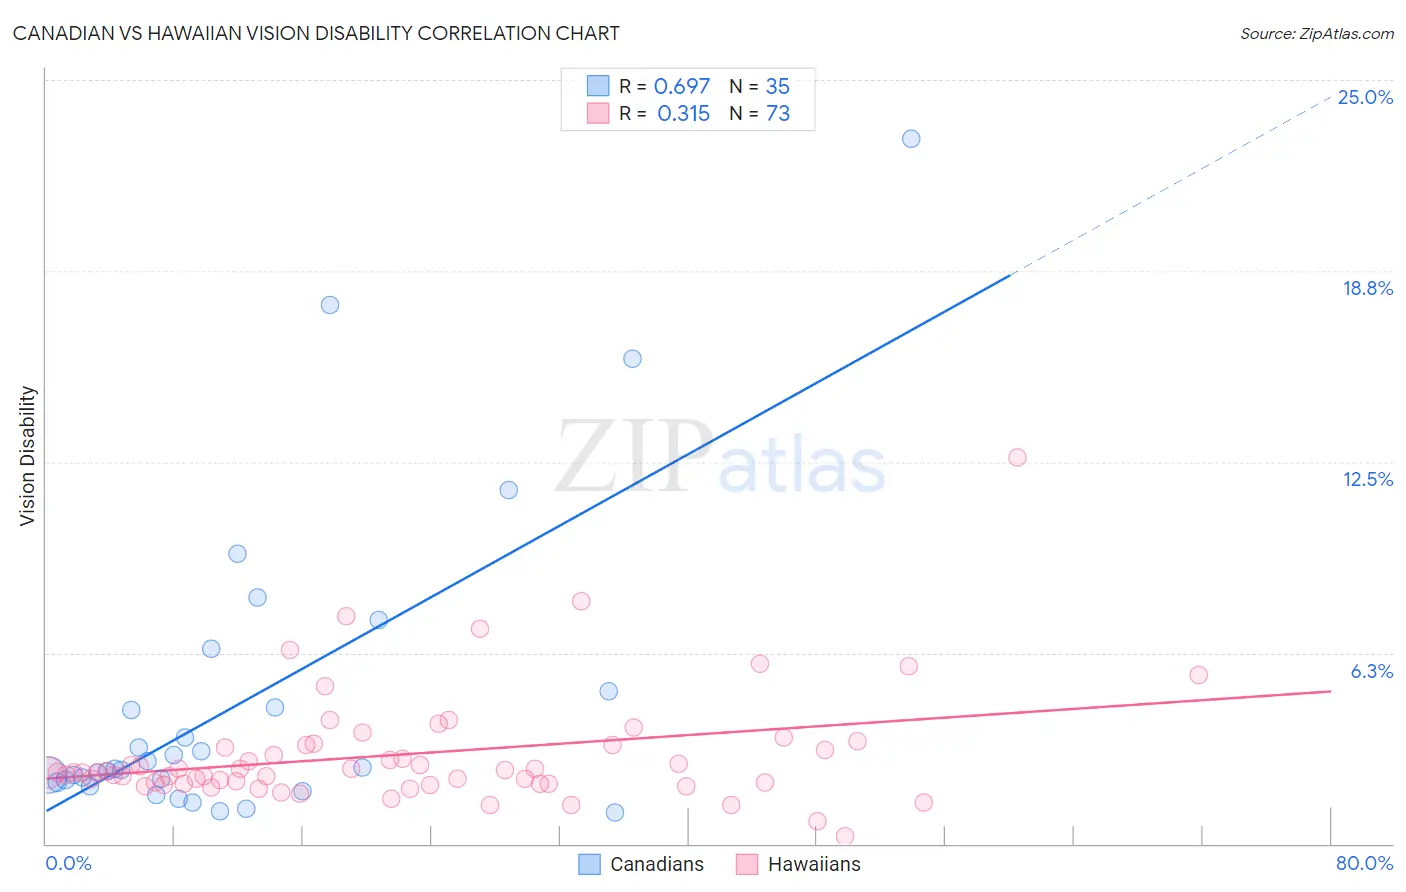
Canadian vs Hawaiian Vision Disability Correlation Chart
The statistical analysis conducted on geographies consisting of 437,069,200 people shows a significant positive correlation between the proportion of Canadians and percentage of population with vision disability in the United States with a correlation coefficient (R) of 0.697 and weighted average of 2.2%. Similarly, the statistical analysis conducted on geographies consisting of 327,342,922 people shows a mild positive correlation between the proportion of Hawaiians and percentage of population with vision disability in the United States with a correlation coefficient (R) of 0.315 and weighted average of 2.3%, a difference of 3.8%.
Vision Disability Correlation Summary
| Measurement | Canadian | Hawaiian |
| Minimum | 1.0% | 0.26% |
| Maximum | 23.1% | 12.7% |
| Range | 22.0% | 12.4% |
| Mean | 4.7% | 2.9% |
| Median | 2.4% | 2.3% |
| Interquartile 25% (IQ1) | 2.0% | 2.0% |
| Interquartile 75% (IQ3) | 5.0% | 3.2% |
| Interquartile Range (IQR) | 3.0% | 1.3% |
| Standard Deviation (Sample) | 5.1% | 1.9% |
| Standard Deviation (Population) | 5.0% | 1.9% |
Similar Demographics by Vision Disability
Demographics Similar to Canadians by Vision Disability
In terms of vision disability, the demographic groups most similar to Canadians are European (2.2%, a difference of 0.010%), Immigrants from Costa Rica (2.2%, a difference of 0.020%), British (2.2%, a difference of 0.060%), Salvadoran (2.2%, a difference of 0.13%), and Immigrants from Barbados (2.2%, a difference of 0.15%).
| Demographics | Rating | Rank | Vision Disability |
| Moroccans | 35.4 /100 | #184 | Fair 2.2% |
| Immigrants | Middle Africa | 33.5 /100 | #185 | Fair 2.2% |
| Native Hawaiians | 33.3 /100 | #186 | Fair 2.2% |
| Immigrants | St. Vincent and the Grenadines | 30.3 /100 | #187 | Fair 2.2% |
| Guyanese | 28.9 /100 | #188 | Fair 2.2% |
| Salvadorans | 27.4 /100 | #189 | Fair 2.2% |
| Immigrants | Costa Rica | 26.1 /100 | #190 | Fair 2.2% |
| Canadians | 25.8 /100 | #191 | Fair 2.2% |
| Europeans | 25.7 /100 | #192 | Fair 2.2% |
| British | 25.1 /100 | #193 | Fair 2.2% |
| Immigrants | Barbados | 24.0 /100 | #194 | Fair 2.2% |
| Immigrants | Immigrants | 23.7 /100 | #195 | Fair 2.2% |
| Immigrants | Grenada | 23.1 /100 | #196 | Fair 2.2% |
| Ghanaians | 21.8 /100 | #197 | Fair 2.2% |
| Czechoslovakians | 21.6 /100 | #198 | Fair 2.2% |
Demographics Similar to Hawaiians by Vision Disability
In terms of vision disability, the demographic groups most similar to Hawaiians are Immigrants from Germany (2.3%, a difference of 0.050%), Hmong (2.3%, a difference of 0.24%), Immigrants from Western Africa (2.3%, a difference of 0.27%), Irish (2.3%, a difference of 0.28%), and Basque (2.3%, a difference of 0.31%).
| Demographics | Rating | Rank | Vision Disability |
| Guamanians/Chamorros | 3.9 /100 | #220 | Tragic 2.3% |
| French Canadians | 3.9 /100 | #221 | Tragic 2.3% |
| Immigrants | Senegal | 3.8 /100 | #222 | Tragic 2.3% |
| Basques | 3.5 /100 | #223 | Tragic 2.3% |
| Irish | 3.4 /100 | #224 | Tragic 2.3% |
| Immigrants | Western Africa | 3.4 /100 | #225 | Tragic 2.3% |
| Immigrants | Germany | 3.0 /100 | #226 | Tragic 2.3% |
| Hawaiians | 2.9 /100 | #227 | Tragic 2.3% |
| Hmong | 2.5 /100 | #228 | Tragic 2.3% |
| Welsh | 2.3 /100 | #229 | Tragic 2.3% |
| Nicaraguans | 2.2 /100 | #230 | Tragic 2.3% |
| Immigrants | Ecuador | 2.0 /100 | #231 | Tragic 2.3% |
| German Russians | 1.8 /100 | #232 | Tragic 2.3% |
| Central Americans | 1.8 /100 | #233 | Tragic 2.3% |
| Scottish | 1.6 /100 | #234 | Tragic 2.3% |