Arapaho vs Chickasaw Wage/Income Gap
COMPARE
Arapaho
Chickasaw
Wage/Income Gap
Wage/Income Gap Comparison
Arapaho
Chickasaw
23.5%
WAGE/INCOME GAP
99.6/ 100
METRIC RATING
91st/ 347
METRIC RANK
27.2%
WAGE/INCOME GAP
3.5/ 100
METRIC RATING
244th/ 347
METRIC RANK
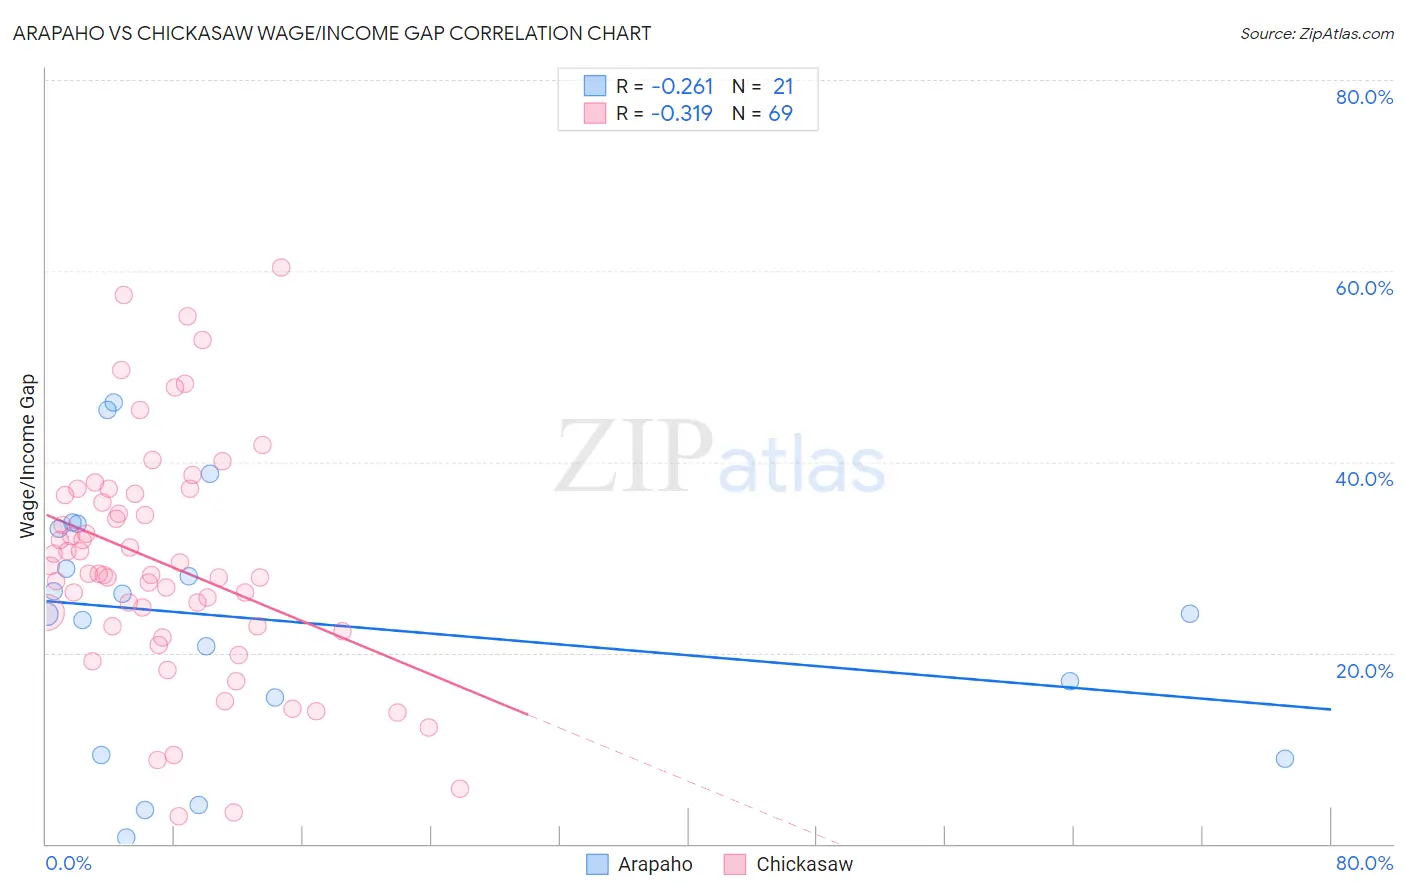
Arapaho vs Chickasaw Wage/Income Gap Correlation Chart
The statistical analysis conducted on geographies consisting of 29,769,339 people shows a weak negative correlation between the proportion of Arapaho and wage/income gap percentage in the United States with a correlation coefficient (R) of -0.261 and weighted average of 23.5%. Similarly, the statistical analysis conducted on geographies consisting of 147,661,645 people shows a mild negative correlation between the proportion of Chickasaw and wage/income gap percentage in the United States with a correlation coefficient (R) of -0.319 and weighted average of 27.2%, a difference of 15.8%.
Wage/Income Gap Correlation Summary
| Measurement | Arapaho | Chickasaw |
| Minimum | 0.71% | 2.8% |
| Maximum | 46.3% | 60.4% |
| Range | 45.6% | 57.6% |
| Mean | 23.4% | 29.3% |
| Median | 24.1% | 28.3% |
| Interquartile 25% (IQ1) | 12.3% | 22.5% |
| Interquartile 75% (IQ3) | 33.3% | 36.6% |
| Interquartile Range (IQR) | 20.9% | 14.2% |
| Standard Deviation (Sample) | 13.1% | 12.2% |
| Standard Deviation (Population) | 12.8% | 12.2% |
Similar Demographics by Wage/Income Gap
Demographics Similar to Arapaho by Wage/Income Gap
In terms of wage/income gap, the demographic groups most similar to Arapaho are Nicaraguan (23.4%, a difference of 0.14%), Marshallese (23.4%, a difference of 0.15%), Immigrants from Honduras (23.5%, a difference of 0.15%), Immigrants from Panama (23.4%, a difference of 0.24%), and Immigrants from Cabo Verde (23.6%, a difference of 0.39%).
| Demographics | Rating | Rank | Wage/Income Gap |
| Cubans | 99.7 /100 | #84 | Exceptional 23.3% |
| Immigrants | Cambodia | 99.7 /100 | #85 | Exceptional 23.3% |
| Cheyenne | 99.7 /100 | #86 | Exceptional 23.3% |
| Yuman | 99.7 /100 | #87 | Exceptional 23.3% |
| Immigrants | Panama | 99.6 /100 | #88 | Exceptional 23.4% |
| Marshallese | 99.6 /100 | #89 | Exceptional 23.4% |
| Nicaraguans | 99.6 /100 | #90 | Exceptional 23.4% |
| Arapaho | 99.6 /100 | #91 | Exceptional 23.5% |
| Immigrants | Honduras | 99.5 /100 | #92 | Exceptional 23.5% |
| Immigrants | Cabo Verde | 99.5 /100 | #93 | Exceptional 23.6% |
| Hondurans | 99.5 /100 | #94 | Exceptional 23.6% |
| Cape Verdeans | 99.4 /100 | #95 | Exceptional 23.6% |
| Kiowa | 99.4 /100 | #96 | Exceptional 23.6% |
| Immigrants | Sudan | 99.4 /100 | #97 | Exceptional 23.6% |
| Immigrants | Latin America | 99.2 /100 | #98 | Exceptional 23.7% |
Demographics Similar to Chickasaw by Wage/Income Gap
In terms of wage/income gap, the demographic groups most similar to Chickasaw are Immigrants from the Azores (27.2%, a difference of 0.020%), Spanish (27.1%, a difference of 0.070%), Immigrants from Sri Lanka (27.1%, a difference of 0.080%), Nonimmigrants (27.2%, a difference of 0.090%), and Creek (27.1%, a difference of 0.13%).
| Demographics | Rating | Rank | Wage/Income Gap |
| Immigrants | Eastern Asia | 4.4 /100 | #237 | Tragic 27.1% |
| Osage | 4.4 /100 | #238 | Tragic 27.1% |
| Estonians | 4.3 /100 | #239 | Tragic 27.1% |
| Immigrants | Europe | 3.8 /100 | #240 | Tragic 27.1% |
| Creek | 3.8 /100 | #241 | Tragic 27.1% |
| Immigrants | Sri Lanka | 3.7 /100 | #242 | Tragic 27.1% |
| Spanish | 3.6 /100 | #243 | Tragic 27.1% |
| Chickasaw | 3.5 /100 | #244 | Tragic 27.2% |
| Immigrants | Azores | 3.5 /100 | #245 | Tragic 27.2% |
| Immigrants | Nonimmigrants | 3.3 /100 | #246 | Tragic 27.2% |
| Celtics | 2.8 /100 | #247 | Tragic 27.3% |
| Cypriots | 2.8 /100 | #248 | Tragic 27.3% |
| Carpatho Rusyns | 2.7 /100 | #249 | Tragic 27.3% |
| Immigrants | Czechoslovakia | 2.7 /100 | #250 | Tragic 27.3% |
| Immigrants | Norway | 2.5 /100 | #251 | Tragic 27.3% |