American vs Immigrants from Eritrea Per Capita Income
COMPARE
American
Immigrants from Eritrea
Per Capita Income
Per Capita Income Comparison
Americans
Immigrants from Eritrea
$39,039
PER CAPITA INCOME
0.6/ 100
METRIC RATING
264th/ 347
METRIC RANK
$44,509
PER CAPITA INCOME
72.1/ 100
METRIC RATING
150th/ 347
METRIC RANK
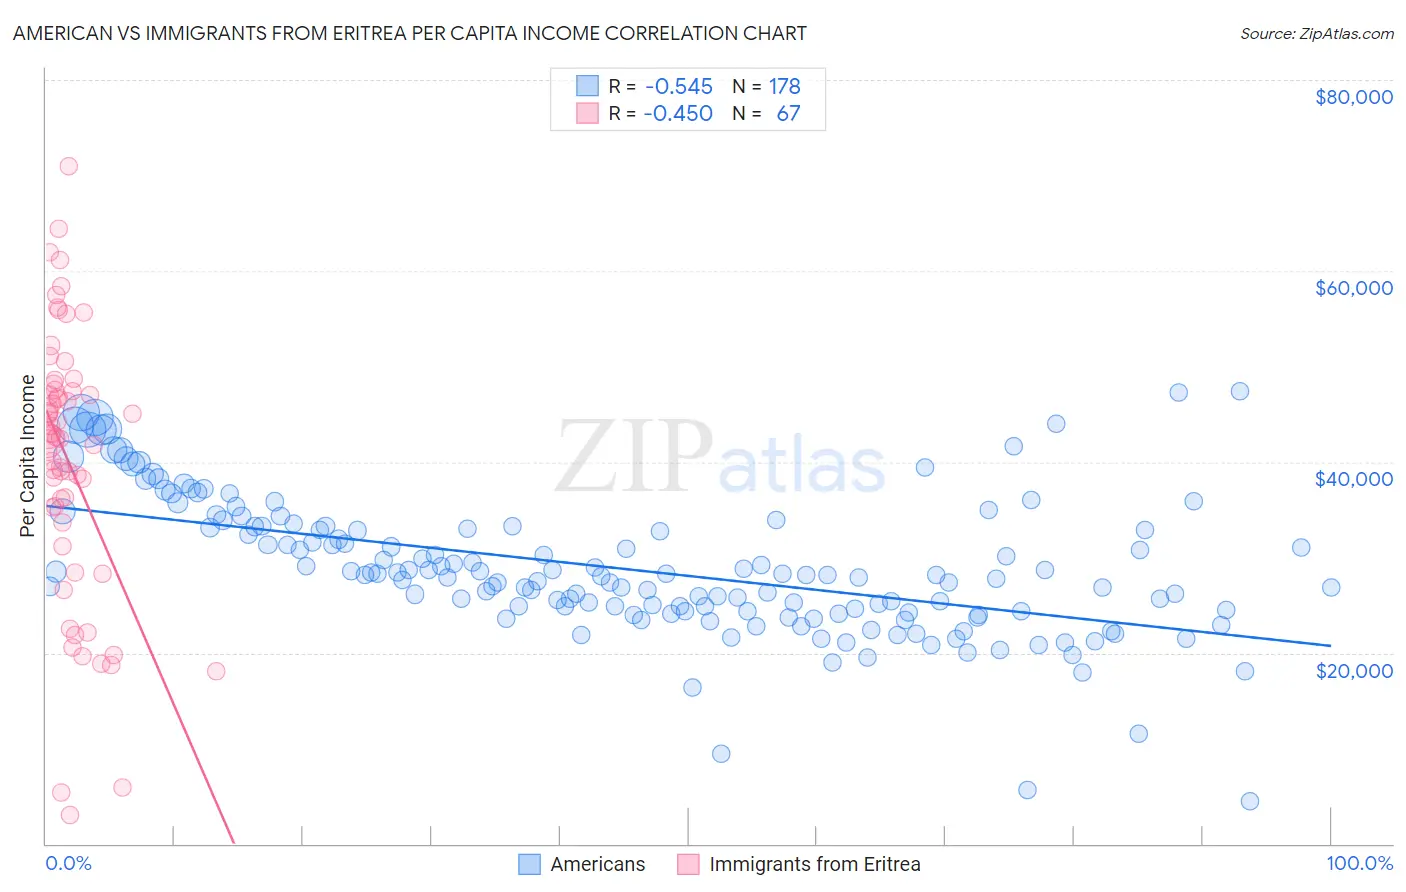
American vs Immigrants from Eritrea Per Capita Income Correlation Chart
The statistical analysis conducted on geographies consisting of 582,039,940 people shows a substantial negative correlation between the proportion of Americans and per capita income in the United States with a correlation coefficient (R) of -0.545 and weighted average of $39,039. Similarly, the statistical analysis conducted on geographies consisting of 104,855,166 people shows a moderate negative correlation between the proportion of Immigrants from Eritrea and per capita income in the United States with a correlation coefficient (R) of -0.450 and weighted average of $44,509, a difference of 14.0%.
Per Capita Income Correlation Summary
| Measurement | American | Immigrants from Eritrea |
| Minimum | $4,486 | $3,067 |
| Maximum | $47,414 | $70,972 |
| Range | $42,928 | $67,905 |
| Mean | $28,778 | $39,964 |
| Median | $28,107 | $42,389 |
| Interquartile 25% (IQ1) | $24,336 | $33,601 |
| Interquartile 75% (IQ3) | $33,158 | $47,507 |
| Interquartile Range (IQR) | $8,822 | $13,906 |
| Standard Deviation (Sample) | $7,186 | $14,141 |
| Standard Deviation (Population) | $7,166 | $14,035 |
Similar Demographics by Per Capita Income
Demographics Similar to Americans by Per Capita Income
In terms of per capita income, the demographic groups most similar to Americans are Spanish American ($39,012, a difference of 0.070%), Belizean ($39,097, a difference of 0.15%), Iroquois ($39,104, a difference of 0.16%), Marshallese ($39,108, a difference of 0.17%), and Alaskan Athabascan ($39,163, a difference of 0.32%).
| Demographics | Rating | Rank | Per Capita Income |
| Nicaraguans | 0.8 /100 | #257 | Tragic $39,372 |
| Jamaicans | 0.7 /100 | #258 | Tragic $39,231 |
| Malaysians | 0.7 /100 | #259 | Tragic $39,194 |
| Alaskan Athabascans | 0.6 /100 | #260 | Tragic $39,163 |
| Marshallese | 0.6 /100 | #261 | Tragic $39,108 |
| Iroquois | 0.6 /100 | #262 | Tragic $39,104 |
| Belizeans | 0.6 /100 | #263 | Tragic $39,097 |
| Americans | 0.6 /100 | #264 | Tragic $39,039 |
| Spanish Americans | 0.5 /100 | #265 | Tragic $39,012 |
| Salvadorans | 0.5 /100 | #266 | Tragic $38,858 |
| Immigrants | Zaire | 0.4 /100 | #267 | Tragic $38,848 |
| Liberians | 0.4 /100 | #268 | Tragic $38,780 |
| Immigrants | Jamaica | 0.4 /100 | #269 | Tragic $38,766 |
| Immigrants | Belize | 0.3 /100 | #270 | Tragic $38,614 |
| Central Americans | 0.3 /100 | #271 | Tragic $38,560 |
Demographics Similar to Immigrants from Eritrea by Per Capita Income
In terms of per capita income, the demographic groups most similar to Immigrants from Eritrea are Korean ($44,522, a difference of 0.030%), Norwegian ($44,480, a difference of 0.060%), Peruvian ($44,479, a difference of 0.070%), Immigrants from Armenia ($44,552, a difference of 0.10%), and Scottish ($44,440, a difference of 0.16%).
| Demographics | Rating | Rank | Per Capita Income |
| Immigrants | Uganda | 82.5 /100 | #143 | Excellent $45,043 |
| Icelanders | 81.6 /100 | #144 | Excellent $44,987 |
| Immigrants | Afghanistan | 78.0 /100 | #145 | Good $44,790 |
| Irish | 75.8 /100 | #146 | Good $44,679 |
| Czechs | 74.1 /100 | #147 | Good $44,595 |
| Immigrants | Armenia | 73.1 /100 | #148 | Good $44,552 |
| Koreans | 72.5 /100 | #149 | Good $44,522 |
| Immigrants | Eritrea | 72.1 /100 | #150 | Good $44,509 |
| Norwegians | 71.5 /100 | #151 | Good $44,480 |
| Peruvians | 71.5 /100 | #152 | Good $44,479 |
| Scottish | 70.6 /100 | #153 | Good $44,440 |
| Portuguese | 68.7 /100 | #154 | Good $44,362 |
| Uruguayans | 67.6 /100 | #155 | Good $44,318 |
| Slovaks | 65.4 /100 | #156 | Good $44,229 |
| South American Indians | 64.8 /100 | #157 | Good $44,206 |