Central American vs Immigrants from Eritrea Per Capita Income
COMPARE
Central American
Immigrants from Eritrea
Per Capita Income
Per Capita Income Comparison
Central Americans
Immigrants from Eritrea
$38,560
PER CAPITA INCOME
0.3/ 100
METRIC RATING
271st/ 347
METRIC RANK
$44,509
PER CAPITA INCOME
72.1/ 100
METRIC RATING
150th/ 347
METRIC RANK
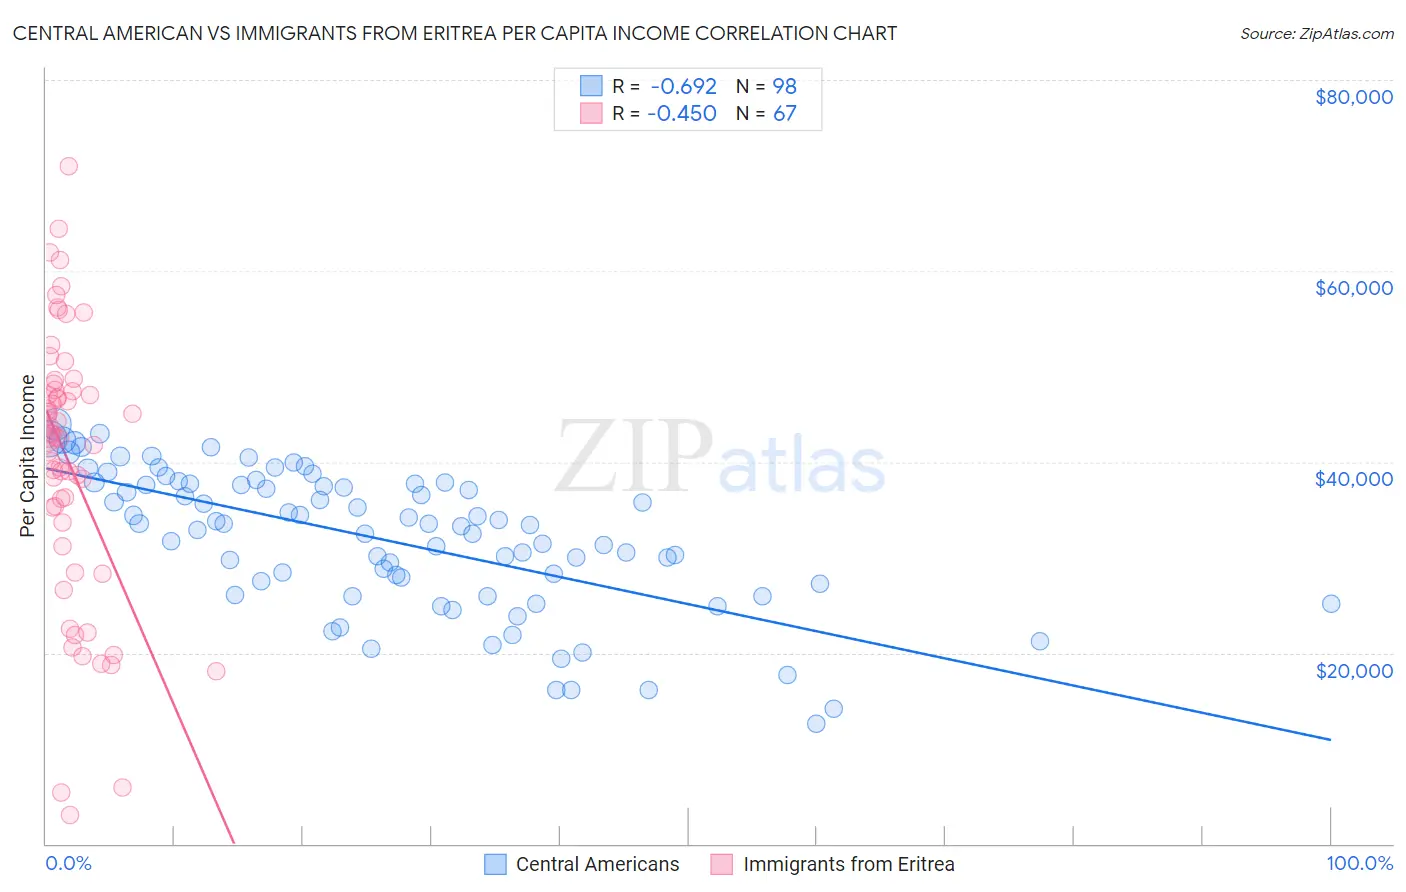
Central American vs Immigrants from Eritrea Per Capita Income Correlation Chart
The statistical analysis conducted on geographies consisting of 504,669,146 people shows a significant negative correlation between the proportion of Central Americans and per capita income in the United States with a correlation coefficient (R) of -0.692 and weighted average of $38,560. Similarly, the statistical analysis conducted on geographies consisting of 104,855,166 people shows a moderate negative correlation between the proportion of Immigrants from Eritrea and per capita income in the United States with a correlation coefficient (R) of -0.450 and weighted average of $44,509, a difference of 15.4%.
Per Capita Income Correlation Summary
| Measurement | Central American | Immigrants from Eritrea |
| Minimum | $12,606 | $3,067 |
| Maximum | $43,950 | $70,972 |
| Range | $31,344 | $67,905 |
| Mean | $31,868 | $39,964 |
| Median | $33,444 | $42,389 |
| Interquartile 25% (IQ1) | $27,188 | $33,601 |
| Interquartile 75% (IQ3) | $37,671 | $47,507 |
| Interquartile Range (IQR) | $10,483 | $13,906 |
| Standard Deviation (Sample) | $7,379 | $14,141 |
| Standard Deviation (Population) | $7,341 | $14,035 |
Similar Demographics by Per Capita Income
Demographics Similar to Central Americans by Per Capita Income
In terms of per capita income, the demographic groups most similar to Central Americans are Immigrants from Cabo Verde ($38,540, a difference of 0.050%), Immigrants from Belize ($38,614, a difference of 0.14%), Nepalese ($38,442, a difference of 0.31%), Immigrants from El Salvador ($38,394, a difference of 0.43%), and Immigrants from Jamaica ($38,766, a difference of 0.53%).
| Demographics | Rating | Rank | Per Capita Income |
| Americans | 0.6 /100 | #264 | Tragic $39,039 |
| Spanish Americans | 0.5 /100 | #265 | Tragic $39,012 |
| Salvadorans | 0.5 /100 | #266 | Tragic $38,858 |
| Immigrants | Zaire | 0.4 /100 | #267 | Tragic $38,848 |
| Liberians | 0.4 /100 | #268 | Tragic $38,780 |
| Immigrants | Jamaica | 0.4 /100 | #269 | Tragic $38,766 |
| Immigrants | Belize | 0.3 /100 | #270 | Tragic $38,614 |
| Central Americans | 0.3 /100 | #271 | Tragic $38,560 |
| Immigrants | Cabo Verde | 0.3 /100 | #272 | Tragic $38,540 |
| Nepalese | 0.3 /100 | #273 | Tragic $38,442 |
| Immigrants | El Salvador | 0.3 /100 | #274 | Tragic $38,394 |
| Immigrants | Liberia | 0.2 /100 | #275 | Tragic $38,165 |
| Hmong | 0.2 /100 | #276 | Tragic $38,120 |
| Comanche | 0.2 /100 | #277 | Tragic $38,088 |
| Immigrants | Nicaragua | 0.2 /100 | #278 | Tragic $38,065 |
Demographics Similar to Immigrants from Eritrea by Per Capita Income
In terms of per capita income, the demographic groups most similar to Immigrants from Eritrea are Korean ($44,522, a difference of 0.030%), Norwegian ($44,480, a difference of 0.060%), Peruvian ($44,479, a difference of 0.070%), Immigrants from Armenia ($44,552, a difference of 0.10%), and Scottish ($44,440, a difference of 0.16%).
| Demographics | Rating | Rank | Per Capita Income |
| Immigrants | Uganda | 82.5 /100 | #143 | Excellent $45,043 |
| Icelanders | 81.6 /100 | #144 | Excellent $44,987 |
| Immigrants | Afghanistan | 78.0 /100 | #145 | Good $44,790 |
| Irish | 75.8 /100 | #146 | Good $44,679 |
| Czechs | 74.1 /100 | #147 | Good $44,595 |
| Immigrants | Armenia | 73.1 /100 | #148 | Good $44,552 |
| Koreans | 72.5 /100 | #149 | Good $44,522 |
| Immigrants | Eritrea | 72.1 /100 | #150 | Good $44,509 |
| Norwegians | 71.5 /100 | #151 | Good $44,480 |
| Peruvians | 71.5 /100 | #152 | Good $44,479 |
| Scottish | 70.6 /100 | #153 | Good $44,440 |
| Portuguese | 68.7 /100 | #154 | Good $44,362 |
| Uruguayans | 67.6 /100 | #155 | Good $44,318 |
| Slovaks | 65.4 /100 | #156 | Good $44,229 |
| South American Indians | 64.8 /100 | #157 | Good $44,206 |