American vs Immigrants from West Indies Per Capita Income
COMPARE
American
Immigrants from West Indies
Per Capita Income
Per Capita Income Comparison
Americans
Immigrants from West Indies
$39,039
PER CAPITA INCOME
0.6/ 100
METRIC RATING
264th/ 347
METRIC RANK
$40,763
PER CAPITA INCOME
3.7/ 100
METRIC RATING
234th/ 347
METRIC RANK
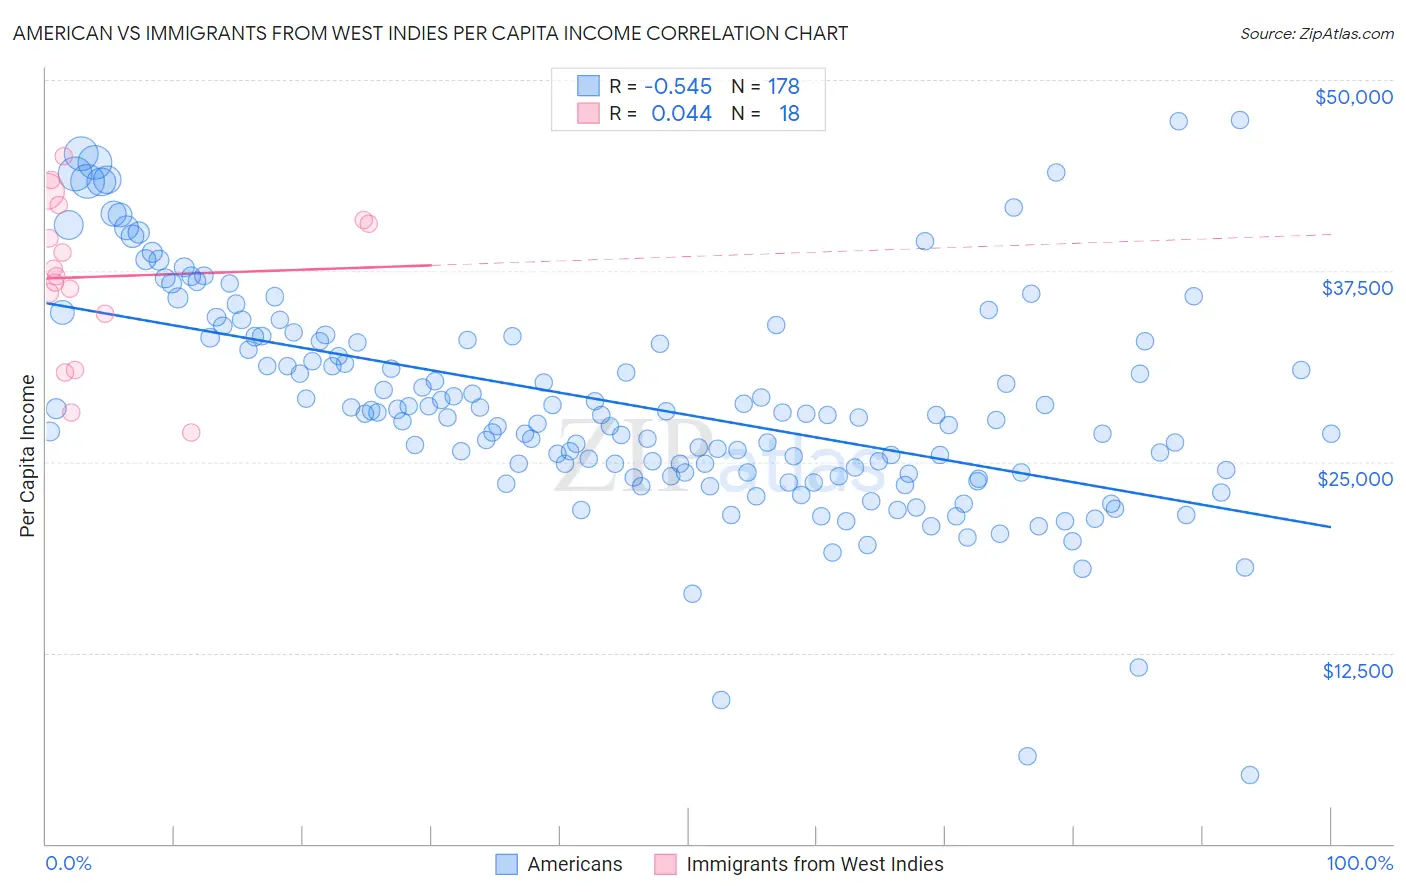
American vs Immigrants from West Indies Per Capita Income Correlation Chart
The statistical analysis conducted on geographies consisting of 582,039,940 people shows a substantial negative correlation between the proportion of Americans and per capita income in the United States with a correlation coefficient (R) of -0.545 and weighted average of $39,039. Similarly, the statistical analysis conducted on geographies consisting of 72,420,477 people shows no correlation between the proportion of Immigrants from West Indies and per capita income in the United States with a correlation coefficient (R) of 0.044 and weighted average of $40,763, a difference of 4.4%.
Per Capita Income Correlation Summary
| Measurement | American | Immigrants from West Indies |
| Minimum | $4,486 | $26,894 |
| Maximum | $47,414 | $45,008 |
| Range | $42,928 | $18,114 |
| Mean | $28,778 | $37,133 |
| Median | $28,107 | $37,421 |
| Interquartile 25% (IQ1) | $24,336 | $34,659 |
| Interquartile 75% (IQ3) | $33,158 | $40,860 |
| Interquartile Range (IQR) | $8,822 | $6,201 |
| Standard Deviation (Sample) | $7,186 | $5,188 |
| Standard Deviation (Population) | $7,166 | $5,042 |
Similar Demographics by Per Capita Income
Demographics Similar to Americans by Per Capita Income
In terms of per capita income, the demographic groups most similar to Americans are Spanish American ($39,012, a difference of 0.070%), Belizean ($39,097, a difference of 0.15%), Iroquois ($39,104, a difference of 0.16%), Marshallese ($39,108, a difference of 0.17%), and Alaskan Athabascan ($39,163, a difference of 0.32%).
| Demographics | Rating | Rank | Per Capita Income |
| Nicaraguans | 0.8 /100 | #257 | Tragic $39,372 |
| Jamaicans | 0.7 /100 | #258 | Tragic $39,231 |
| Malaysians | 0.7 /100 | #259 | Tragic $39,194 |
| Alaskan Athabascans | 0.6 /100 | #260 | Tragic $39,163 |
| Marshallese | 0.6 /100 | #261 | Tragic $39,108 |
| Iroquois | 0.6 /100 | #262 | Tragic $39,104 |
| Belizeans | 0.6 /100 | #263 | Tragic $39,097 |
| Americans | 0.6 /100 | #264 | Tragic $39,039 |
| Spanish Americans | 0.5 /100 | #265 | Tragic $39,012 |
| Salvadorans | 0.5 /100 | #266 | Tragic $38,858 |
| Immigrants | Zaire | 0.4 /100 | #267 | Tragic $38,848 |
| Liberians | 0.4 /100 | #268 | Tragic $38,780 |
| Immigrants | Jamaica | 0.4 /100 | #269 | Tragic $38,766 |
| Immigrants | Belize | 0.3 /100 | #270 | Tragic $38,614 |
| Central Americans | 0.3 /100 | #271 | Tragic $38,560 |
Demographics Similar to Immigrants from West Indies by Per Capita Income
In terms of per capita income, the demographic groups most similar to Immigrants from West Indies are Delaware ($40,778, a difference of 0.040%), Immigrants from Guyana ($40,742, a difference of 0.050%), Nonimmigrants ($40,669, a difference of 0.23%), Guyanese ($40,949, a difference of 0.46%), and Senegalese ($41,000, a difference of 0.58%).
| Demographics | Rating | Rank | Per Capita Income |
| Immigrants | Ghana | 5.5 /100 | #227 | Tragic $41,131 |
| Immigrants | Grenada | 5.5 /100 | #228 | Tragic $41,123 |
| Nigerians | 4.9 /100 | #229 | Tragic $41,026 |
| Native Hawaiians | 4.9 /100 | #230 | Tragic $41,017 |
| Senegalese | 4.8 /100 | #231 | Tragic $41,000 |
| Guyanese | 4.5 /100 | #232 | Tragic $40,949 |
| Delaware | 3.8 /100 | #233 | Tragic $40,778 |
| Immigrants | West Indies | 3.7 /100 | #234 | Tragic $40,763 |
| Immigrants | Guyana | 3.6 /100 | #235 | Tragic $40,742 |
| Immigrants | Nonimmigrants | 3.4 /100 | #236 | Tragic $40,669 |
| Immigrants | Cambodia | 2.6 /100 | #237 | Tragic $40,434 |
| Somalis | 2.4 /100 | #238 | Tragic $40,367 |
| Tsimshian | 2.4 /100 | #239 | Tragic $40,344 |
| Immigrants | Nigeria | 2.3 /100 | #240 | Tragic $40,339 |
| British West Indians | 2.3 /100 | #241 | Tragic $40,330 |