Potawatomi vs Immigrants from Eritrea Per Capita Income
COMPARE
Potawatomi
Immigrants from Eritrea
Per Capita Income
Per Capita Income Comparison
Potawatomi
Immigrants from Eritrea
$38,046
PER CAPITA INCOME
0.2/ 100
METRIC RATING
280th/ 347
METRIC RANK
$44,509
PER CAPITA INCOME
72.1/ 100
METRIC RATING
150th/ 347
METRIC RANK
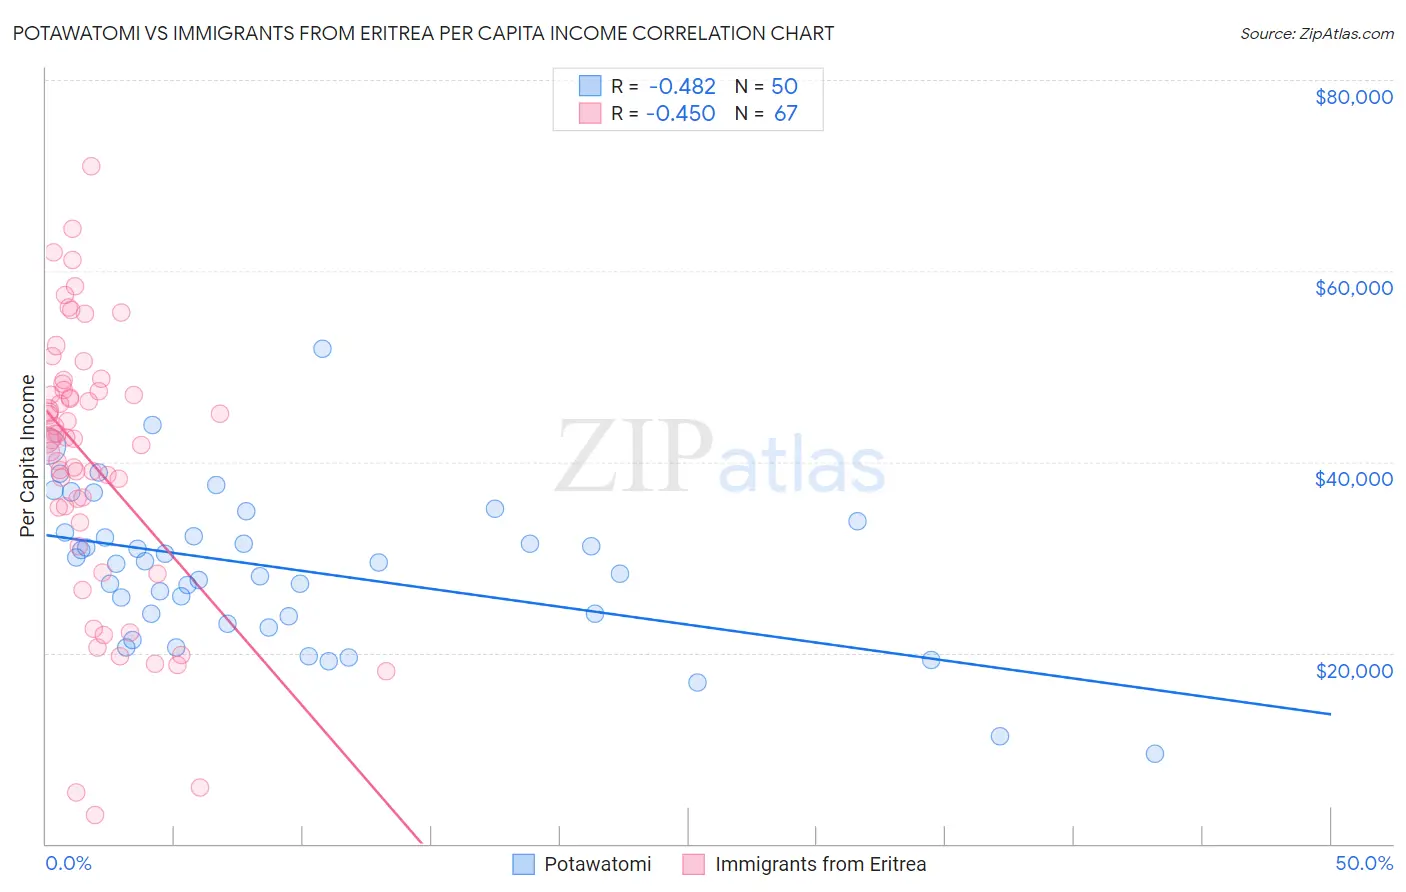
Potawatomi vs Immigrants from Eritrea Per Capita Income Correlation Chart
The statistical analysis conducted on geographies consisting of 117,768,459 people shows a moderate negative correlation between the proportion of Potawatomi and per capita income in the United States with a correlation coefficient (R) of -0.482 and weighted average of $38,046. Similarly, the statistical analysis conducted on geographies consisting of 104,855,166 people shows a moderate negative correlation between the proportion of Immigrants from Eritrea and per capita income in the United States with a correlation coefficient (R) of -0.450 and weighted average of $44,509, a difference of 17.0%.
Per Capita Income Correlation Summary
| Measurement | Potawatomi | Immigrants from Eritrea |
| Minimum | $9,447 | $3,067 |
| Maximum | $51,870 | $70,972 |
| Range | $42,423 | $67,905 |
| Mean | $28,766 | $39,964 |
| Median | $29,420 | $42,389 |
| Interquartile 25% (IQ1) | $23,768 | $33,601 |
| Interquartile 75% (IQ3) | $32,549 | $47,507 |
| Interquartile Range (IQR) | $8,781 | $13,906 |
| Standard Deviation (Sample) | $7,980 | $14,141 |
| Standard Deviation (Population) | $7,900 | $14,035 |
Similar Demographics by Per Capita Income
Demographics Similar to Potawatomi by Per Capita Income
In terms of per capita income, the demographic groups most similar to Potawatomi are Colville ($38,047, a difference of 0.0%), Immigrants from Nicaragua ($38,065, a difference of 0.050%), Comanche ($38,088, a difference of 0.11%), Hmong ($38,120, a difference of 0.20%), and Immigrants from Dominica ($37,952, a difference of 0.25%).
| Demographics | Rating | Rank | Per Capita Income |
| Nepalese | 0.3 /100 | #273 | Tragic $38,442 |
| Immigrants | El Salvador | 0.3 /100 | #274 | Tragic $38,394 |
| Immigrants | Liberia | 0.2 /100 | #275 | Tragic $38,165 |
| Hmong | 0.2 /100 | #276 | Tragic $38,120 |
| Comanche | 0.2 /100 | #277 | Tragic $38,088 |
| Immigrants | Nicaragua | 0.2 /100 | #278 | Tragic $38,065 |
| Colville | 0.2 /100 | #279 | Tragic $38,047 |
| Potawatomi | 0.2 /100 | #280 | Tragic $38,046 |
| Immigrants | Dominica | 0.2 /100 | #281 | Tragic $37,952 |
| Immigrants | Laos | 0.1 /100 | #282 | Tragic $37,857 |
| Pennsylvania Germans | 0.1 /100 | #283 | Tragic $37,842 |
| Africans | 0.1 /100 | #284 | Tragic $37,785 |
| Guatemalans | 0.1 /100 | #285 | Tragic $37,766 |
| Central American Indians | 0.1 /100 | #286 | Tragic $37,699 |
| Dominicans | 0.1 /100 | #287 | Tragic $37,697 |
Demographics Similar to Immigrants from Eritrea by Per Capita Income
In terms of per capita income, the demographic groups most similar to Immigrants from Eritrea are Korean ($44,522, a difference of 0.030%), Norwegian ($44,480, a difference of 0.060%), Peruvian ($44,479, a difference of 0.070%), Immigrants from Armenia ($44,552, a difference of 0.10%), and Scottish ($44,440, a difference of 0.16%).
| Demographics | Rating | Rank | Per Capita Income |
| Immigrants | Uganda | 82.5 /100 | #143 | Excellent $45,043 |
| Icelanders | 81.6 /100 | #144 | Excellent $44,987 |
| Immigrants | Afghanistan | 78.0 /100 | #145 | Good $44,790 |
| Irish | 75.8 /100 | #146 | Good $44,679 |
| Czechs | 74.1 /100 | #147 | Good $44,595 |
| Immigrants | Armenia | 73.1 /100 | #148 | Good $44,552 |
| Koreans | 72.5 /100 | #149 | Good $44,522 |
| Immigrants | Eritrea | 72.1 /100 | #150 | Good $44,509 |
| Norwegians | 71.5 /100 | #151 | Good $44,480 |
| Peruvians | 71.5 /100 | #152 | Good $44,479 |
| Scottish | 70.6 /100 | #153 | Good $44,440 |
| Portuguese | 68.7 /100 | #154 | Good $44,362 |
| Uruguayans | 67.6 /100 | #155 | Good $44,318 |
| Slovaks | 65.4 /100 | #156 | Good $44,229 |
| South American Indians | 64.8 /100 | #157 | Good $44,206 |