American vs Immigrants from Eritrea Child Poverty Under the Age of 5
COMPARE
American
Immigrants from Eritrea
Child Poverty Under the Age of 5
Child Poverty Under the Age of 5 Comparison
Americans
Immigrants from Eritrea
20.5%
CHILD POVERTY UNDER THE AGE OF 5
0.1/ 100
METRIC RATING
271st/ 347
METRIC RANK
19.1%
CHILD POVERTY UNDER THE AGE OF 5
1.5/ 100
METRIC RATING
226th/ 347
METRIC RANK
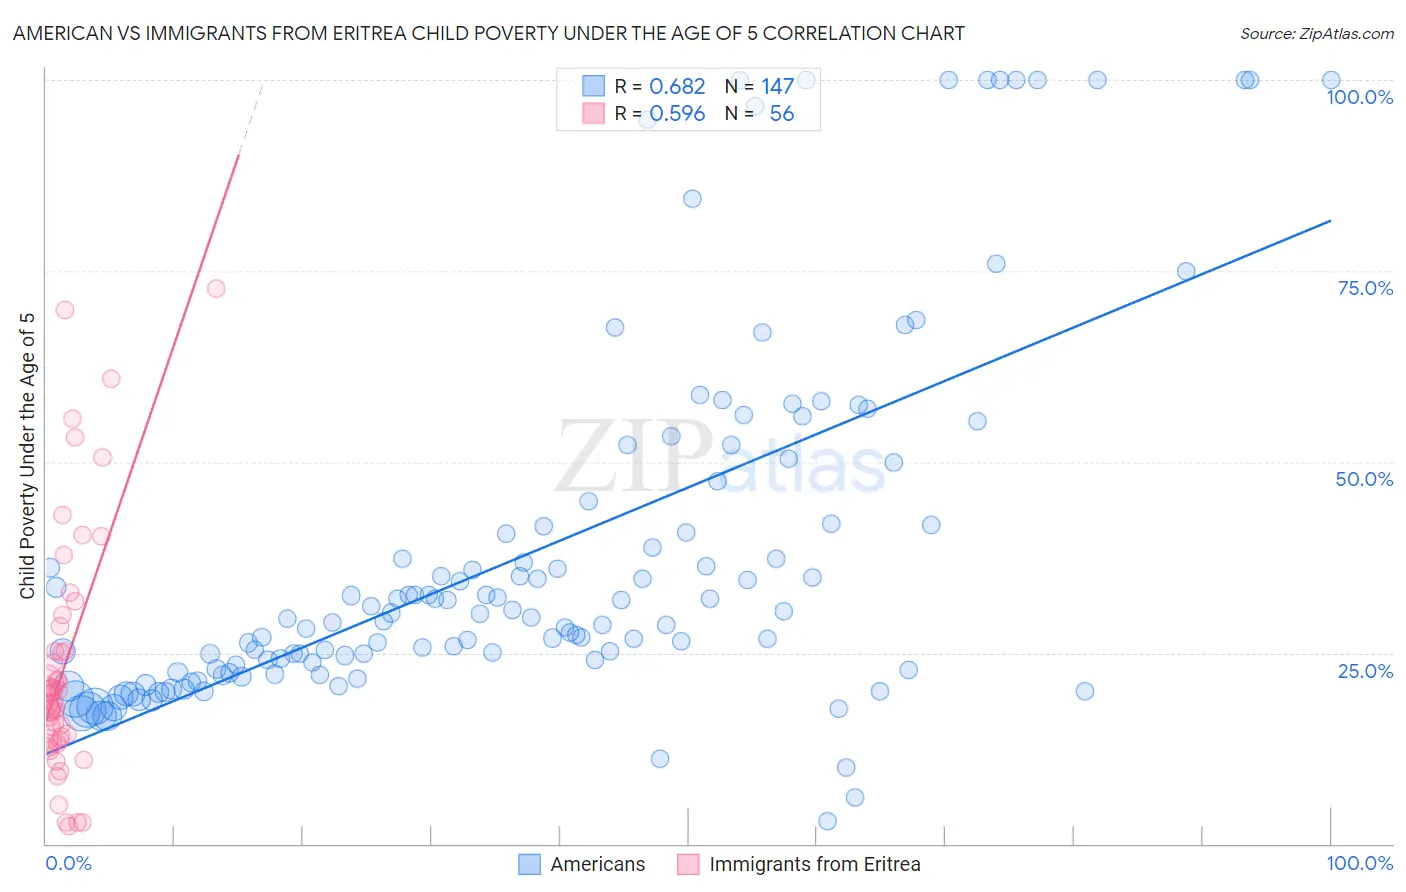
American vs Immigrants from Eritrea Child Poverty Under the Age of 5 Correlation Chart
The statistical analysis conducted on geographies consisting of 538,793,741 people shows a significant positive correlation between the proportion of Americans and poverty level among children under the age of 5 in the United States with a correlation coefficient (R) of 0.682 and weighted average of 20.5%. Similarly, the statistical analysis conducted on geographies consisting of 103,980,872 people shows a substantial positive correlation between the proportion of Immigrants from Eritrea and poverty level among children under the age of 5 in the United States with a correlation coefficient (R) of 0.596 and weighted average of 19.1%, a difference of 7.2%.
Child Poverty Under the Age of 5 Correlation Summary
| Measurement | American | Immigrants from Eritrea |
| Minimum | 2.9% | 2.3% |
| Maximum | 100.0% | 72.7% |
| Range | 97.1% | 70.4% |
| Mean | 38.1% | 23.3% |
| Median | 29.6% | 19.0% |
| Interquartile 25% (IQ1) | 22.8% | 13.6% |
| Interquartile 75% (IQ3) | 41.9% | 26.8% |
| Interquartile Range (IQR) | 19.1% | 13.2% |
| Standard Deviation (Sample) | 23.8% | 16.1% |
| Standard Deviation (Population) | 23.7% | 15.9% |
Similar Demographics by Child Poverty Under the Age of 5
Demographics Similar to Americans by Child Poverty Under the Age of 5
In terms of child poverty under the age of 5, the demographic groups most similar to Americans are Immigrants from Jamaica (20.5%, a difference of 0.12%), Jamaican (20.4%, a difference of 0.45%), Immigrants from Burma/Myanmar (20.4%, a difference of 0.52%), Ottawa (20.3%, a difference of 0.61%), and Belizean (20.3%, a difference of 0.61%).
| Demographics | Rating | Rank | Child Poverty Under the Age of 5 |
| Immigrants | Liberia | 0.1 /100 | #264 | Tragic 20.2% |
| Spanish American Indians | 0.1 /100 | #265 | Tragic 20.2% |
| Aleuts | 0.1 /100 | #266 | Tragic 20.3% |
| Ottawa | 0.1 /100 | #267 | Tragic 20.3% |
| Belizeans | 0.1 /100 | #268 | Tragic 20.3% |
| Immigrants | Burma/Myanmar | 0.1 /100 | #269 | Tragic 20.4% |
| Jamaicans | 0.1 /100 | #270 | Tragic 20.4% |
| Americans | 0.1 /100 | #271 | Tragic 20.5% |
| Immigrants | Jamaica | 0.1 /100 | #272 | Tragic 20.5% |
| Central Americans | 0.1 /100 | #273 | Tragic 20.6% |
| Immigrants | Belize | 0.1 /100 | #274 | Tragic 20.6% |
| Bangladeshis | 0.1 /100 | #275 | Tragic 20.6% |
| West Indians | 0.0 /100 | #276 | Tragic 20.6% |
| Immigrants | West Indies | 0.0 /100 | #277 | Tragic 20.7% |
| Immigrants | Grenada | 0.0 /100 | #278 | Tragic 20.7% |
Demographics Similar to Immigrants from Eritrea by Child Poverty Under the Age of 5
In terms of child poverty under the age of 5, the demographic groups most similar to Immigrants from Eritrea are Nigerian (19.1%, a difference of 0.020%), Nicaraguan (19.1%, a difference of 0.050%), Cuban (19.1%, a difference of 0.16%), Alsatian (19.1%, a difference of 0.18%), and Cape Verdean (19.1%, a difference of 0.18%).
| Demographics | Rating | Rank | Child Poverty Under the Age of 5 |
| German Russians | 3.0 /100 | #219 | Tragic 18.8% |
| Immigrants | Azores | 2.6 /100 | #220 | Tragic 18.9% |
| Immigrants | Nigeria | 2.1 /100 | #221 | Tragic 19.0% |
| Alsatians | 1.7 /100 | #222 | Tragic 19.1% |
| Cubans | 1.7 /100 | #223 | Tragic 19.1% |
| Nicaraguans | 1.6 /100 | #224 | Tragic 19.1% |
| Nigerians | 1.6 /100 | #225 | Tragic 19.1% |
| Immigrants | Eritrea | 1.5 /100 | #226 | Tragic 19.1% |
| Cape Verdeans | 1.4 /100 | #227 | Tragic 19.1% |
| Immigrants | Sudan | 1.3 /100 | #228 | Tragic 19.2% |
| Ghanaians | 1.2 /100 | #229 | Tragic 19.2% |
| Ecuadorians | 1.2 /100 | #230 | Tragic 19.2% |
| Bermudans | 1.2 /100 | #231 | Tragic 19.2% |
| Trinidadians and Tobagonians | 0.9 /100 | #232 | Tragic 19.3% |
| Sudanese | 0.9 /100 | #233 | Tragic 19.3% |