American vs Cape Verdean Per Capita Income
COMPARE
American
Cape Verdean
Per Capita Income
Per Capita Income Comparison
Americans
Cape Verdeans
$39,039
PER CAPITA INCOME
0.6/ 100
METRIC RATING
264th/ 347
METRIC RANK
$39,935
PER CAPITA INCOME
1.5/ 100
METRIC RATING
248th/ 347
METRIC RANK
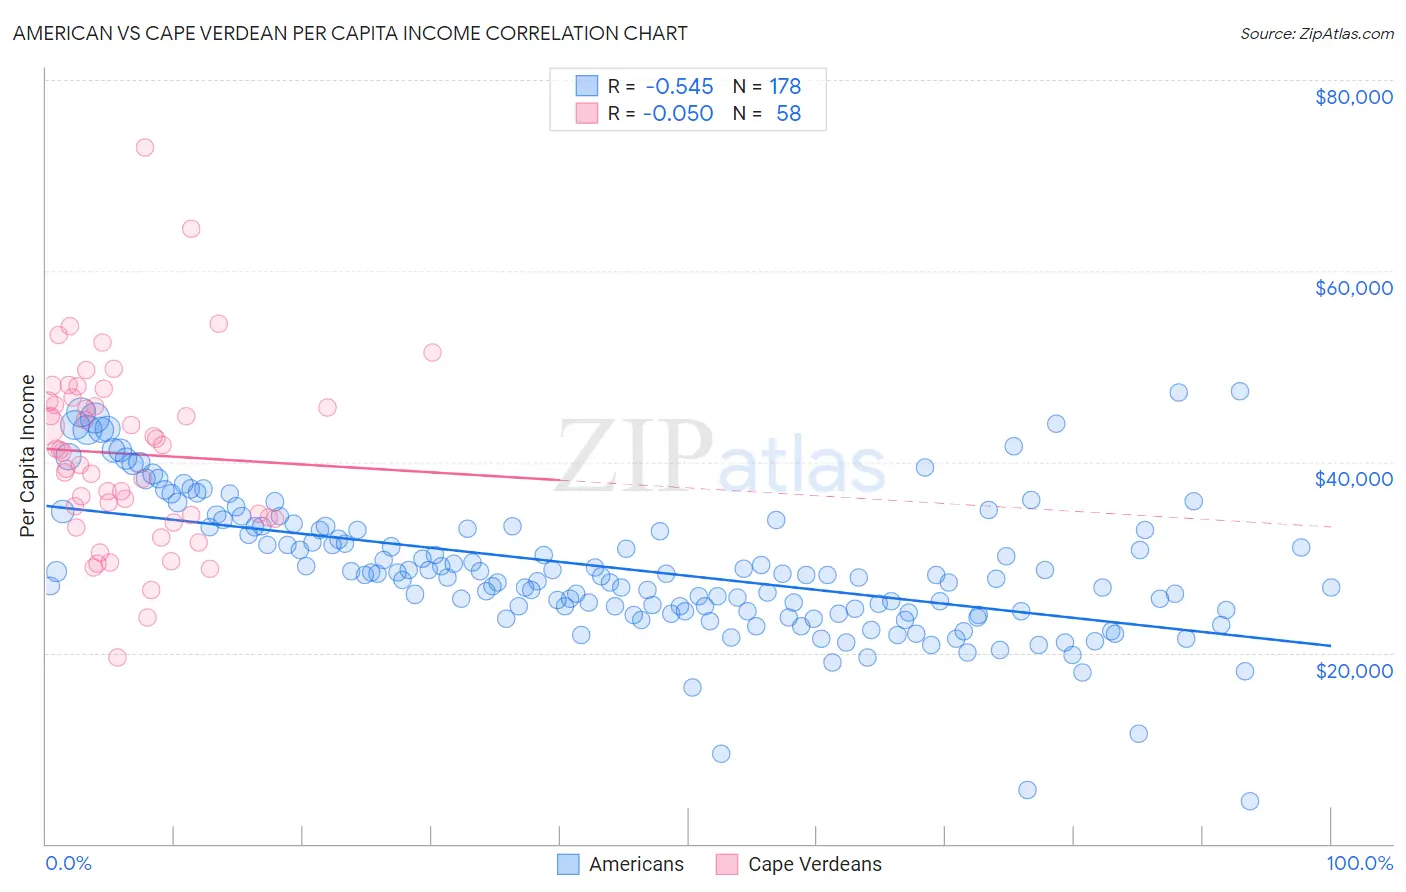
American vs Cape Verdean Per Capita Income Correlation Chart
The statistical analysis conducted on geographies consisting of 582,039,940 people shows a substantial negative correlation between the proportion of Americans and per capita income in the United States with a correlation coefficient (R) of -0.545 and weighted average of $39,039. Similarly, the statistical analysis conducted on geographies consisting of 107,581,213 people shows no correlation between the proportion of Cape Verdeans and per capita income in the United States with a correlation coefficient (R) of -0.050 and weighted average of $39,935, a difference of 2.3%.
Per Capita Income Correlation Summary
| Measurement | American | Cape Verdean |
| Minimum | $4,486 | $19,552 |
| Maximum | $47,414 | $72,967 |
| Range | $42,928 | $53,415 |
| Mean | $28,778 | $40,842 |
| Median | $28,107 | $41,136 |
| Interquartile 25% (IQ1) | $24,336 | $34,180 |
| Interquartile 75% (IQ3) | $33,158 | $46,319 |
| Interquartile Range (IQR) | $8,822 | $12,139 |
| Standard Deviation (Sample) | $7,186 | $9,616 |
| Standard Deviation (Population) | $7,166 | $9,533 |
Demographics Similar to Americans and Cape Verdeans by Per Capita Income
In terms of per capita income, the demographic groups most similar to Americans are Spanish American ($39,012, a difference of 0.070%), Belizean ($39,097, a difference of 0.15%), Iroquois ($39,104, a difference of 0.16%), Marshallese ($39,108, a difference of 0.17%), and Alaskan Athabascan ($39,163, a difference of 0.32%). Similarly, the demographic groups most similar to Cape Verdeans are Immigrants from Somalia ($39,974, a difference of 0.10%), Japanese ($39,870, a difference of 0.16%), Immigrants from Burma/Myanmar ($39,827, a difference of 0.27%), Samoan ($39,826, a difference of 0.27%), and Cree ($40,056, a difference of 0.30%).
| Demographics | Rating | Rank | Per Capita Income |
| Cree | 1.7 /100 | #246 | Tragic $40,056 |
| Immigrants | Somalia | 1.6 /100 | #247 | Tragic $39,974 |
| Cape Verdeans | 1.5 /100 | #248 | Tragic $39,935 |
| Japanese | 1.4 /100 | #249 | Tragic $39,870 |
| Immigrants | Burma/Myanmar | 1.3 /100 | #250 | Tragic $39,827 |
| Samoans | 1.3 /100 | #251 | Tragic $39,826 |
| Immigrants | Azores | 1.0 /100 | #252 | Tragic $39,608 |
| Osage | 1.0 /100 | #253 | Tragic $39,568 |
| Alaska Natives | 1.0 /100 | #254 | Tragic $39,558 |
| Immigrants | Middle Africa | 1.0 /100 | #255 | Tragic $39,529 |
| Hawaiians | 0.8 /100 | #256 | Tragic $39,403 |
| Nicaraguans | 0.8 /100 | #257 | Tragic $39,372 |
| Jamaicans | 0.7 /100 | #258 | Tragic $39,231 |
| Malaysians | 0.7 /100 | #259 | Tragic $39,194 |
| Alaskan Athabascans | 0.6 /100 | #260 | Tragic $39,163 |
| Marshallese | 0.6 /100 | #261 | Tragic $39,108 |
| Iroquois | 0.6 /100 | #262 | Tragic $39,104 |
| Belizeans | 0.6 /100 | #263 | Tragic $39,097 |
| Americans | 0.6 /100 | #264 | Tragic $39,039 |
| Spanish Americans | 0.5 /100 | #265 | Tragic $39,012 |
| Salvadorans | 0.5 /100 | #266 | Tragic $38,858 |