American vs Native Hawaiian Per Capita Income
COMPARE
American
Native Hawaiian
Per Capita Income
Per Capita Income Comparison
Americans
Native Hawaiians
$39,039
PER CAPITA INCOME
0.6/ 100
METRIC RATING
264th/ 347
METRIC RANK
$41,017
PER CAPITA INCOME
4.9/ 100
METRIC RATING
230th/ 347
METRIC RANK
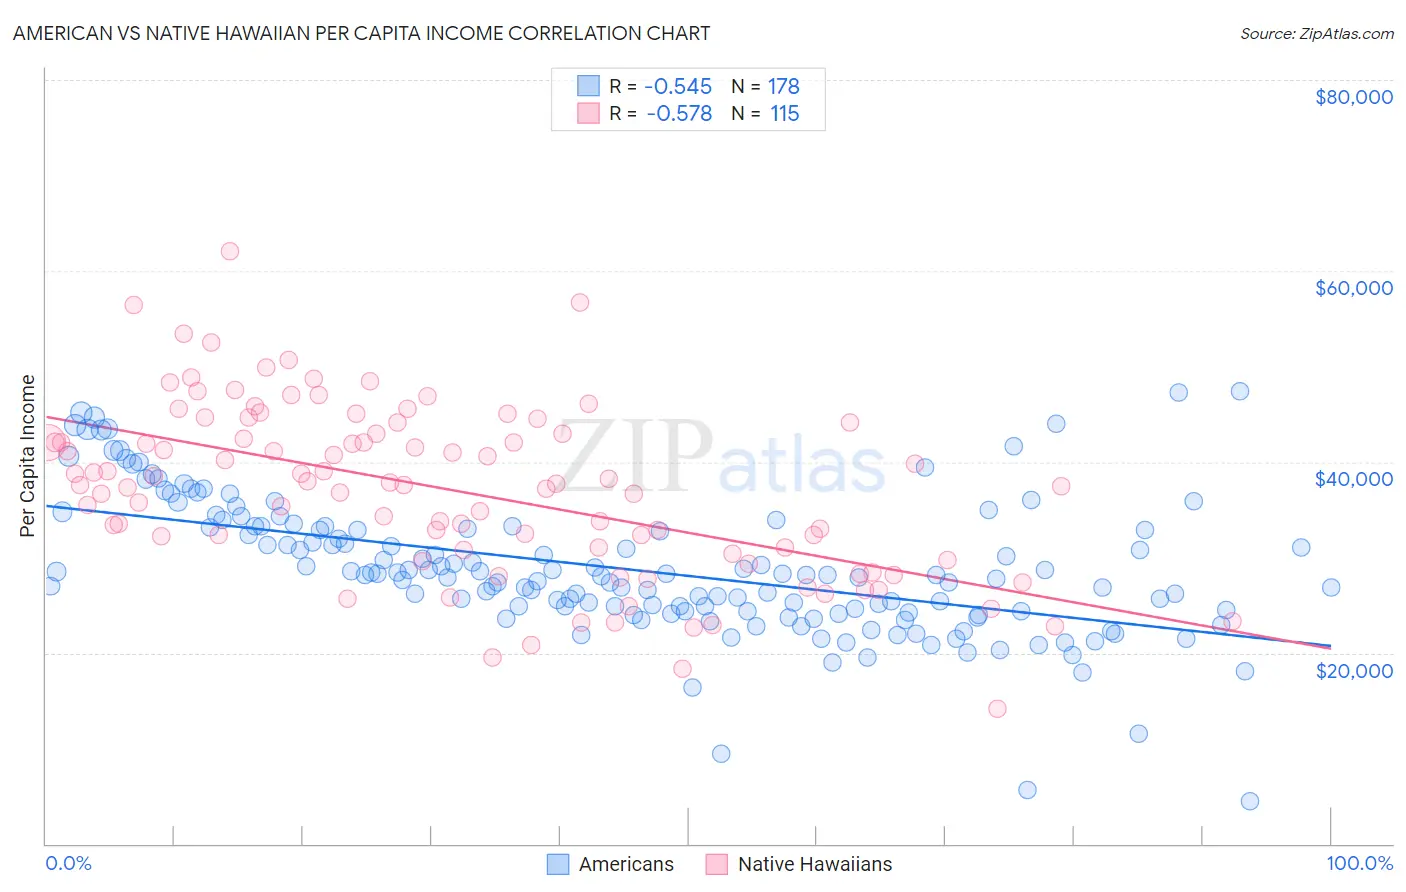
American vs Native Hawaiian Per Capita Income Correlation Chart
The statistical analysis conducted on geographies consisting of 582,039,940 people shows a substantial negative correlation between the proportion of Americans and per capita income in the United States with a correlation coefficient (R) of -0.545 and weighted average of $39,039. Similarly, the statistical analysis conducted on geographies consisting of 332,135,115 people shows a substantial negative correlation between the proportion of Native Hawaiians and per capita income in the United States with a correlation coefficient (R) of -0.578 and weighted average of $41,017, a difference of 5.1%.
Per Capita Income Correlation Summary
| Measurement | American | Native Hawaiian |
| Minimum | $4,486 | $14,082 |
| Maximum | $47,414 | $62,011 |
| Range | $42,928 | $47,929 |
| Mean | $28,778 | $36,984 |
| Median | $28,107 | $37,623 |
| Interquartile 25% (IQ1) | $24,336 | $30,336 |
| Interquartile 75% (IQ3) | $33,158 | $42,931 |
| Interquartile Range (IQR) | $8,822 | $12,595 |
| Standard Deviation (Sample) | $7,186 | $9,013 |
| Standard Deviation (Population) | $7,166 | $8,974 |
Similar Demographics by Per Capita Income
Demographics Similar to Americans by Per Capita Income
In terms of per capita income, the demographic groups most similar to Americans are Spanish American ($39,012, a difference of 0.070%), Belizean ($39,097, a difference of 0.15%), Iroquois ($39,104, a difference of 0.16%), Marshallese ($39,108, a difference of 0.17%), and Alaskan Athabascan ($39,163, a difference of 0.32%).
| Demographics | Rating | Rank | Per Capita Income |
| Nicaraguans | 0.8 /100 | #257 | Tragic $39,372 |
| Jamaicans | 0.7 /100 | #258 | Tragic $39,231 |
| Malaysians | 0.7 /100 | #259 | Tragic $39,194 |
| Alaskan Athabascans | 0.6 /100 | #260 | Tragic $39,163 |
| Marshallese | 0.6 /100 | #261 | Tragic $39,108 |
| Iroquois | 0.6 /100 | #262 | Tragic $39,104 |
| Belizeans | 0.6 /100 | #263 | Tragic $39,097 |
| Americans | 0.6 /100 | #264 | Tragic $39,039 |
| Spanish Americans | 0.5 /100 | #265 | Tragic $39,012 |
| Salvadorans | 0.5 /100 | #266 | Tragic $38,858 |
| Immigrants | Zaire | 0.4 /100 | #267 | Tragic $38,848 |
| Liberians | 0.4 /100 | #268 | Tragic $38,780 |
| Immigrants | Jamaica | 0.4 /100 | #269 | Tragic $38,766 |
| Immigrants | Belize | 0.3 /100 | #270 | Tragic $38,614 |
| Central Americans | 0.3 /100 | #271 | Tragic $38,560 |
Demographics Similar to Native Hawaiians by Per Capita Income
In terms of per capita income, the demographic groups most similar to Native Hawaiians are Nigerian ($41,026, a difference of 0.020%), Senegalese ($41,000, a difference of 0.040%), Guyanese ($40,949, a difference of 0.16%), Immigrants from Grenada ($41,123, a difference of 0.26%), and Immigrants from Ghana ($41,131, a difference of 0.28%).
| Demographics | Rating | Rank | Per Capita Income |
| Immigrants | Cameroon | 6.8 /100 | #223 | Tragic $41,334 |
| Immigrants | St. Vincent and the Grenadines | 6.4 /100 | #224 | Tragic $41,270 |
| West Indians | 6.0 /100 | #225 | Tragic $41,217 |
| Immigrants | Ecuador | 5.9 /100 | #226 | Tragic $41,195 |
| Immigrants | Ghana | 5.5 /100 | #227 | Tragic $41,131 |
| Immigrants | Grenada | 5.5 /100 | #228 | Tragic $41,123 |
| Nigerians | 4.9 /100 | #229 | Tragic $41,026 |
| Native Hawaiians | 4.9 /100 | #230 | Tragic $41,017 |
| Senegalese | 4.8 /100 | #231 | Tragic $41,000 |
| Guyanese | 4.5 /100 | #232 | Tragic $40,949 |
| Delaware | 3.8 /100 | #233 | Tragic $40,778 |
| Immigrants | West Indies | 3.7 /100 | #234 | Tragic $40,763 |
| Immigrants | Guyana | 3.6 /100 | #235 | Tragic $40,742 |
| Immigrants | Nonimmigrants | 3.4 /100 | #236 | Tragic $40,669 |
| Immigrants | Cambodia | 2.6 /100 | #237 | Tragic $40,434 |