American vs Immigrants from India Per Capita Income
COMPARE
American
Immigrants from India
Per Capita Income
Per Capita Income Comparison
Americans
Immigrants from India
$39,039
PER CAPITA INCOME
0.6/ 100
METRIC RATING
264th/ 347
METRIC RANK
$55,268
PER CAPITA INCOME
100.0/ 100
METRIC RATING
13th/ 347
METRIC RANK
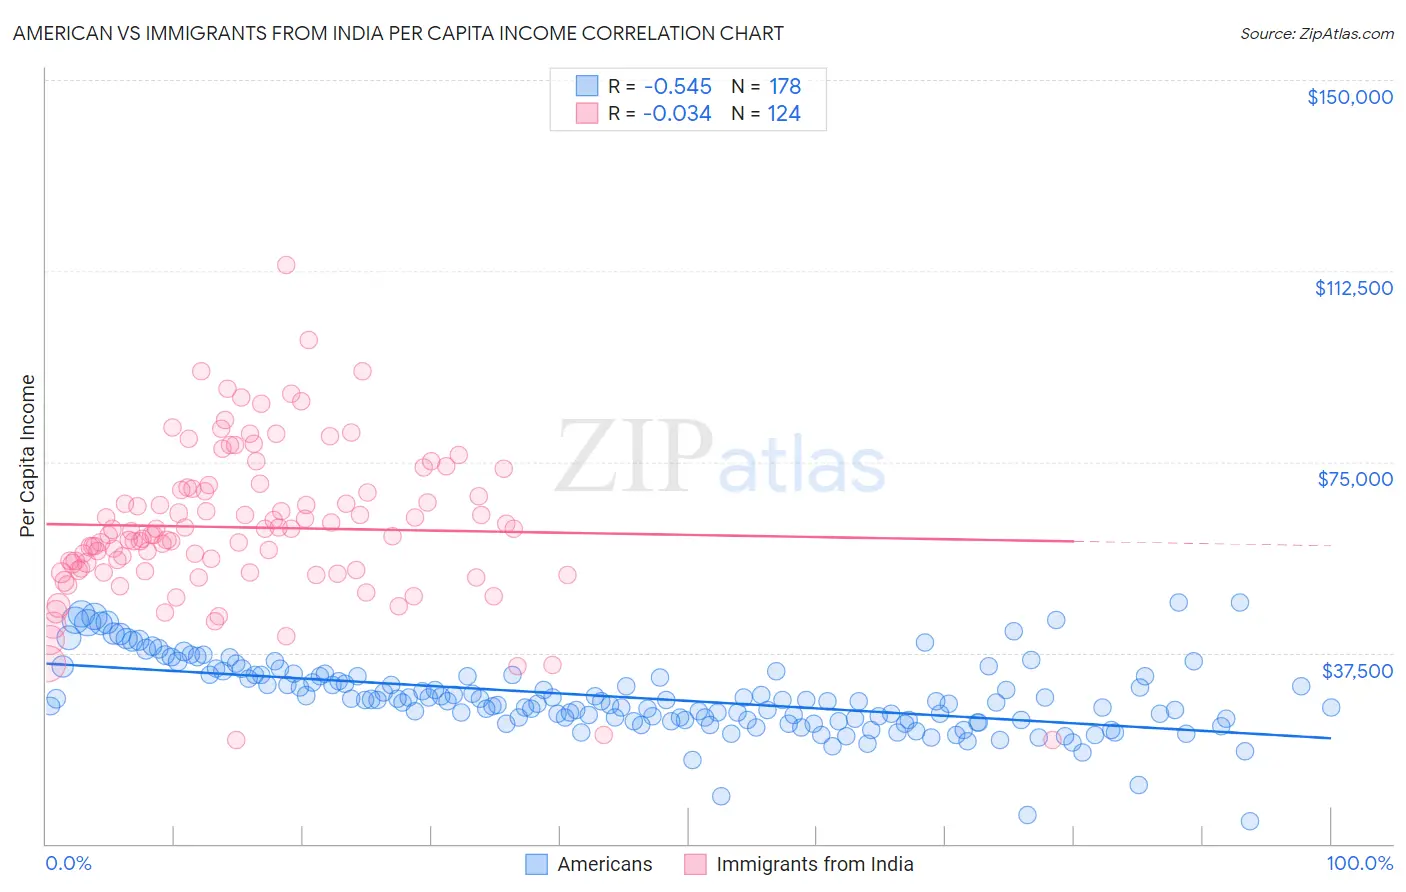
American vs Immigrants from India Per Capita Income Correlation Chart
The statistical analysis conducted on geographies consisting of 582,039,940 people shows a substantial negative correlation between the proportion of Americans and per capita income in the United States with a correlation coefficient (R) of -0.545 and weighted average of $39,039. Similarly, the statistical analysis conducted on geographies consisting of 434,146,004 people shows no correlation between the proportion of Immigrants from India and per capita income in the United States with a correlation coefficient (R) of -0.034 and weighted average of $55,268, a difference of 41.6%.
Per Capita Income Correlation Summary
| Measurement | American | Immigrants from India |
| Minimum | $4,486 | $20,341 |
| Maximum | $47,414 | $113,550 |
| Range | $42,928 | $93,209 |
| Mean | $28,778 | $62,129 |
| Median | $28,107 | $60,635 |
| Interquartile 25% (IQ1) | $24,336 | $53,591 |
| Interquartile 75% (IQ3) | $33,158 | $69,609 |
| Interquartile Range (IQR) | $8,822 | $16,018 |
| Standard Deviation (Sample) | $7,186 | $14,973 |
| Standard Deviation (Population) | $7,166 | $14,913 |
Similar Demographics by Per Capita Income
Demographics Similar to Americans by Per Capita Income
In terms of per capita income, the demographic groups most similar to Americans are Spanish American ($39,012, a difference of 0.070%), Belizean ($39,097, a difference of 0.15%), Iroquois ($39,104, a difference of 0.16%), Marshallese ($39,108, a difference of 0.17%), and Alaskan Athabascan ($39,163, a difference of 0.32%).
| Demographics | Rating | Rank | Per Capita Income |
| Nicaraguans | 0.8 /100 | #257 | Tragic $39,372 |
| Jamaicans | 0.7 /100 | #258 | Tragic $39,231 |
| Malaysians | 0.7 /100 | #259 | Tragic $39,194 |
| Alaskan Athabascans | 0.6 /100 | #260 | Tragic $39,163 |
| Marshallese | 0.6 /100 | #261 | Tragic $39,108 |
| Iroquois | 0.6 /100 | #262 | Tragic $39,104 |
| Belizeans | 0.6 /100 | #263 | Tragic $39,097 |
| Americans | 0.6 /100 | #264 | Tragic $39,039 |
| Spanish Americans | 0.5 /100 | #265 | Tragic $39,012 |
| Salvadorans | 0.5 /100 | #266 | Tragic $38,858 |
| Immigrants | Zaire | 0.4 /100 | #267 | Tragic $38,848 |
| Liberians | 0.4 /100 | #268 | Tragic $38,780 |
| Immigrants | Jamaica | 0.4 /100 | #269 | Tragic $38,766 |
| Immigrants | Belize | 0.3 /100 | #270 | Tragic $38,614 |
| Central Americans | 0.3 /100 | #271 | Tragic $38,560 |
Demographics Similar to Immigrants from India by Per Capita Income
In terms of per capita income, the demographic groups most similar to Immigrants from India are Immigrants from Belgium ($55,082, a difference of 0.34%), Immigrants from Sweden ($55,582, a difference of 0.57%), Cypriot ($54,899, a difference of 0.67%), Immigrants from Switzerland ($54,866, a difference of 0.73%), and Eastern European ($55,780, a difference of 0.93%).
| Demographics | Rating | Rank | Per Capita Income |
| Immigrants | Taiwan | 100.0 /100 | #6 | Exceptional $57,742 |
| Immigrants | Israel | 100.0 /100 | #7 | Exceptional $57,384 |
| Immigrants | Hong Kong | 100.0 /100 | #8 | Exceptional $56,709 |
| Immigrants | Ireland | 100.0 /100 | #9 | Exceptional $56,584 |
| Okinawans | 100.0 /100 | #10 | Exceptional $55,817 |
| Eastern Europeans | 100.0 /100 | #11 | Exceptional $55,780 |
| Immigrants | Sweden | 100.0 /100 | #12 | Exceptional $55,582 |
| Immigrants | India | 100.0 /100 | #13 | Exceptional $55,268 |
| Immigrants | Belgium | 100.0 /100 | #14 | Exceptional $55,082 |
| Cypriots | 100.0 /100 | #15 | Exceptional $54,899 |
| Immigrants | Switzerland | 100.0 /100 | #16 | Exceptional $54,866 |
| Immigrants | France | 100.0 /100 | #17 | Exceptional $54,557 |
| Thais | 100.0 /100 | #18 | Exceptional $54,307 |
| Immigrants | China | 100.0 /100 | #19 | Exceptional $54,264 |
| Soviet Union | 100.0 /100 | #20 | Exceptional $54,202 |