American vs Immigrants from Senegal Per Capita Income
COMPARE
American
Immigrants from Senegal
Per Capita Income
Per Capita Income Comparison
Americans
Immigrants from Senegal
$39,039
PER CAPITA INCOME
0.6/ 100
METRIC RATING
264th/ 347
METRIC RANK
$41,830
PER CAPITA INCOME
11.3/ 100
METRIC RATING
212th/ 347
METRIC RANK
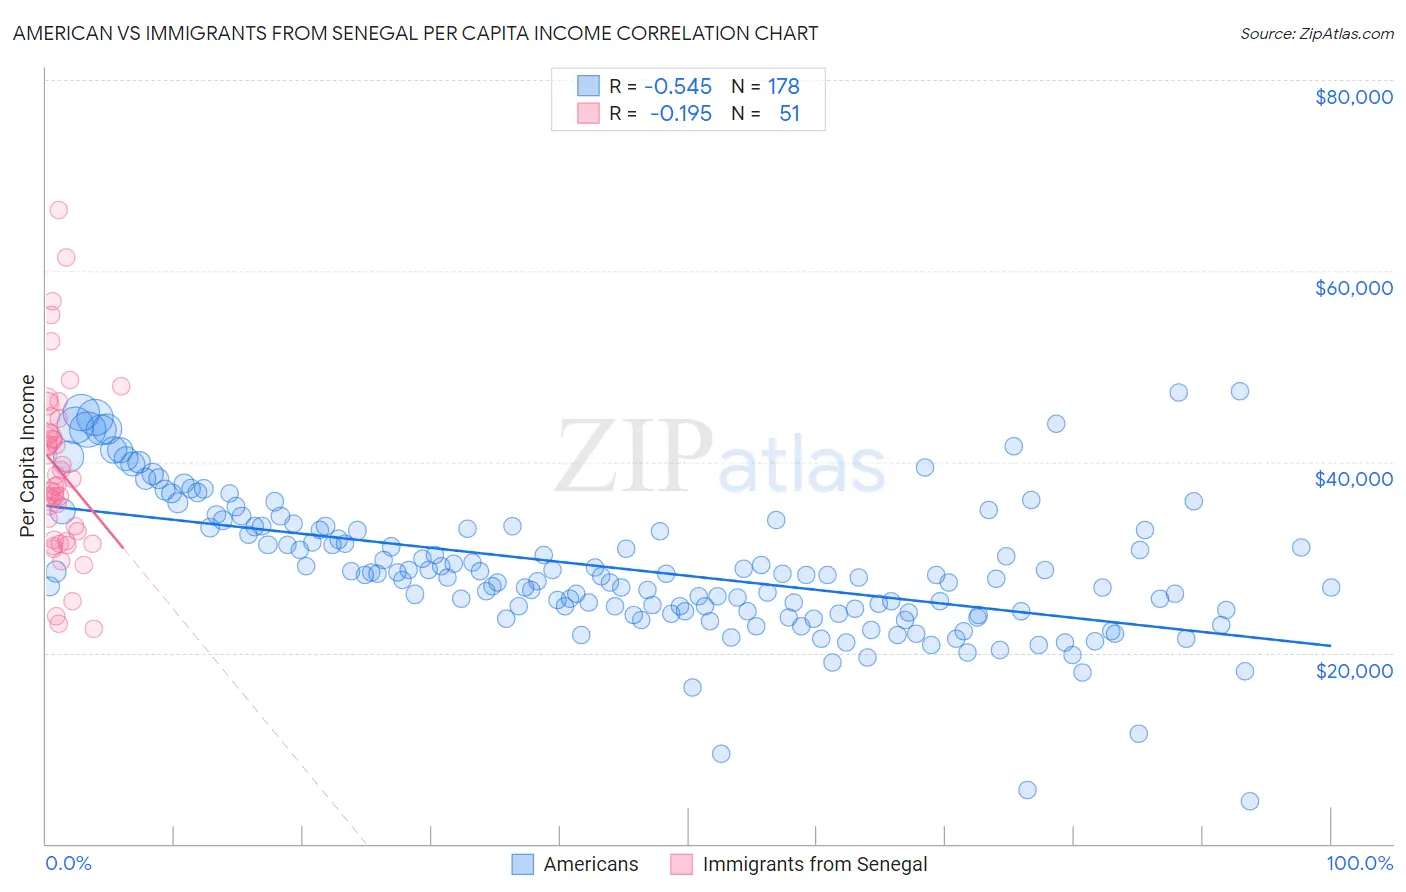
American vs Immigrants from Senegal Per Capita Income Correlation Chart
The statistical analysis conducted on geographies consisting of 582,039,940 people shows a substantial negative correlation between the proportion of Americans and per capita income in the United States with a correlation coefficient (R) of -0.545 and weighted average of $39,039. Similarly, the statistical analysis conducted on geographies consisting of 90,129,295 people shows a poor negative correlation between the proportion of Immigrants from Senegal and per capita income in the United States with a correlation coefficient (R) of -0.195 and weighted average of $41,830, a difference of 7.1%.
Per Capita Income Correlation Summary
| Measurement | American | Immigrants from Senegal |
| Minimum | $4,486 | $22,459 |
| Maximum | $47,414 | $66,378 |
| Range | $42,928 | $43,919 |
| Mean | $28,778 | $39,027 |
| Median | $28,107 | $37,536 |
| Interquartile 25% (IQ1) | $24,336 | $31,835 |
| Interquartile 75% (IQ3) | $33,158 | $42,907 |
| Interquartile Range (IQR) | $8,822 | $11,072 |
| Standard Deviation (Sample) | $7,186 | $9,175 |
| Standard Deviation (Population) | $7,166 | $9,085 |
Similar Demographics by Per Capita Income
Demographics Similar to Americans by Per Capita Income
In terms of per capita income, the demographic groups most similar to Americans are Spanish American ($39,012, a difference of 0.070%), Belizean ($39,097, a difference of 0.15%), Iroquois ($39,104, a difference of 0.16%), Marshallese ($39,108, a difference of 0.17%), and Alaskan Athabascan ($39,163, a difference of 0.32%).
| Demographics | Rating | Rank | Per Capita Income |
| Nicaraguans | 0.8 /100 | #257 | Tragic $39,372 |
| Jamaicans | 0.7 /100 | #258 | Tragic $39,231 |
| Malaysians | 0.7 /100 | #259 | Tragic $39,194 |
| Alaskan Athabascans | 0.6 /100 | #260 | Tragic $39,163 |
| Marshallese | 0.6 /100 | #261 | Tragic $39,108 |
| Iroquois | 0.6 /100 | #262 | Tragic $39,104 |
| Belizeans | 0.6 /100 | #263 | Tragic $39,097 |
| Americans | 0.6 /100 | #264 | Tragic $39,039 |
| Spanish Americans | 0.5 /100 | #265 | Tragic $39,012 |
| Salvadorans | 0.5 /100 | #266 | Tragic $38,858 |
| Immigrants | Zaire | 0.4 /100 | #267 | Tragic $38,848 |
| Liberians | 0.4 /100 | #268 | Tragic $38,780 |
| Immigrants | Jamaica | 0.4 /100 | #269 | Tragic $38,766 |
| Immigrants | Belize | 0.3 /100 | #270 | Tragic $38,614 |
| Central Americans | 0.3 /100 | #271 | Tragic $38,560 |
Demographics Similar to Immigrants from Senegal by Per Capita Income
In terms of per capita income, the demographic groups most similar to Immigrants from Senegal are Immigrants from Panama ($41,853, a difference of 0.050%), Immigrants from Venezuela ($41,727, a difference of 0.25%), Immigrants from Bangladesh ($41,709, a difference of 0.29%), Ecuadorian ($41,958, a difference of 0.30%), and Sudanese ($41,695, a difference of 0.32%).
| Demographics | Rating | Rank | Per Capita Income |
| Whites/Caucasians | 15.9 /100 | #205 | Poor $42,180 |
| Ghanaians | 15.7 /100 | #206 | Poor $42,164 |
| Venezuelans | 14.4 /100 | #207 | Poor $42,074 |
| Panamanians | 13.9 /100 | #208 | Poor $42,035 |
| Immigrants | Sudan | 13.2 /100 | #209 | Poor $41,986 |
| Ecuadorians | 12.9 /100 | #210 | Poor $41,958 |
| Immigrants | Panama | 11.6 /100 | #211 | Poor $41,853 |
| Immigrants | Senegal | 11.3 /100 | #212 | Poor $41,830 |
| Immigrants | Venezuela | 10.2 /100 | #213 | Poor $41,727 |
| Immigrants | Bangladesh | 10.1 /100 | #214 | Poor $41,709 |
| Sudanese | 9.9 /100 | #215 | Tragic $41,695 |
| Tongans | 9.9 /100 | #216 | Tragic $41,693 |
| Guamanians/Chamorros | 9.7 /100 | #217 | Tragic $41,678 |
| Trinidadians and Tobagonians | 9.5 /100 | #218 | Tragic $41,655 |
| Puget Sound Salish | 8.1 /100 | #219 | Tragic $41,495 |