American vs Immigrants from Eritrea Female Disability
COMPARE
American
Immigrants from Eritrea
Female Disability
Female Disability Comparison
Americans
Immigrants from Eritrea
14.1%
FEMALE DISABILITY
0.0/ 100
METRIC RATING
320th/ 347
METRIC RANK
11.5%
FEMALE DISABILITY
99.7/ 100
METRIC RATING
76th/ 347
METRIC RANK
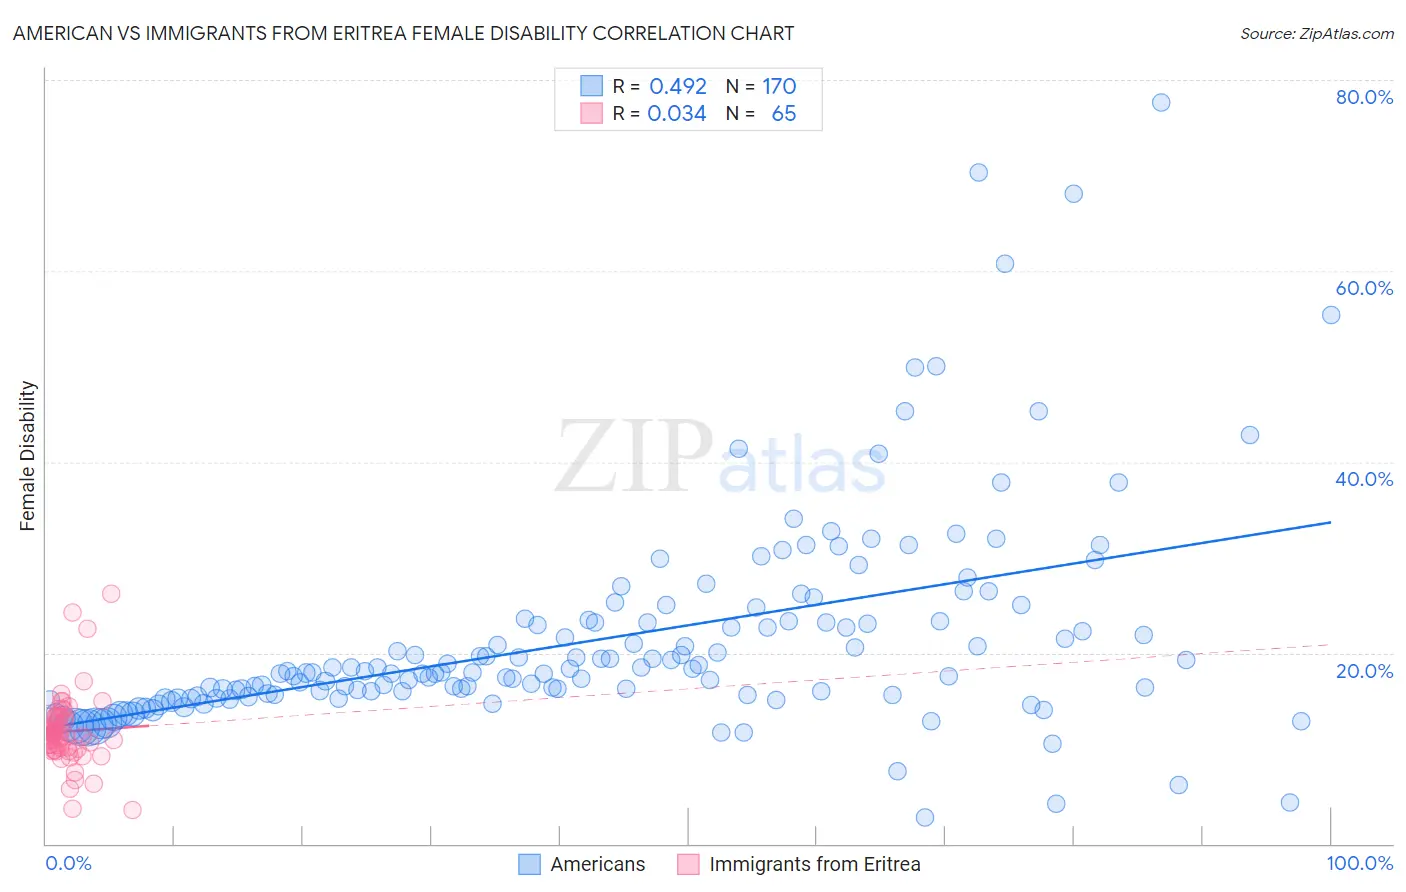
American vs Immigrants from Eritrea Female Disability Correlation Chart
The statistical analysis conducted on geographies consisting of 581,542,152 people shows a moderate positive correlation between the proportion of Americans and percentage of females with a disability in the United States with a correlation coefficient (R) of 0.492 and weighted average of 14.1%. Similarly, the statistical analysis conducted on geographies consisting of 104,854,458 people shows no correlation between the proportion of Immigrants from Eritrea and percentage of females with a disability in the United States with a correlation coefficient (R) of 0.034 and weighted average of 11.5%, a difference of 22.4%.
Female Disability Correlation Summary
| Measurement | American | Immigrants from Eritrea |
| Minimum | 2.7% | 3.5% |
| Maximum | 77.6% | 26.2% |
| Range | 74.9% | 22.7% |
| Mean | 21.4% | 11.7% |
| Median | 17.9% | 11.5% |
| Interquartile 25% (IQ1) | 15.4% | 9.9% |
| Interquartile 75% (IQ3) | 23.3% | 13.2% |
| Interquartile Range (IQR) | 7.9% | 3.3% |
| Standard Deviation (Sample) | 11.3% | 3.8% |
| Standard Deviation (Population) | 11.2% | 3.7% |
Similar Demographics by Female Disability
Demographics Similar to Americans by Female Disability
In terms of female disability, the demographic groups most similar to Americans are Potawatomi (14.1%, a difference of 0.14%), Pueblo (14.1%, a difference of 0.15%), Black/African American (14.1%, a difference of 0.31%), Native/Alaskan (14.1%, a difference of 0.33%), and Iroquois (14.0%, a difference of 0.34%).
| Demographics | Rating | Rank | Female Disability |
| Blackfeet | 0.0 /100 | #313 | Tragic 13.8% |
| Puget Sound Salish | 0.0 /100 | #314 | Tragic 13.8% |
| Alaskan Athabascans | 0.0 /100 | #315 | Tragic 13.9% |
| Spanish Americans | 0.0 /100 | #316 | Tragic 14.0% |
| Chippewa | 0.0 /100 | #317 | Tragic 14.0% |
| Paiute | 0.0 /100 | #318 | Tragic 14.0% |
| Iroquois | 0.0 /100 | #319 | Tragic 14.0% |
| Americans | 0.0 /100 | #320 | Tragic 14.1% |
| Potawatomi | 0.0 /100 | #321 | Tragic 14.1% |
| Pueblo | 0.0 /100 | #322 | Tragic 14.1% |
| Blacks/African Americans | 0.0 /100 | #323 | Tragic 14.1% |
| Natives/Alaskans | 0.0 /100 | #324 | Tragic 14.1% |
| Navajo | 0.0 /100 | #325 | Tragic 14.2% |
| Comanche | 0.0 /100 | #326 | Tragic 14.2% |
| Ottawa | 0.0 /100 | #327 | Tragic 14.2% |
Demographics Similar to Immigrants from Eritrea by Female Disability
In terms of female disability, the demographic groups most similar to Immigrants from Eritrea are Immigrants from Afghanistan (11.5%, a difference of 0.0%), Immigrants from South Africa (11.5%, a difference of 0.010%), Immigrants from Lebanon (11.5%, a difference of 0.030%), Sierra Leonean (11.5%, a difference of 0.030%), and Immigrants from Jordan (11.5%, a difference of 0.040%).
| Demographics | Rating | Rank | Female Disability |
| Colombians | 99.8 /100 | #69 | Exceptional 11.5% |
| Immigrants | Chile | 99.8 /100 | #70 | Exceptional 11.5% |
| Immigrants | Ireland | 99.8 /100 | #71 | Exceptional 11.5% |
| Chileans | 99.8 /100 | #72 | Exceptional 11.5% |
| Immigrants | Switzerland | 99.8 /100 | #73 | Exceptional 11.5% |
| Bhutanese | 99.8 /100 | #74 | Exceptional 11.5% |
| Immigrants | Lebanon | 99.7 /100 | #75 | Exceptional 11.5% |
| Immigrants | Eritrea | 99.7 /100 | #76 | Exceptional 11.5% |
| Immigrants | Afghanistan | 99.7 /100 | #77 | Exceptional 11.5% |
| Immigrants | South Africa | 99.7 /100 | #78 | Exceptional 11.5% |
| Sierra Leoneans | 99.7 /100 | #79 | Exceptional 11.5% |
| Immigrants | Jordan | 99.7 /100 | #80 | Exceptional 11.5% |
| Eastern Europeans | 99.7 /100 | #81 | Exceptional 11.5% |
| Luxembourgers | 99.6 /100 | #82 | Exceptional 11.6% |
| Immigrants | Serbia | 99.6 /100 | #83 | Exceptional 11.6% |