Paiute vs Immigrants from Eritrea Per Capita Income
COMPARE
Paiute
Immigrants from Eritrea
Per Capita Income
Per Capita Income Comparison
Paiute
Immigrants from Eritrea
$37,066
PER CAPITA INCOME
0.1/ 100
METRIC RATING
303rd/ 347
METRIC RANK
$44,509
PER CAPITA INCOME
72.1/ 100
METRIC RATING
150th/ 347
METRIC RANK
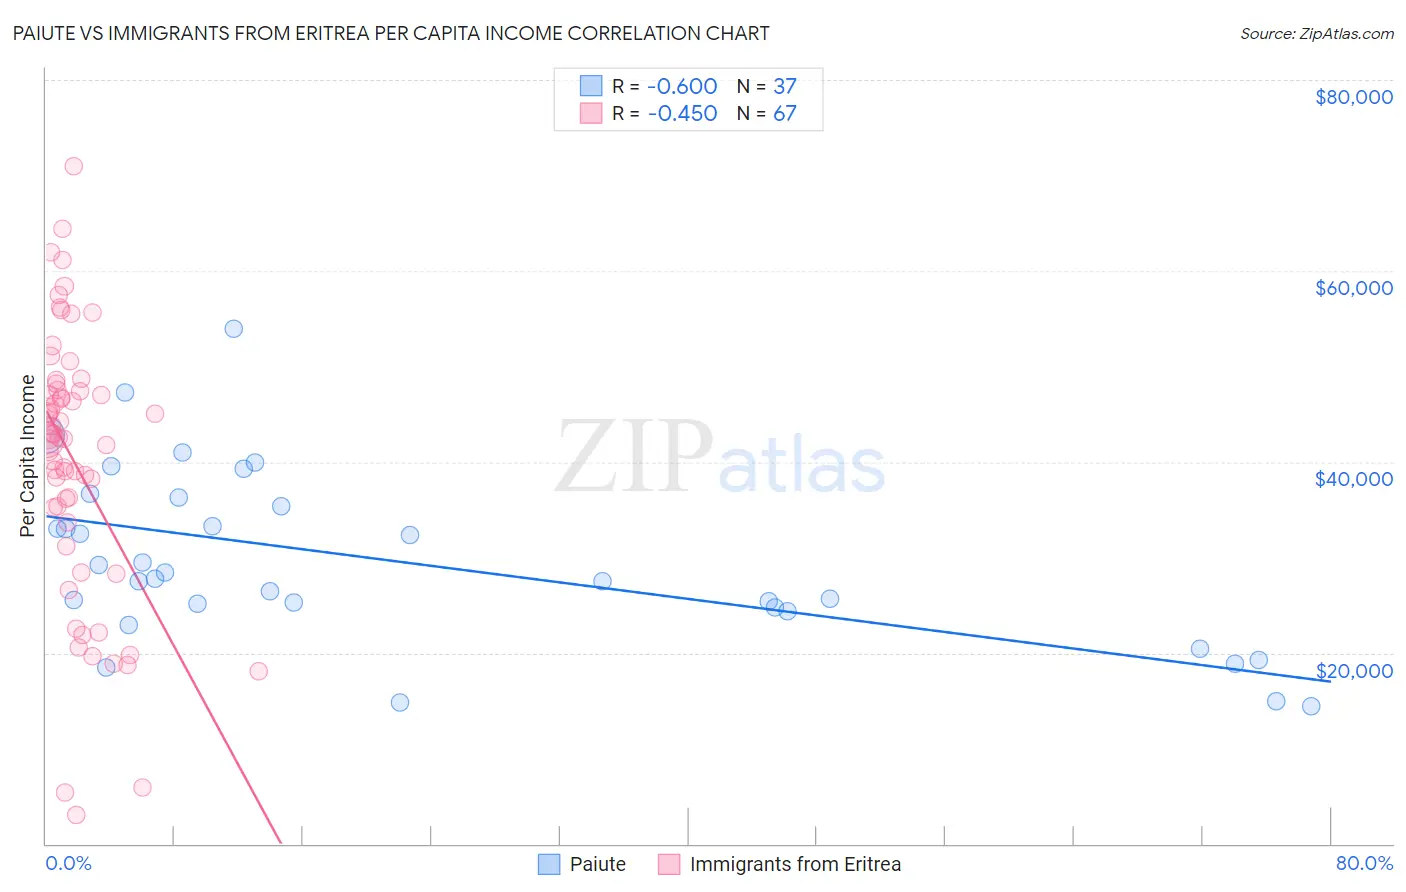
Paiute vs Immigrants from Eritrea Per Capita Income Correlation Chart
The statistical analysis conducted on geographies consisting of 58,406,657 people shows a substantial negative correlation between the proportion of Paiute and per capita income in the United States with a correlation coefficient (R) of -0.600 and weighted average of $37,066. Similarly, the statistical analysis conducted on geographies consisting of 104,855,166 people shows a moderate negative correlation between the proportion of Immigrants from Eritrea and per capita income in the United States with a correlation coefficient (R) of -0.450 and weighted average of $44,509, a difference of 20.1%.
Per Capita Income Correlation Summary
| Measurement | Paiute | Immigrants from Eritrea |
| Minimum | $14,446 | $3,067 |
| Maximum | $53,939 | $70,972 |
| Range | $39,493 | $67,905 |
| Mean | $29,535 | $39,964 |
| Median | $27,776 | $42,389 |
| Interquartile 25% (IQ1) | $24,580 | $33,601 |
| Interquartile 75% (IQ3) | $35,820 | $47,507 |
| Interquartile Range (IQR) | $11,240 | $13,906 |
| Standard Deviation (Sample) | $9,120 | $14,141 |
| Standard Deviation (Population) | $8,996 | $14,035 |
Similar Demographics by Per Capita Income
Demographics Similar to Paiute by Per Capita Income
In terms of per capita income, the demographic groups most similar to Paiute are Shoshone ($37,072, a difference of 0.020%), Honduran ($37,031, a difference of 0.090%), Ottawa ($37,101, a difference of 0.10%), Inupiat ($36,999, a difference of 0.18%), and Immigrants from Bahamas ($37,193, a difference of 0.34%).
| Demographics | Rating | Rank | Per Capita Income |
| Indonesians | 0.1 /100 | #296 | Tragic $37,300 |
| Haitians | 0.1 /100 | #297 | Tragic $37,289 |
| Immigrants | Caribbean | 0.1 /100 | #298 | Tragic $37,254 |
| Cherokee | 0.1 /100 | #299 | Tragic $37,203 |
| Immigrants | Bahamas | 0.1 /100 | #300 | Tragic $37,193 |
| Ottawa | 0.1 /100 | #301 | Tragic $37,101 |
| Shoshone | 0.1 /100 | #302 | Tragic $37,072 |
| Paiute | 0.1 /100 | #303 | Tragic $37,066 |
| Hondurans | 0.1 /100 | #304 | Tragic $37,031 |
| Inupiat | 0.1 /100 | #305 | Tragic $36,999 |
| Immigrants | Haiti | 0.0 /100 | #306 | Tragic $36,849 |
| Immigrants | Latin America | 0.0 /100 | #307 | Tragic $36,823 |
| Fijians | 0.0 /100 | #308 | Tragic $36,690 |
| Immigrants | Honduras | 0.0 /100 | #309 | Tragic $36,665 |
| Ute | 0.0 /100 | #310 | Tragic $36,651 |
Demographics Similar to Immigrants from Eritrea by Per Capita Income
In terms of per capita income, the demographic groups most similar to Immigrants from Eritrea are Korean ($44,522, a difference of 0.030%), Norwegian ($44,480, a difference of 0.060%), Peruvian ($44,479, a difference of 0.070%), Immigrants from Armenia ($44,552, a difference of 0.10%), and Scottish ($44,440, a difference of 0.16%).
| Demographics | Rating | Rank | Per Capita Income |
| Immigrants | Uganda | 82.5 /100 | #143 | Excellent $45,043 |
| Icelanders | 81.6 /100 | #144 | Excellent $44,987 |
| Immigrants | Afghanistan | 78.0 /100 | #145 | Good $44,790 |
| Irish | 75.8 /100 | #146 | Good $44,679 |
| Czechs | 74.1 /100 | #147 | Good $44,595 |
| Immigrants | Armenia | 73.1 /100 | #148 | Good $44,552 |
| Koreans | 72.5 /100 | #149 | Good $44,522 |
| Immigrants | Eritrea | 72.1 /100 | #150 | Good $44,509 |
| Norwegians | 71.5 /100 | #151 | Good $44,480 |
| Peruvians | 71.5 /100 | #152 | Good $44,479 |
| Scottish | 70.6 /100 | #153 | Good $44,440 |
| Portuguese | 68.7 /100 | #154 | Good $44,362 |
| Uruguayans | 67.6 /100 | #155 | Good $44,318 |
| Slovaks | 65.4 /100 | #156 | Good $44,229 |
| South American Indians | 64.8 /100 | #157 | Good $44,206 |