Osage vs Immigrants from Eritrea Per Capita Income
COMPARE
Osage
Immigrants from Eritrea
Per Capita Income
Per Capita Income Comparison
Osage
Immigrants from Eritrea
$39,568
PER CAPITA INCOME
1.0/ 100
METRIC RATING
253rd/ 347
METRIC RANK
$44,509
PER CAPITA INCOME
72.1/ 100
METRIC RATING
150th/ 347
METRIC RANK
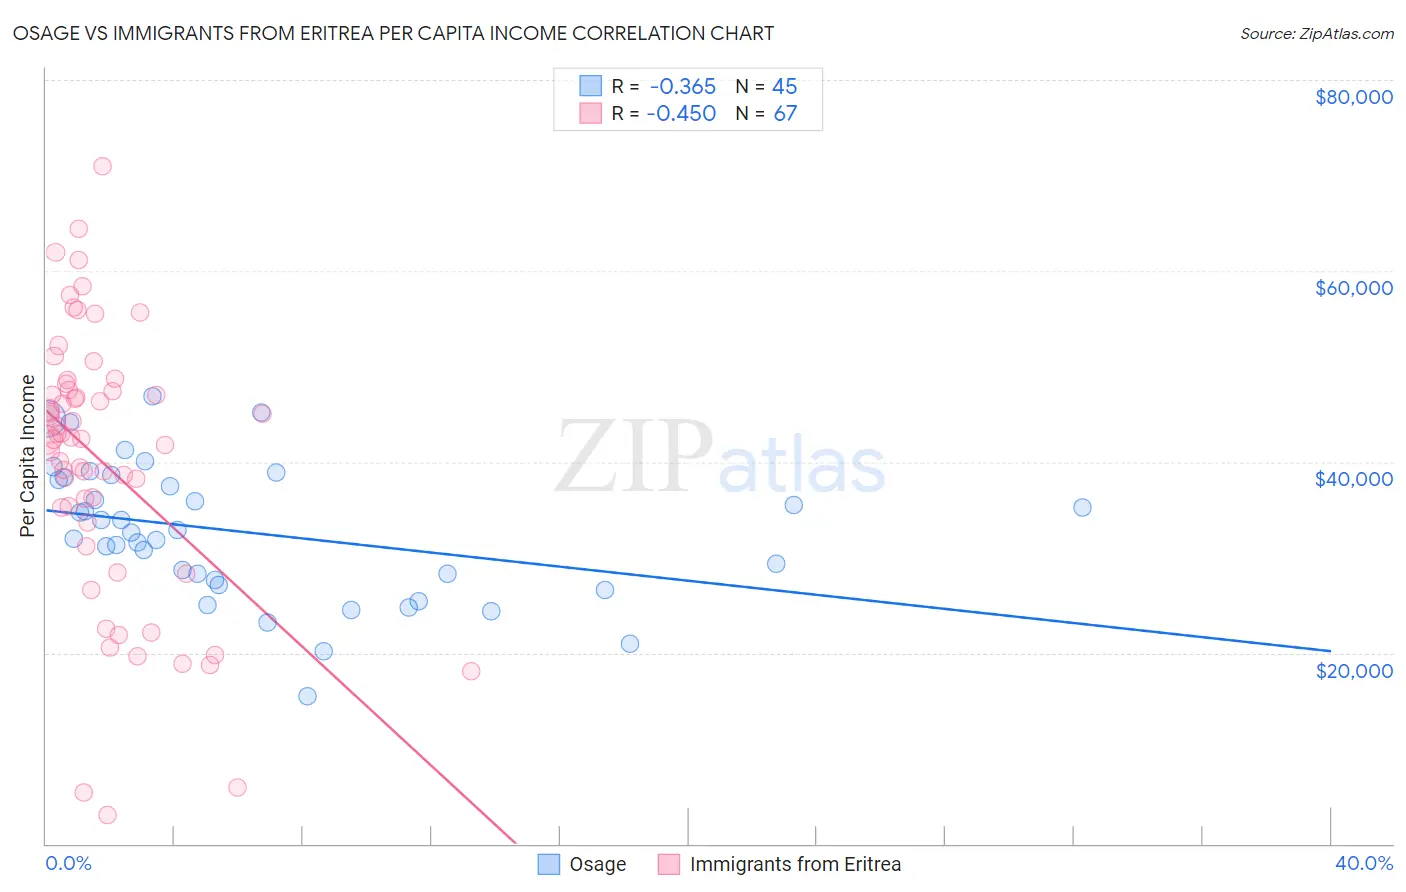
Osage vs Immigrants from Eritrea Per Capita Income Correlation Chart
The statistical analysis conducted on geographies consisting of 91,808,929 people shows a mild negative correlation between the proportion of Osage and per capita income in the United States with a correlation coefficient (R) of -0.365 and weighted average of $39,568. Similarly, the statistical analysis conducted on geographies consisting of 104,855,166 people shows a moderate negative correlation between the proportion of Immigrants from Eritrea and per capita income in the United States with a correlation coefficient (R) of -0.450 and weighted average of $44,509, a difference of 12.5%.
Per Capita Income Correlation Summary
| Measurement | Osage | Immigrants from Eritrea |
| Minimum | $15,396 | $3,067 |
| Maximum | $46,906 | $70,972 |
| Range | $31,510 | $67,905 |
| Mean | $32,578 | $39,964 |
| Median | $32,608 | $42,389 |
| Interquartile 25% (IQ1) | $27,395 | $33,601 |
| Interquartile 75% (IQ3) | $38,257 | $47,507 |
| Interquartile Range (IQR) | $10,862 | $13,906 |
| Standard Deviation (Sample) | $7,093 | $14,141 |
| Standard Deviation (Population) | $7,014 | $14,035 |
Similar Demographics by Per Capita Income
Demographics Similar to Osage by Per Capita Income
In terms of per capita income, the demographic groups most similar to Osage are Alaska Native ($39,558, a difference of 0.020%), Immigrants from the Azores ($39,608, a difference of 0.10%), Immigrants from Middle Africa ($39,529, a difference of 0.10%), Hawaiian ($39,403, a difference of 0.42%), and Nicaraguan ($39,372, a difference of 0.50%).
| Demographics | Rating | Rank | Per Capita Income |
| Cree | 1.7 /100 | #246 | Tragic $40,056 |
| Immigrants | Somalia | 1.6 /100 | #247 | Tragic $39,974 |
| Cape Verdeans | 1.5 /100 | #248 | Tragic $39,935 |
| Japanese | 1.4 /100 | #249 | Tragic $39,870 |
| Immigrants | Burma/Myanmar | 1.3 /100 | #250 | Tragic $39,827 |
| Samoans | 1.3 /100 | #251 | Tragic $39,826 |
| Immigrants | Azores | 1.0 /100 | #252 | Tragic $39,608 |
| Osage | 1.0 /100 | #253 | Tragic $39,568 |
| Alaska Natives | 1.0 /100 | #254 | Tragic $39,558 |
| Immigrants | Middle Africa | 1.0 /100 | #255 | Tragic $39,529 |
| Hawaiians | 0.8 /100 | #256 | Tragic $39,403 |
| Nicaraguans | 0.8 /100 | #257 | Tragic $39,372 |
| Jamaicans | 0.7 /100 | #258 | Tragic $39,231 |
| Malaysians | 0.7 /100 | #259 | Tragic $39,194 |
| Alaskan Athabascans | 0.6 /100 | #260 | Tragic $39,163 |
Demographics Similar to Immigrants from Eritrea by Per Capita Income
In terms of per capita income, the demographic groups most similar to Immigrants from Eritrea are Korean ($44,522, a difference of 0.030%), Norwegian ($44,480, a difference of 0.060%), Peruvian ($44,479, a difference of 0.070%), Immigrants from Armenia ($44,552, a difference of 0.10%), and Scottish ($44,440, a difference of 0.16%).
| Demographics | Rating | Rank | Per Capita Income |
| Immigrants | Uganda | 82.5 /100 | #143 | Excellent $45,043 |
| Icelanders | 81.6 /100 | #144 | Excellent $44,987 |
| Immigrants | Afghanistan | 78.0 /100 | #145 | Good $44,790 |
| Irish | 75.8 /100 | #146 | Good $44,679 |
| Czechs | 74.1 /100 | #147 | Good $44,595 |
| Immigrants | Armenia | 73.1 /100 | #148 | Good $44,552 |
| Koreans | 72.5 /100 | #149 | Good $44,522 |
| Immigrants | Eritrea | 72.1 /100 | #150 | Good $44,509 |
| Norwegians | 71.5 /100 | #151 | Good $44,480 |
| Peruvians | 71.5 /100 | #152 | Good $44,479 |
| Scottish | 70.6 /100 | #153 | Good $44,440 |
| Portuguese | 68.7 /100 | #154 | Good $44,362 |
| Uruguayans | 67.6 /100 | #155 | Good $44,318 |
| Slovaks | 65.4 /100 | #156 | Good $44,229 |
| South American Indians | 64.8 /100 | #157 | Good $44,206 |