Cheyenne vs Immigrants from Eritrea Per Capita Income
COMPARE
Cheyenne
Immigrants from Eritrea
Per Capita Income
Per Capita Income Comparison
Cheyenne
Immigrants from Eritrea
$35,276
PER CAPITA INCOME
0.0/ 100
METRIC RATING
323rd/ 347
METRIC RANK
$44,509
PER CAPITA INCOME
72.1/ 100
METRIC RATING
150th/ 347
METRIC RANK
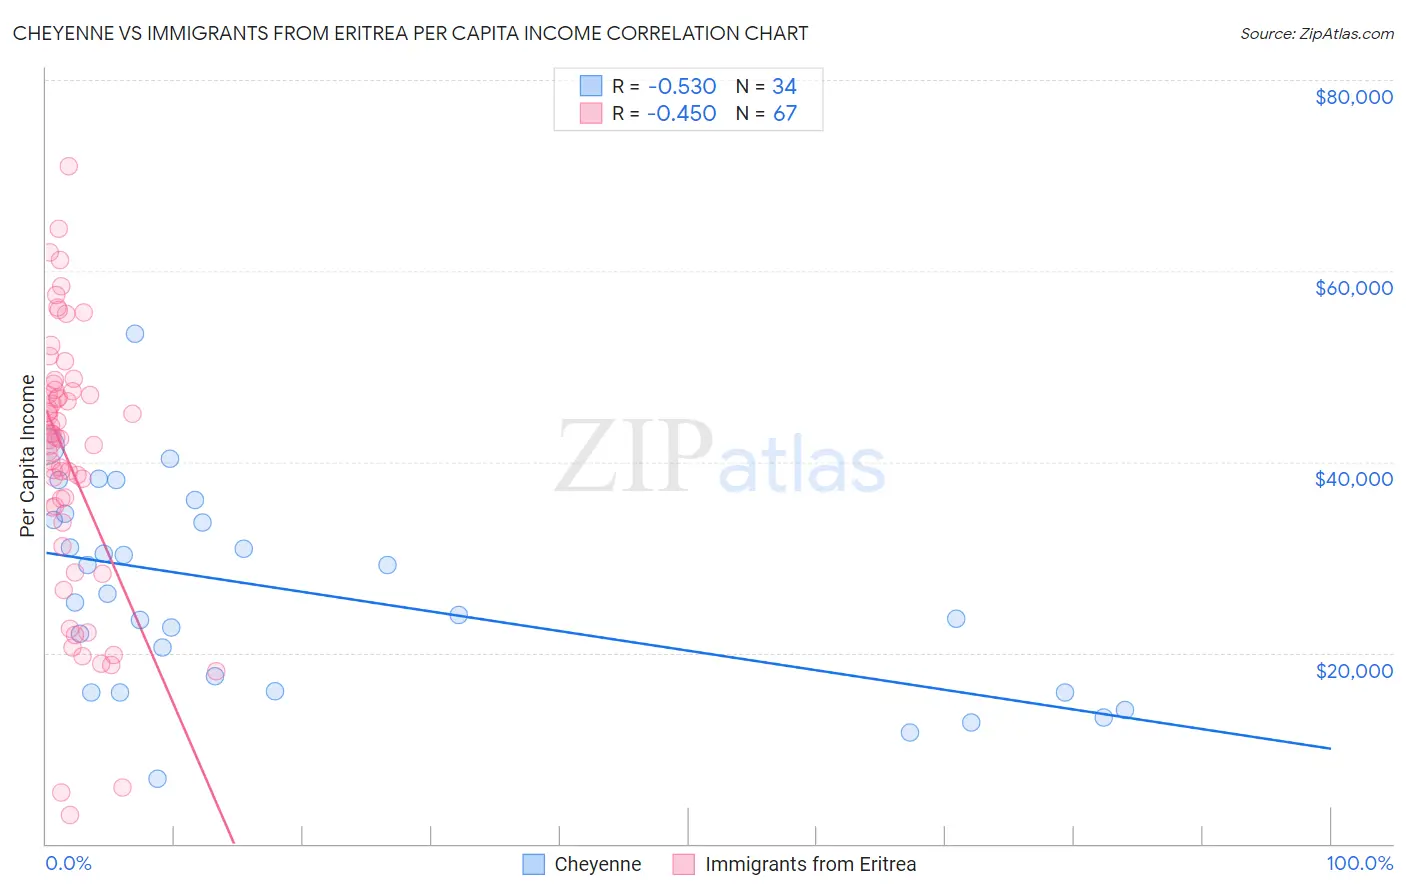
Cheyenne vs Immigrants from Eritrea Per Capita Income Correlation Chart
The statistical analysis conducted on geographies consisting of 80,722,590 people shows a substantial negative correlation between the proportion of Cheyenne and per capita income in the United States with a correlation coefficient (R) of -0.530 and weighted average of $35,276. Similarly, the statistical analysis conducted on geographies consisting of 104,855,166 people shows a moderate negative correlation between the proportion of Immigrants from Eritrea and per capita income in the United States with a correlation coefficient (R) of -0.450 and weighted average of $44,509, a difference of 26.2%.
Per Capita Income Correlation Summary
| Measurement | Cheyenne | Immigrants from Eritrea |
| Minimum | $6,772 | $3,067 |
| Maximum | $53,471 | $70,972 |
| Range | $46,699 | $67,905 |
| Mean | $26,352 | $39,964 |
| Median | $25,776 | $42,389 |
| Interquartile 25% (IQ1) | $15,918 | $33,601 |
| Interquartile 75% (IQ3) | $33,955 | $47,507 |
| Interquartile Range (IQR) | $18,037 | $13,906 |
| Standard Deviation (Sample) | $10,544 | $14,141 |
| Standard Deviation (Population) | $10,388 | $14,035 |
Similar Demographics by Per Capita Income
Demographics Similar to Cheyenne by Per Capita Income
In terms of per capita income, the demographic groups most similar to Cheyenne are Kiowa ($35,102, a difference of 0.50%), Creek ($35,546, a difference of 0.76%), Black/African American ($35,564, a difference of 0.82%), Immigrants from Central America ($34,974, a difference of 0.87%), and Immigrants from Cuba ($34,910, a difference of 1.1%).
| Demographics | Rating | Rank | Per Capita Income |
| Choctaw | 0.0 /100 | #316 | Tragic $35,999 |
| Dutch West Indians | 0.0 /100 | #317 | Tragic $35,922 |
| Bangladeshis | 0.0 /100 | #318 | Tragic $35,897 |
| Immigrants | Congo | 0.0 /100 | #319 | Tragic $35,720 |
| Hispanics or Latinos | 0.0 /100 | #320 | Tragic $35,688 |
| Blacks/African Americans | 0.0 /100 | #321 | Tragic $35,564 |
| Creek | 0.0 /100 | #322 | Tragic $35,546 |
| Cheyenne | 0.0 /100 | #323 | Tragic $35,276 |
| Kiowa | 0.0 /100 | #324 | Tragic $35,102 |
| Immigrants | Central America | 0.0 /100 | #325 | Tragic $34,974 |
| Immigrants | Cuba | 0.0 /100 | #326 | Tragic $34,910 |
| Apache | 0.0 /100 | #327 | Tragic $34,886 |
| Menominee | 0.0 /100 | #328 | Tragic $34,578 |
| Mexicans | 0.0 /100 | #329 | Tragic $34,559 |
| Spanish American Indians | 0.0 /100 | #330 | Tragic $34,195 |
Demographics Similar to Immigrants from Eritrea by Per Capita Income
In terms of per capita income, the demographic groups most similar to Immigrants from Eritrea are Korean ($44,522, a difference of 0.030%), Norwegian ($44,480, a difference of 0.060%), Peruvian ($44,479, a difference of 0.070%), Immigrants from Armenia ($44,552, a difference of 0.10%), and Scottish ($44,440, a difference of 0.16%).
| Demographics | Rating | Rank | Per Capita Income |
| Immigrants | Uganda | 82.5 /100 | #143 | Excellent $45,043 |
| Icelanders | 81.6 /100 | #144 | Excellent $44,987 |
| Immigrants | Afghanistan | 78.0 /100 | #145 | Good $44,790 |
| Irish | 75.8 /100 | #146 | Good $44,679 |
| Czechs | 74.1 /100 | #147 | Good $44,595 |
| Immigrants | Armenia | 73.1 /100 | #148 | Good $44,552 |
| Koreans | 72.5 /100 | #149 | Good $44,522 |
| Immigrants | Eritrea | 72.1 /100 | #150 | Good $44,509 |
| Norwegians | 71.5 /100 | #151 | Good $44,480 |
| Peruvians | 71.5 /100 | #152 | Good $44,479 |
| Scottish | 70.6 /100 | #153 | Good $44,440 |
| Portuguese | 68.7 /100 | #154 | Good $44,362 |
| Uruguayans | 67.6 /100 | #155 | Good $44,318 |
| Slovaks | 65.4 /100 | #156 | Good $44,229 |
| South American Indians | 64.8 /100 | #157 | Good $44,206 |