Israeli vs Immigrants from Eritrea Per Capita Income
COMPARE
Israeli
Immigrants from Eritrea
Per Capita Income
Per Capita Income Comparison
Israelis
Immigrants from Eritrea
$52,596
PER CAPITA INCOME
100.0/ 100
METRIC RATING
29th/ 347
METRIC RANK
$44,509
PER CAPITA INCOME
72.1/ 100
METRIC RATING
150th/ 347
METRIC RANK
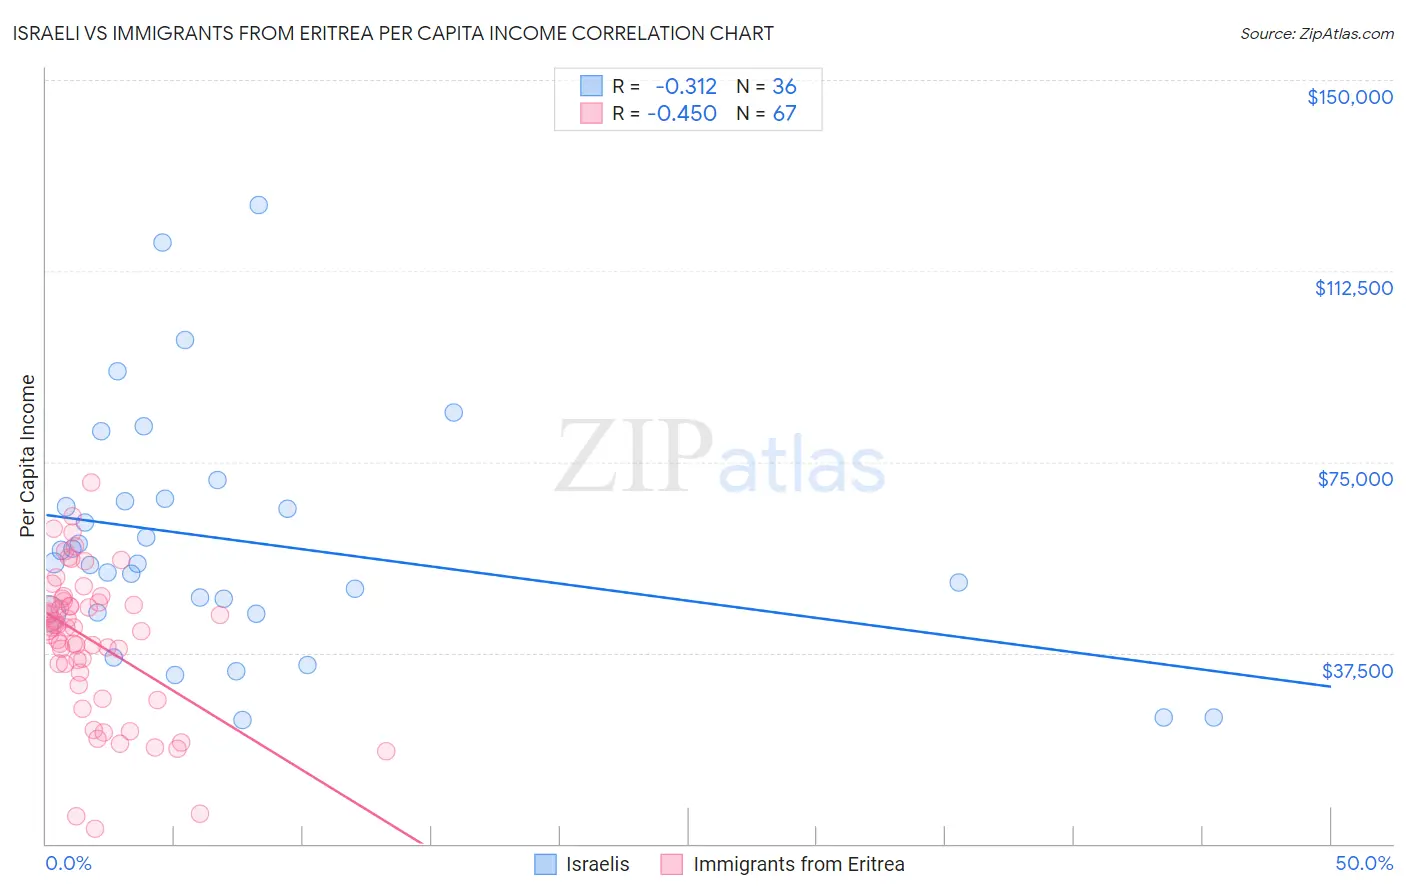
Israeli vs Immigrants from Eritrea Per Capita Income Correlation Chart
The statistical analysis conducted on geographies consisting of 211,224,844 people shows a mild negative correlation between the proportion of Israelis and per capita income in the United States with a correlation coefficient (R) of -0.312 and weighted average of $52,596. Similarly, the statistical analysis conducted on geographies consisting of 104,855,166 people shows a moderate negative correlation between the proportion of Immigrants from Eritrea and per capita income in the United States with a correlation coefficient (R) of -0.450 and weighted average of $44,509, a difference of 18.2%.
Per Capita Income Correlation Summary
| Measurement | Israeli | Immigrants from Eritrea |
| Minimum | $24,292 | $3,067 |
| Maximum | $125,412 | $70,972 |
| Range | $101,120 | $67,905 |
| Mean | $59,345 | $39,964 |
| Median | $55,064 | $42,389 |
| Interquartile 25% (IQ1) | $45,317 | $33,601 |
| Interquartile 75% (IQ3) | $67,525 | $47,507 |
| Interquartile Range (IQR) | $22,208 | $13,906 |
| Standard Deviation (Sample) | $23,722 | $14,141 |
| Standard Deviation (Population) | $23,390 | $14,035 |
Similar Demographics by Per Capita Income
Demographics Similar to Israelis by Per Capita Income
In terms of per capita income, the demographic groups most similar to Israelis are Latvian ($52,649, a difference of 0.10%), Immigrants from South Central Asia ($52,660, a difference of 0.12%), Immigrants from Austria ($52,503, a difference of 0.18%), Turkish ($52,391, a difference of 0.39%), and Immigrants from Norway ($52,217, a difference of 0.73%).
| Demographics | Rating | Rank | Per Capita Income |
| Indians (Asian) | 100.0 /100 | #22 | Exceptional $53,874 |
| Immigrants | Eastern Asia | 100.0 /100 | #23 | Exceptional $53,806 |
| Immigrants | Denmark | 100.0 /100 | #24 | Exceptional $53,799 |
| Immigrants | Japan | 100.0 /100 | #25 | Exceptional $53,359 |
| Russians | 100.0 /100 | #26 | Exceptional $53,154 |
| Immigrants | South Central Asia | 100.0 /100 | #27 | Exceptional $52,660 |
| Latvians | 100.0 /100 | #28 | Exceptional $52,649 |
| Israelis | 100.0 /100 | #29 | Exceptional $52,596 |
| Immigrants | Austria | 100.0 /100 | #30 | Exceptional $52,503 |
| Turks | 100.0 /100 | #31 | Exceptional $52,391 |
| Immigrants | Norway | 100.0 /100 | #32 | Exceptional $52,217 |
| Australians | 100.0 /100 | #33 | Exceptional $52,074 |
| Immigrants | Russia | 100.0 /100 | #34 | Exceptional $52,044 |
| Burmese | 100.0 /100 | #35 | Exceptional $52,005 |
| Immigrants | Greece | 100.0 /100 | #36 | Exceptional $51,891 |
Demographics Similar to Immigrants from Eritrea by Per Capita Income
In terms of per capita income, the demographic groups most similar to Immigrants from Eritrea are Korean ($44,522, a difference of 0.030%), Norwegian ($44,480, a difference of 0.060%), Peruvian ($44,479, a difference of 0.070%), Immigrants from Armenia ($44,552, a difference of 0.10%), and Scottish ($44,440, a difference of 0.16%).
| Demographics | Rating | Rank | Per Capita Income |
| Immigrants | Uganda | 82.5 /100 | #143 | Excellent $45,043 |
| Icelanders | 81.6 /100 | #144 | Excellent $44,987 |
| Immigrants | Afghanistan | 78.0 /100 | #145 | Good $44,790 |
| Irish | 75.8 /100 | #146 | Good $44,679 |
| Czechs | 74.1 /100 | #147 | Good $44,595 |
| Immigrants | Armenia | 73.1 /100 | #148 | Good $44,552 |
| Koreans | 72.5 /100 | #149 | Good $44,522 |
| Immigrants | Eritrea | 72.1 /100 | #150 | Good $44,509 |
| Norwegians | 71.5 /100 | #151 | Good $44,480 |
| Peruvians | 71.5 /100 | #152 | Good $44,479 |
| Scottish | 70.6 /100 | #153 | Good $44,440 |
| Portuguese | 68.7 /100 | #154 | Good $44,362 |
| Uruguayans | 67.6 /100 | #155 | Good $44,318 |
| Slovaks | 65.4 /100 | #156 | Good $44,229 |
| South American Indians | 64.8 /100 | #157 | Good $44,206 |