American vs Thai Per Capita Income
COMPARE
American
Thai
Per Capita Income
Per Capita Income Comparison
Americans
Thais
$39,039
PER CAPITA INCOME
0.6/ 100
METRIC RATING
264th/ 347
METRIC RANK
$54,307
PER CAPITA INCOME
100.0/ 100
METRIC RATING
18th/ 347
METRIC RANK
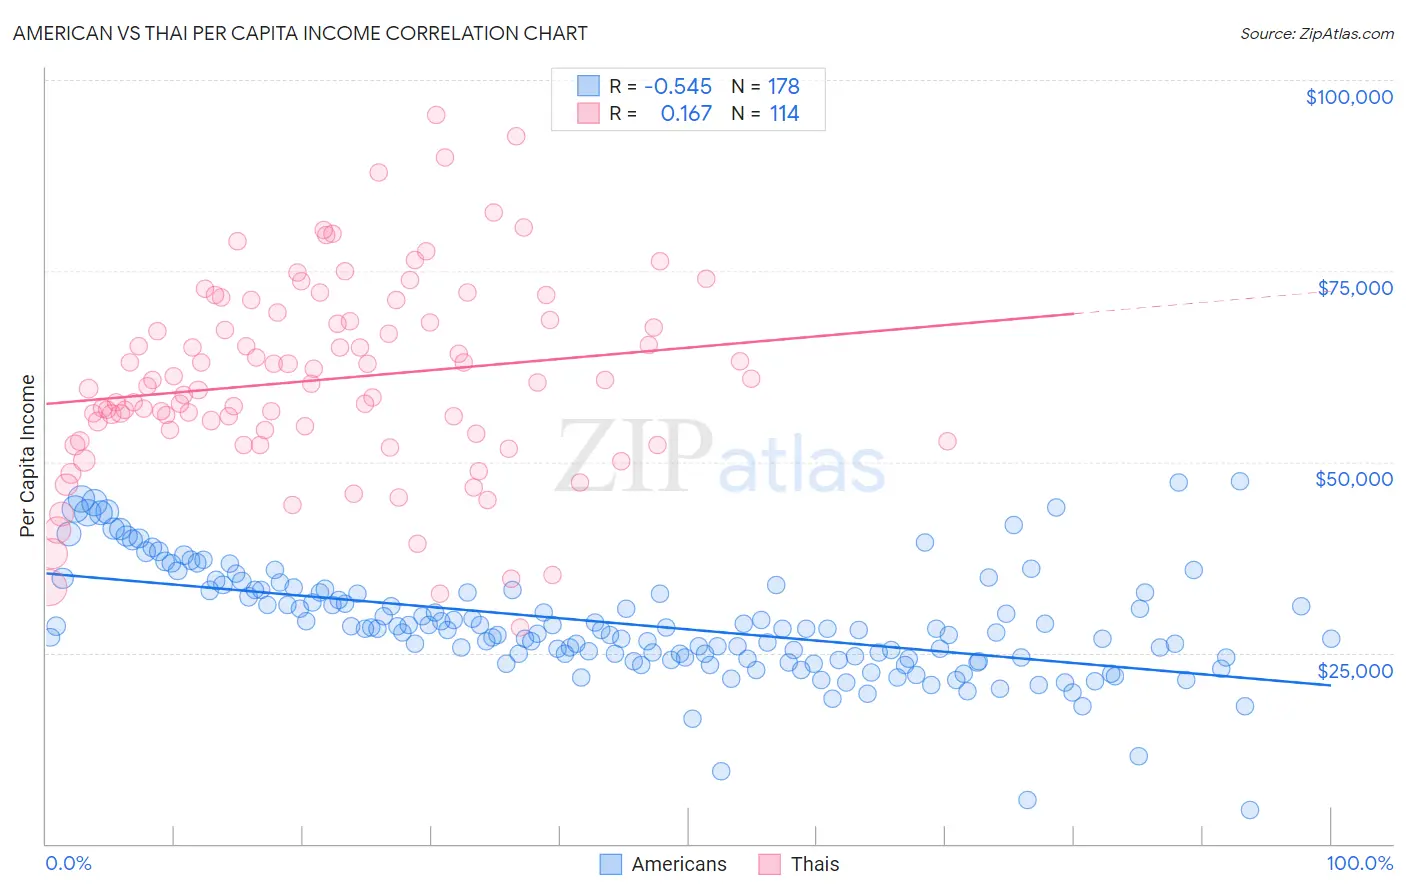
American vs Thai Per Capita Income Correlation Chart
The statistical analysis conducted on geographies consisting of 582,039,940 people shows a substantial negative correlation between the proportion of Americans and per capita income in the United States with a correlation coefficient (R) of -0.545 and weighted average of $39,039. Similarly, the statistical analysis conducted on geographies consisting of 475,818,965 people shows a poor positive correlation between the proportion of Thais and per capita income in the United States with a correlation coefficient (R) of 0.167 and weighted average of $54,307, a difference of 39.1%.
Per Capita Income Correlation Summary
| Measurement | American | Thai |
| Minimum | $4,486 | $28,291 |
| Maximum | $47,414 | $95,364 |
| Range | $42,928 | $67,073 |
| Mean | $28,778 | $60,793 |
| Median | $28,107 | $60,110 |
| Interquartile 25% (IQ1) | $24,336 | $53,762 |
| Interquartile 75% (IQ3) | $33,158 | $68,395 |
| Interquartile Range (IQR) | $8,822 | $14,633 |
| Standard Deviation (Sample) | $7,186 | $12,693 |
| Standard Deviation (Population) | $7,166 | $12,637 |
Similar Demographics by Per Capita Income
Demographics Similar to Americans by Per Capita Income
In terms of per capita income, the demographic groups most similar to Americans are Spanish American ($39,012, a difference of 0.070%), Belizean ($39,097, a difference of 0.15%), Iroquois ($39,104, a difference of 0.16%), Marshallese ($39,108, a difference of 0.17%), and Alaskan Athabascan ($39,163, a difference of 0.32%).
| Demographics | Rating | Rank | Per Capita Income |
| Nicaraguans | 0.8 /100 | #257 | Tragic $39,372 |
| Jamaicans | 0.7 /100 | #258 | Tragic $39,231 |
| Malaysians | 0.7 /100 | #259 | Tragic $39,194 |
| Alaskan Athabascans | 0.6 /100 | #260 | Tragic $39,163 |
| Marshallese | 0.6 /100 | #261 | Tragic $39,108 |
| Iroquois | 0.6 /100 | #262 | Tragic $39,104 |
| Belizeans | 0.6 /100 | #263 | Tragic $39,097 |
| Americans | 0.6 /100 | #264 | Tragic $39,039 |
| Spanish Americans | 0.5 /100 | #265 | Tragic $39,012 |
| Salvadorans | 0.5 /100 | #266 | Tragic $38,858 |
| Immigrants | Zaire | 0.4 /100 | #267 | Tragic $38,848 |
| Liberians | 0.4 /100 | #268 | Tragic $38,780 |
| Immigrants | Jamaica | 0.4 /100 | #269 | Tragic $38,766 |
| Immigrants | Belize | 0.3 /100 | #270 | Tragic $38,614 |
| Central Americans | 0.3 /100 | #271 | Tragic $38,560 |
Demographics Similar to Thais by Per Capita Income
In terms of per capita income, the demographic groups most similar to Thais are Immigrants from China ($54,264, a difference of 0.080%), Soviet Union ($54,202, a difference of 0.19%), Immigrants from Northern Europe ($54,159, a difference of 0.27%), Immigrants from France ($54,557, a difference of 0.46%), and Indian (Asian) ($53,874, a difference of 0.80%).
| Demographics | Rating | Rank | Per Capita Income |
| Eastern Europeans | 100.0 /100 | #11 | Exceptional $55,780 |
| Immigrants | Sweden | 100.0 /100 | #12 | Exceptional $55,582 |
| Immigrants | India | 100.0 /100 | #13 | Exceptional $55,268 |
| Immigrants | Belgium | 100.0 /100 | #14 | Exceptional $55,082 |
| Cypriots | 100.0 /100 | #15 | Exceptional $54,899 |
| Immigrants | Switzerland | 100.0 /100 | #16 | Exceptional $54,866 |
| Immigrants | France | 100.0 /100 | #17 | Exceptional $54,557 |
| Thais | 100.0 /100 | #18 | Exceptional $54,307 |
| Immigrants | China | 100.0 /100 | #19 | Exceptional $54,264 |
| Soviet Union | 100.0 /100 | #20 | Exceptional $54,202 |
| Immigrants | Northern Europe | 100.0 /100 | #21 | Exceptional $54,159 |
| Indians (Asian) | 100.0 /100 | #22 | Exceptional $53,874 |
| Immigrants | Eastern Asia | 100.0 /100 | #23 | Exceptional $53,806 |
| Immigrants | Denmark | 100.0 /100 | #24 | Exceptional $53,799 |
| Immigrants | Japan | 100.0 /100 | #25 | Exceptional $53,359 |