Alsatian vs Shoshone Wage/Income Gap
COMPARE
Alsatian
Shoshone
Wage/Income Gap
Wage/Income Gap Comparison
Alsatians
Shoshone
24.7%
WAGE/INCOME GAP
93.2/ 100
METRIC RATING
130th/ 347
METRIC RANK
25.4%
WAGE/INCOME GAP
69.0/ 100
METRIC RATING
162nd/ 347
METRIC RANK
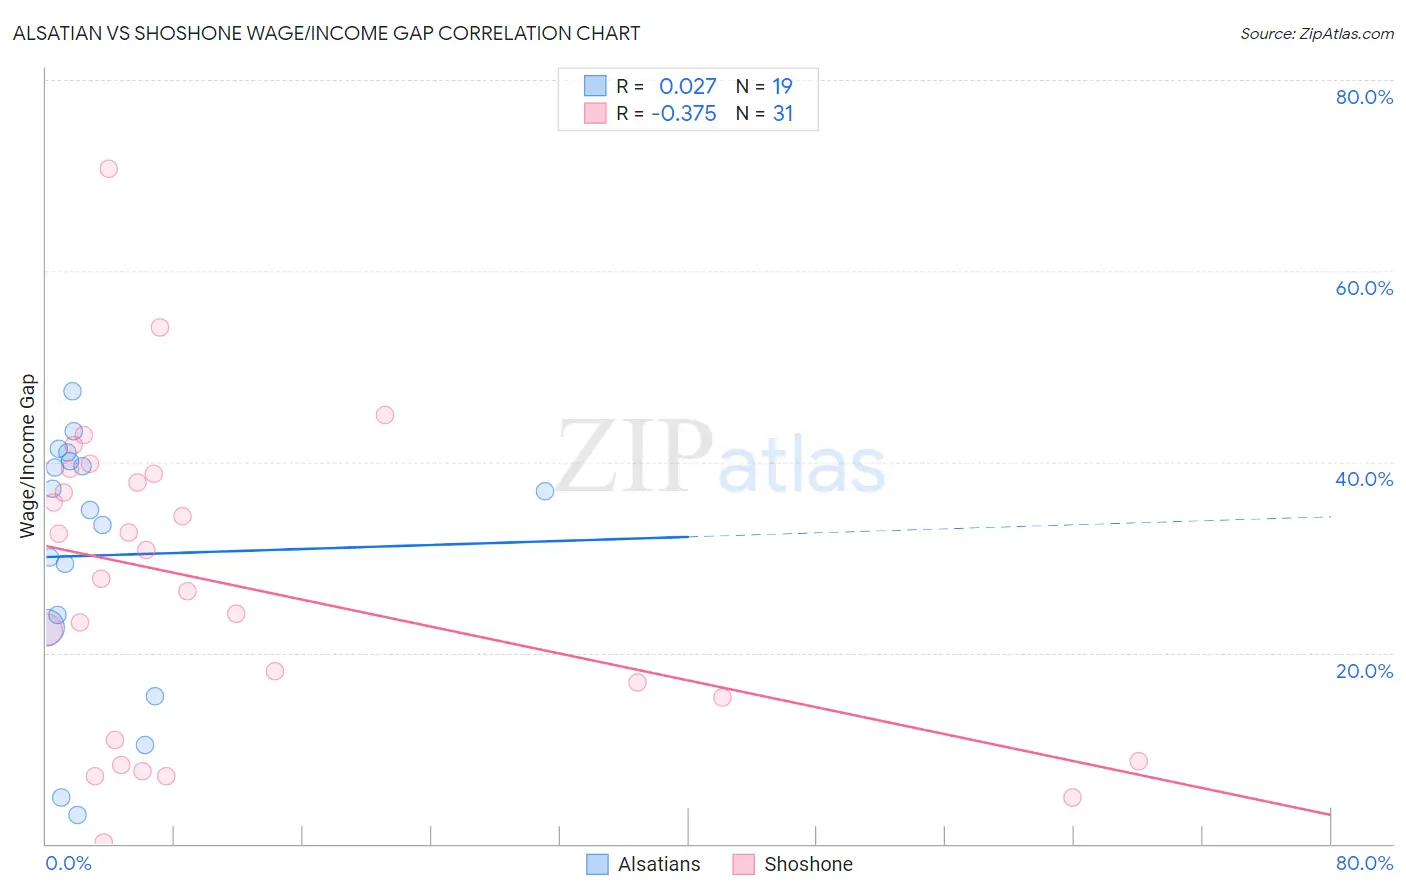
Alsatian vs Shoshone Wage/Income Gap Correlation Chart
The statistical analysis conducted on geographies consisting of 82,663,210 people shows no correlation between the proportion of Alsatians and wage/income gap percentage in the United States with a correlation coefficient (R) of 0.027 and weighted average of 24.7%. Similarly, the statistical analysis conducted on geographies consisting of 66,601,333 people shows a mild negative correlation between the proportion of Shoshone and wage/income gap percentage in the United States with a correlation coefficient (R) of -0.375 and weighted average of 25.4%, a difference of 3.1%.
Wage/Income Gap Correlation Summary
| Measurement | Alsatian | Shoshone |
| Minimum | 3.0% | 0.19% |
| Maximum | 47.4% | 70.8% |
| Range | 44.4% | 70.6% |
| Mean | 30.2% | 27.1% |
| Median | 35.0% | 27.8% |
| Interquartile 25% (IQ1) | 22.7% | 10.8% |
| Interquartile 75% (IQ3) | 40.1% | 38.7% |
| Interquartile Range (IQR) | 17.4% | 27.9% |
| Standard Deviation (Sample) | 13.3% | 16.3% |
| Standard Deviation (Population) | 13.0% | 16.1% |
Similar Demographics by Wage/Income Gap
Demographics Similar to Alsatians by Wage/Income Gap
In terms of wage/income gap, the demographic groups most similar to Alsatians are Yup'ik (24.7%, a difference of 0.020%), Immigrants from Philippines (24.7%, a difference of 0.070%), Immigrants from Central America (24.6%, a difference of 0.080%), German Russian (24.6%, a difference of 0.14%), and Immigrants from Uruguay (24.6%, a difference of 0.15%).
| Demographics | Rating | Rank | Wage/Income Gap |
| Natives/Alaskans | 94.6 /100 | #123 | Exceptional 24.6% |
| Immigrants | South America | 93.9 /100 | #124 | Exceptional 24.6% |
| Spanish Americans | 93.8 /100 | #125 | Exceptional 24.6% |
| Immigrants | Uruguay | 93.8 /100 | #126 | Exceptional 24.6% |
| German Russians | 93.7 /100 | #127 | Exceptional 24.6% |
| Immigrants | Central America | 93.5 /100 | #128 | Exceptional 24.6% |
| Yup'ik | 93.3 /100 | #129 | Exceptional 24.7% |
| Alsatians | 93.2 /100 | #130 | Exceptional 24.7% |
| Immigrants | Philippines | 93.0 /100 | #131 | Exceptional 24.7% |
| Immigrants | Costa Rica | 92.4 /100 | #132 | Exceptional 24.7% |
| Colombians | 92.4 /100 | #133 | Exceptional 24.7% |
| Mexican American Indians | 92.2 /100 | #134 | Exceptional 24.7% |
| South American Indians | 92.0 /100 | #135 | Exceptional 24.7% |
| Armenians | 91.3 /100 | #136 | Exceptional 24.8% |
| Immigrants | South Eastern Asia | 90.9 /100 | #137 | Exceptional 24.8% |
Demographics Similar to Shoshone by Wage/Income Gap
In terms of wage/income gap, the demographic groups most similar to Shoshone are Native Hawaiian (25.4%, a difference of 0.0%), Albanian (25.4%, a difference of 0.030%), Korean (25.4%, a difference of 0.040%), French American Indian (25.4%, a difference of 0.28%), and Puget Sound Salish (25.3%, a difference of 0.32%).
| Demographics | Rating | Rank | Wage/Income Gap |
| Immigrants | Vietnam | 77.7 /100 | #155 | Good 25.2% |
| Immigrants | Mexico | 76.4 /100 | #156 | Good 25.3% |
| Costa Ricans | 75.8 /100 | #157 | Good 25.3% |
| Immigrants | Zimbabwe | 73.7 /100 | #158 | Good 25.3% |
| Puget Sound Salish | 73.0 /100 | #159 | Good 25.3% |
| French American Indians | 72.5 /100 | #160 | Good 25.4% |
| Albanians | 69.4 /100 | #161 | Good 25.4% |
| Shoshone | 69.0 /100 | #162 | Good 25.4% |
| Native Hawaiians | 69.0 /100 | #163 | Good 25.4% |
| Koreans | 68.6 /100 | #164 | Good 25.4% |
| Immigrants | Hong Kong | 64.0 /100 | #165 | Good 25.5% |
| Immigrants | Ukraine | 63.8 /100 | #166 | Good 25.5% |
| Paiute | 62.9 /100 | #167 | Good 25.5% |
| Seminole | 62.6 /100 | #168 | Good 25.6% |
| Peruvians | 60.1 /100 | #169 | Good 25.6% |