Alsatian vs Shoshone Single Father Poverty
COMPARE
Alsatian
Shoshone
Single Father Poverty
Single Father Poverty Comparison
Alsatians
Shoshone
17.8%
SINGLE FATHER POVERTY
0.0/ 100
METRIC RATING
283rd/ 347
METRIC RANK
22.9%
SINGLE FATHER POVERTY
0.0/ 100
METRIC RATING
335th/ 347
METRIC RANK
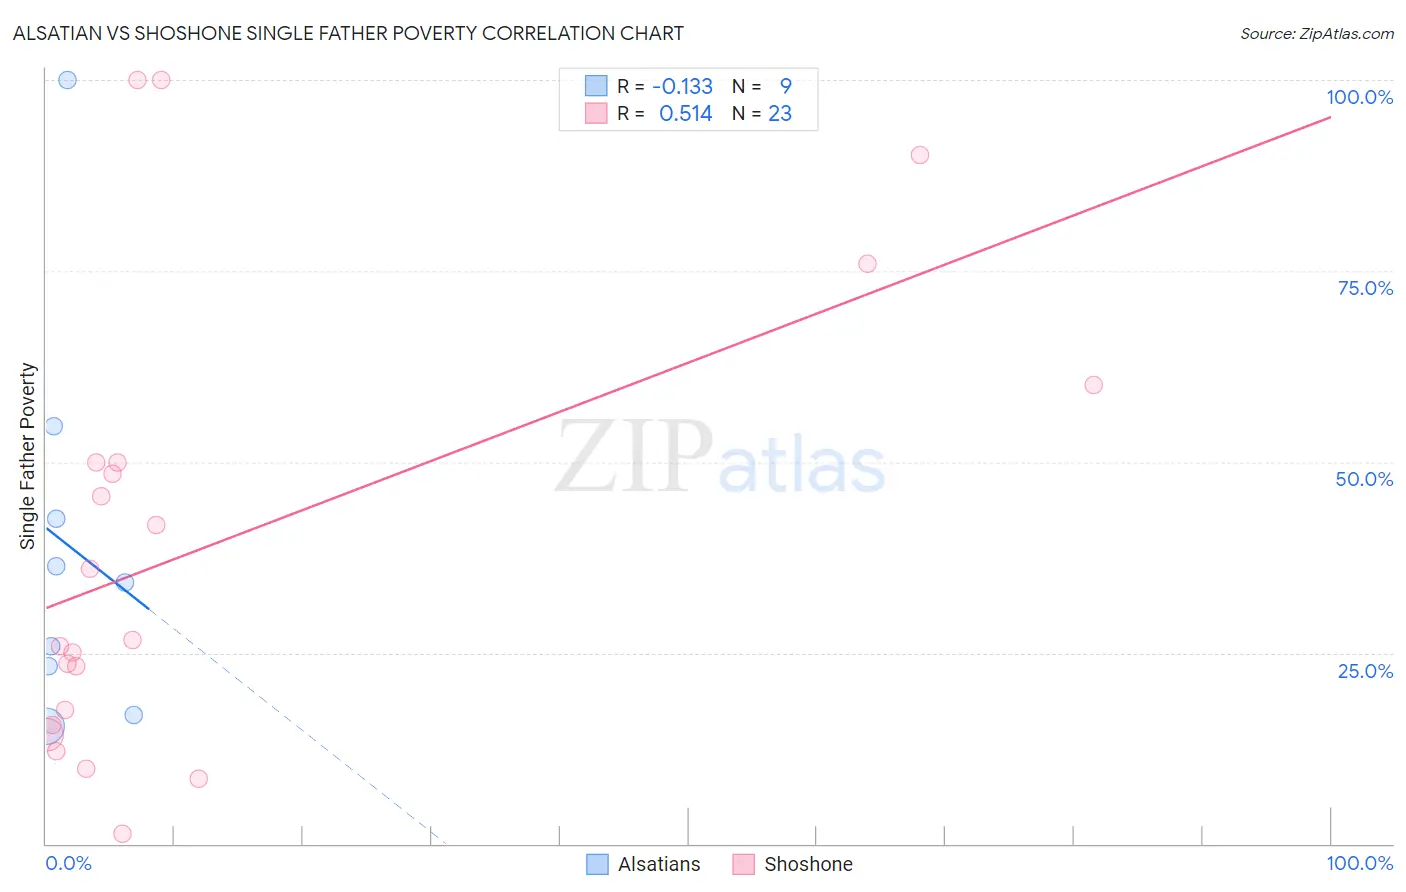
Alsatian vs Shoshone Single Father Poverty Correlation Chart
The statistical analysis conducted on geographies consisting of 73,758,627 people shows a poor negative correlation between the proportion of Alsatians and poverty level among single fathers in the United States with a correlation coefficient (R) of -0.133 and weighted average of 17.8%. Similarly, the statistical analysis conducted on geographies consisting of 62,234,172 people shows a substantial positive correlation between the proportion of Shoshone and poverty level among single fathers in the United States with a correlation coefficient (R) of 0.514 and weighted average of 22.9%, a difference of 28.6%.
Single Father Poverty Correlation Summary
| Measurement | Alsatian | Shoshone |
| Minimum | 15.4% | 1.4% |
| Maximum | 100.0% | 100.0% |
| Range | 84.6% | 98.6% |
| Mean | 38.8% | 39.2% |
| Median | 34.2% | 26.6% |
| Interquartile 25% (IQ1) | 20.1% | 15.5% |
| Interquartile 75% (IQ3) | 48.6% | 50.0% |
| Interquartile Range (IQR) | 28.5% | 34.5% |
| Standard Deviation (Sample) | 26.2% | 29.3% |
| Standard Deviation (Population) | 24.7% | 28.6% |
Similar Demographics by Single Father Poverty
Demographics Similar to Alsatians by Single Father Poverty
In terms of single father poverty, the demographic groups most similar to Alsatians are Welsh (17.8%, a difference of 0.020%), English (17.8%, a difference of 0.10%), Dutch (17.8%, a difference of 0.10%), Immigrants from Lebanon (17.9%, a difference of 0.38%), and Scottish (17.7%, a difference of 0.42%).
| Demographics | Rating | Rank | Single Father Poverty |
| German Russians | 0.0 /100 | #276 | Tragic 17.7% |
| Lebanese | 0.0 /100 | #277 | Tragic 17.7% |
| Germans | 0.0 /100 | #278 | Tragic 17.7% |
| Iroquois | 0.0 /100 | #279 | Tragic 17.7% |
| Scottish | 0.0 /100 | #280 | Tragic 17.7% |
| English | 0.0 /100 | #281 | Tragic 17.8% |
| Dutch | 0.0 /100 | #282 | Tragic 17.8% |
| Alsatians | 0.0 /100 | #283 | Tragic 17.8% |
| Welsh | 0.0 /100 | #284 | Tragic 17.8% |
| Immigrants | Lebanon | 0.0 /100 | #285 | Tragic 17.9% |
| Immigrants | North Macedonia | 0.0 /100 | #286 | Tragic 17.9% |
| Carpatho Rusyns | 0.0 /100 | #287 | Tragic 18.0% |
| Bahamians | 0.0 /100 | #288 | Tragic 18.0% |
| Irish | 0.0 /100 | #289 | Tragic 18.0% |
| West Indians | 0.0 /100 | #290 | Tragic 18.0% |
Demographics Similar to Shoshone by Single Father Poverty
In terms of single father poverty, the demographic groups most similar to Shoshone are Cajun (23.1%, a difference of 0.71%), Kiowa (22.5%, a difference of 2.0%), Native/Alaskan (22.4%, a difference of 2.3%), Tohono O'odham (22.0%, a difference of 4.1%), and Sioux (23.9%, a difference of 4.2%).
| Demographics | Rating | Rank | Single Father Poverty |
| Pueblo | 0.0 /100 | #328 | Tragic 21.1% |
| Colville | 0.0 /100 | #329 | Tragic 21.4% |
| Paiute | 0.0 /100 | #330 | Tragic 21.6% |
| Central American Indians | 0.0 /100 | #331 | Tragic 21.7% |
| Tohono O'odham | 0.0 /100 | #332 | Tragic 22.0% |
| Natives/Alaskans | 0.0 /100 | #333 | Tragic 22.4% |
| Kiowa | 0.0 /100 | #334 | Tragic 22.5% |
| Shoshone | 0.0 /100 | #335 | Tragic 22.9% |
| Cajuns | 0.0 /100 | #336 | Tragic 23.1% |
| Sioux | 0.0 /100 | #337 | Tragic 23.9% |
| Arapaho | 0.0 /100 | #338 | Tragic 24.0% |
| Apache | 0.0 /100 | #339 | Tragic 24.2% |
| Houma | 0.0 /100 | #340 | Tragic 26.7% |
| Hopi | 0.0 /100 | #341 | Tragic 27.2% |
| Yuman | 0.0 /100 | #342 | Tragic 28.4% |