Alsatian vs Immigrants from Turkey Wage/Income Gap
COMPARE
Alsatian
Immigrants from Turkey
Wage/Income Gap
Wage/Income Gap Comparison
Alsatians
Immigrants from Turkey
24.7%
WAGE/INCOME GAP
93.2/ 100
METRIC RATING
130th/ 347
METRIC RANK
27.0%
WAGE/INCOME GAP
5.6/ 100
METRIC RATING
228th/ 347
METRIC RANK
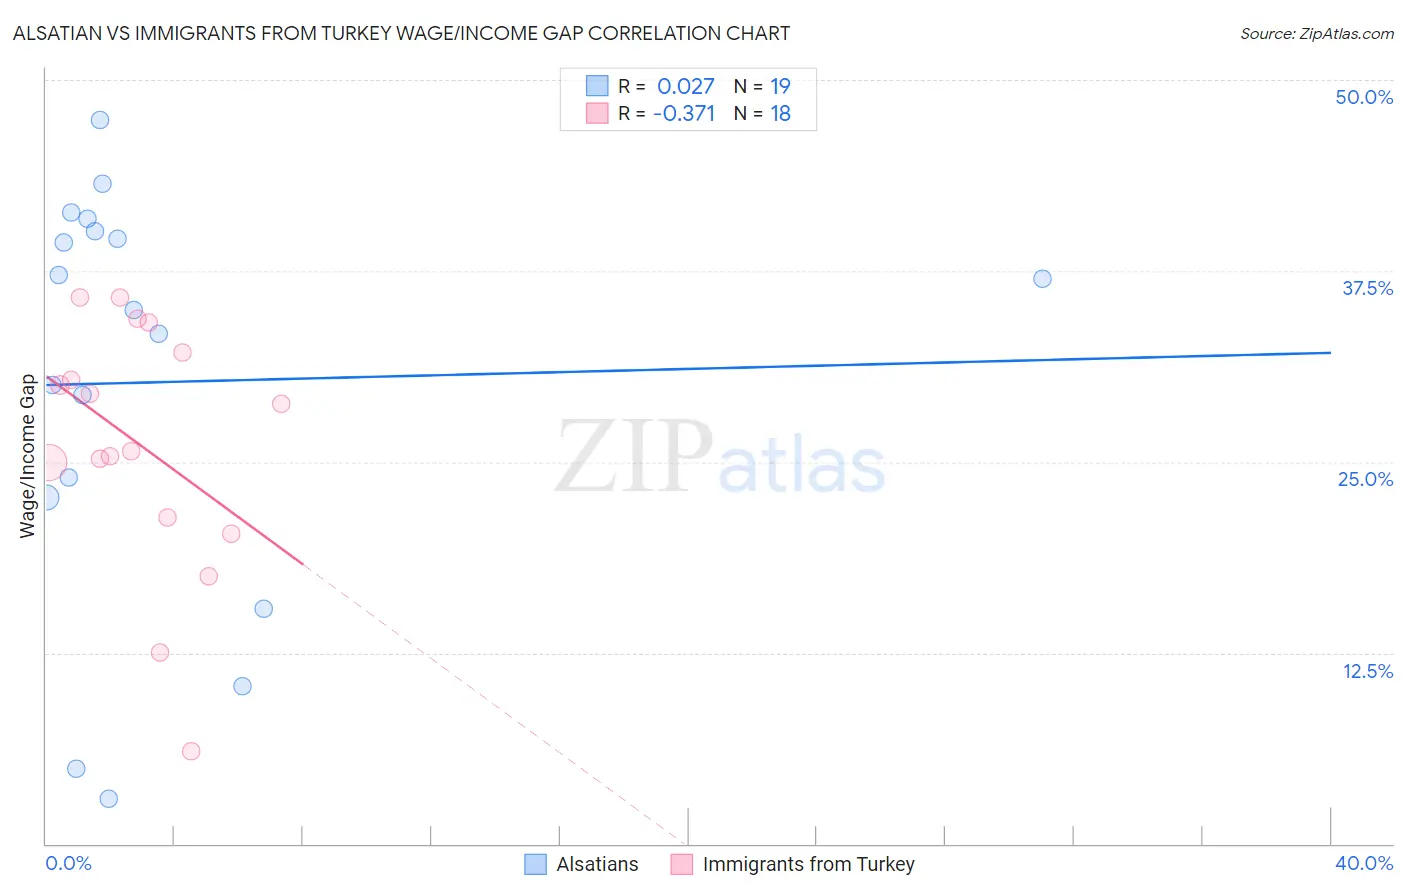
Alsatian vs Immigrants from Turkey Wage/Income Gap Correlation Chart
The statistical analysis conducted on geographies consisting of 82,663,210 people shows no correlation between the proportion of Alsatians and wage/income gap percentage in the United States with a correlation coefficient (R) of 0.027 and weighted average of 24.7%. Similarly, the statistical analysis conducted on geographies consisting of 223,006,850 people shows a mild negative correlation between the proportion of Immigrants from Turkey and wage/income gap percentage in the United States with a correlation coefficient (R) of -0.371 and weighted average of 27.0%, a difference of 9.3%.
Wage/Income Gap Correlation Summary
| Measurement | Alsatian | Immigrants from Turkey |
| Minimum | 3.0% | 6.1% |
| Maximum | 47.4% | 35.8% |
| Range | 44.4% | 29.7% |
| Mean | 30.2% | 26.1% |
| Median | 35.0% | 27.3% |
| Interquartile 25% (IQ1) | 22.7% | 21.4% |
| Interquartile 75% (IQ3) | 40.1% | 32.2% |
| Interquartile Range (IQR) | 17.4% | 10.8% |
| Standard Deviation (Sample) | 13.3% | 8.1% |
| Standard Deviation (Population) | 13.0% | 7.9% |
Similar Demographics by Wage/Income Gap
Demographics Similar to Alsatians by Wage/Income Gap
In terms of wage/income gap, the demographic groups most similar to Alsatians are Yup'ik (24.7%, a difference of 0.020%), Immigrants from Philippines (24.7%, a difference of 0.070%), Immigrants from Central America (24.6%, a difference of 0.080%), German Russian (24.6%, a difference of 0.14%), and Immigrants from Uruguay (24.6%, a difference of 0.15%).
| Demographics | Rating | Rank | Wage/Income Gap |
| Natives/Alaskans | 94.6 /100 | #123 | Exceptional 24.6% |
| Immigrants | South America | 93.9 /100 | #124 | Exceptional 24.6% |
| Spanish Americans | 93.8 /100 | #125 | Exceptional 24.6% |
| Immigrants | Uruguay | 93.8 /100 | #126 | Exceptional 24.6% |
| German Russians | 93.7 /100 | #127 | Exceptional 24.6% |
| Immigrants | Central America | 93.5 /100 | #128 | Exceptional 24.6% |
| Yup'ik | 93.3 /100 | #129 | Exceptional 24.7% |
| Alsatians | 93.2 /100 | #130 | Exceptional 24.7% |
| Immigrants | Philippines | 93.0 /100 | #131 | Exceptional 24.7% |
| Immigrants | Costa Rica | 92.4 /100 | #132 | Exceptional 24.7% |
| Colombians | 92.4 /100 | #133 | Exceptional 24.7% |
| Mexican American Indians | 92.2 /100 | #134 | Exceptional 24.7% |
| South American Indians | 92.0 /100 | #135 | Exceptional 24.7% |
| Armenians | 91.3 /100 | #136 | Exceptional 24.8% |
| Immigrants | South Eastern Asia | 90.9 /100 | #137 | Exceptional 24.8% |
Demographics Similar to Immigrants from Turkey by Wage/Income Gap
In terms of wage/income gap, the demographic groups most similar to Immigrants from Turkey are Spaniard (27.0%, a difference of 0.0%), Immigrants from Asia (27.0%, a difference of 0.030%), Asian (26.9%, a difference of 0.080%), Ottawa (27.0%, a difference of 0.080%), and Bhutanese (27.0%, a difference of 0.11%).
| Demographics | Rating | Rank | Wage/Income Gap |
| Immigrants | Spain | 8.5 /100 | #221 | Tragic 26.8% |
| Bolivians | 8.3 /100 | #222 | Tragic 26.8% |
| Jordanians | 8.0 /100 | #223 | Tragic 26.8% |
| Immigrants | Argentina | 7.2 /100 | #224 | Tragic 26.8% |
| Immigrants | Ireland | 6.5 /100 | #225 | Tragic 26.9% |
| Asians | 5.9 /100 | #226 | Tragic 26.9% |
| Spaniards | 5.6 /100 | #227 | Tragic 27.0% |
| Immigrants | Turkey | 5.6 /100 | #228 | Tragic 27.0% |
| Immigrants | Asia | 5.5 /100 | #229 | Tragic 27.0% |
| Ottawa | 5.3 /100 | #230 | Tragic 27.0% |
| Bhutanese | 5.3 /100 | #231 | Tragic 27.0% |
| Argentineans | 5.2 /100 | #232 | Tragic 27.0% |
| Immigrants | Brazil | 5.0 /100 | #233 | Tragic 27.0% |
| Immigrants | Pakistan | 4.9 /100 | #234 | Tragic 27.0% |
| Immigrants | Hungary | 4.8 /100 | #235 | Tragic 27.0% |