Alsatian vs Shoshone Disability Age 65 to 74
COMPARE
Alsatian
Shoshone
Disability Age 65 to 74
Disability Age 65 to 74 Comparison
Alsatians
Shoshone
22.8%
DISABILITY AGE 65 TO 74
83.7/ 100
METRIC RATING
146th/ 347
METRIC RANK
27.4%
DISABILITY AGE 65 TO 74
0.0/ 100
METRIC RATING
310th/ 347
METRIC RANK
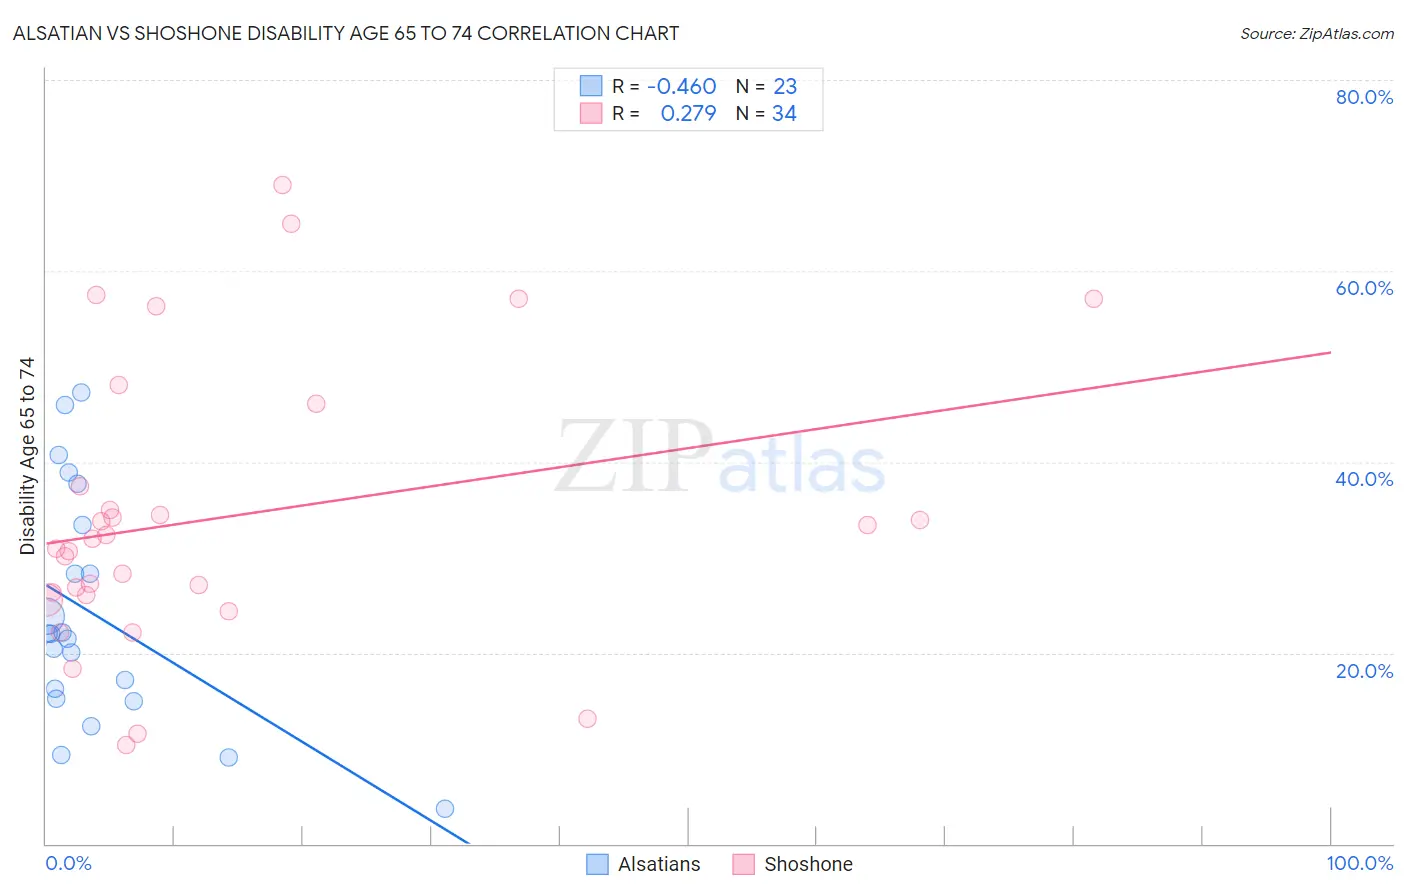
Alsatian vs Shoshone Disability Age 65 to 74 Correlation Chart
The statistical analysis conducted on geographies consisting of 82,675,825 people shows a moderate negative correlation between the proportion of Alsatians and percentage of population with a disability between the ages 65 and 75 in the United States with a correlation coefficient (R) of -0.460 and weighted average of 22.8%. Similarly, the statistical analysis conducted on geographies consisting of 66,592,892 people shows a weak positive correlation between the proportion of Shoshone and percentage of population with a disability between the ages 65 and 75 in the United States with a correlation coefficient (R) of 0.279 and weighted average of 27.4%, a difference of 20.2%.
Disability Age 65 to 74 Correlation Summary
| Measurement | Alsatian | Shoshone |
| Minimum | 3.7% | 10.3% |
| Maximum | 47.3% | 69.0% |
| Range | 43.7% | 58.7% |
| Mean | 23.9% | 34.2% |
| Median | 22.0% | 31.4% |
| Interquartile 25% (IQ1) | 15.2% | 26.0% |
| Interquartile 75% (IQ3) | 33.3% | 37.5% |
| Interquartile Range (IQR) | 18.2% | 11.5% |
| Standard Deviation (Sample) | 12.0% | 14.8% |
| Standard Deviation (Population) | 11.7% | 14.6% |
Similar Demographics by Disability Age 65 to 74
Demographics Similar to Alsatians by Disability Age 65 to 74
In terms of disability age 65 to 74, the demographic groups most similar to Alsatians are Immigrants from Uganda (22.8%, a difference of 0.030%), Danish (22.8%, a difference of 0.070%), Immigrants from Uzbekistan (22.8%, a difference of 0.070%), Arab (22.8%, a difference of 0.12%), and Immigrants from Ethiopia (22.7%, a difference of 0.18%).
| Demographics | Rating | Rank | Disability Age 65 to 74 |
| Immigrants | Syria | 85.8 /100 | #139 | Excellent 22.7% |
| Ugandans | 85.4 /100 | #140 | Excellent 22.7% |
| Belgians | 85.3 /100 | #141 | Excellent 22.7% |
| Immigrants | Ethiopia | 85.3 /100 | #142 | Excellent 22.7% |
| Arabs | 84.8 /100 | #143 | Excellent 22.8% |
| Danes | 84.4 /100 | #144 | Excellent 22.8% |
| Immigrants | Uganda | 84.0 /100 | #145 | Excellent 22.8% |
| Alsatians | 83.7 /100 | #146 | Excellent 22.8% |
| Immigrants | Uzbekistan | 83.1 /100 | #147 | Excellent 22.8% |
| New Zealanders | 79.9 /100 | #148 | Good 22.9% |
| Swiss | 79.7 /100 | #149 | Good 22.9% |
| Canadians | 77.7 /100 | #150 | Good 22.9% |
| Immigrants | Morocco | 77.6 /100 | #151 | Good 22.9% |
| Finns | 76.5 /100 | #152 | Good 22.9% |
| Slavs | 75.2 /100 | #153 | Good 23.0% |
Demographics Similar to Shoshone by Disability Age 65 to 74
In terms of disability age 65 to 74, the demographic groups most similar to Shoshone are Yaqui (27.4%, a difference of 0.050%), Sioux (27.3%, a difference of 0.11%), Menominee (27.4%, a difference of 0.23%), Ute (27.3%, a difference of 0.26%), and Osage (27.5%, a difference of 0.30%).
| Demographics | Rating | Rank | Disability Age 65 to 74 |
| Tlingit-Haida | 0.0 /100 | #303 | Tragic 27.1% |
| Puget Sound Salish | 0.0 /100 | #304 | Tragic 27.2% |
| Mexicans | 0.0 /100 | #305 | Tragic 27.2% |
| Blacks/African Americans | 0.0 /100 | #306 | Tragic 27.3% |
| Ute | 0.0 /100 | #307 | Tragic 27.3% |
| Sioux | 0.0 /100 | #308 | Tragic 27.3% |
| Yaqui | 0.0 /100 | #309 | Tragic 27.4% |
| Shoshone | 0.0 /100 | #310 | Tragic 27.4% |
| Menominee | 0.0 /100 | #311 | Tragic 27.4% |
| Osage | 0.0 /100 | #312 | Tragic 27.5% |
| Paiute | 0.0 /100 | #313 | Tragic 27.8% |
| Chippewa | 0.0 /100 | #314 | Tragic 27.8% |
| Cajuns | 0.0 /100 | #315 | Tragic 27.9% |
| Crow | 0.0 /100 | #316 | Tragic 27.9% |
| Immigrants | Armenia | 0.0 /100 | #317 | Tragic 28.0% |