Albanian vs Creek Wage/Income Gap
COMPARE
Albanian
Creek
Wage/Income Gap
Wage/Income Gap Comparison
Albanians
Creek
25.4%
WAGE/INCOME GAP
69.4/ 100
METRIC RATING
161st/ 347
METRIC RANK
27.1%
WAGE/INCOME GAP
3.8/ 100
METRIC RATING
241st/ 347
METRIC RANK
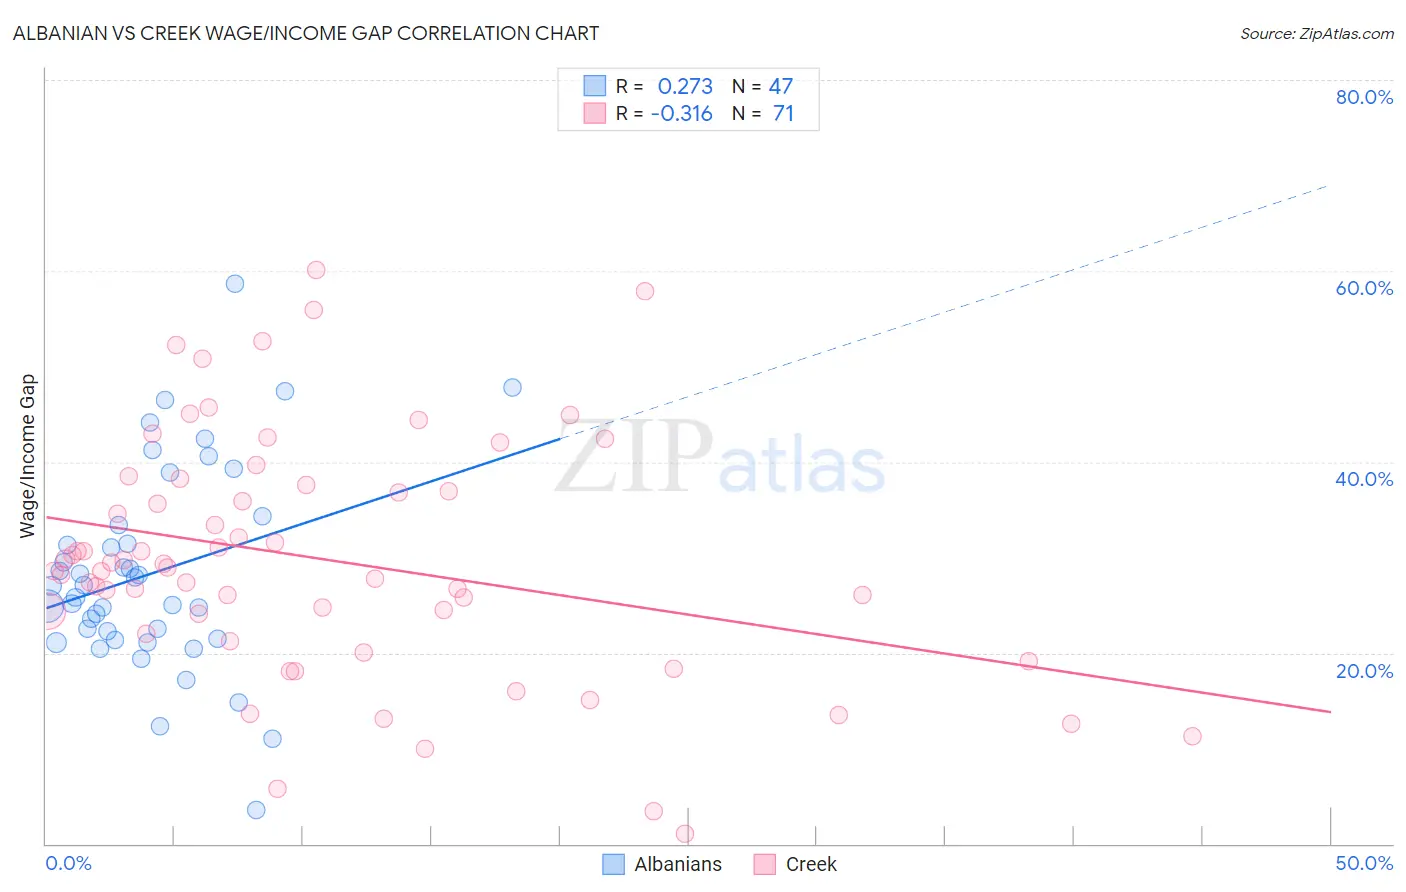
Albanian vs Creek Wage/Income Gap Correlation Chart
The statistical analysis conducted on geographies consisting of 193,205,458 people shows a weak positive correlation between the proportion of Albanians and wage/income gap percentage in the United States with a correlation coefficient (R) of 0.273 and weighted average of 25.4%. Similarly, the statistical analysis conducted on geographies consisting of 178,368,499 people shows a mild negative correlation between the proportion of Creek and wage/income gap percentage in the United States with a correlation coefficient (R) of -0.316 and weighted average of 27.1%, a difference of 6.7%.
Wage/Income Gap Correlation Summary
| Measurement | Albanian | Creek |
| Minimum | 3.5% | 0.99% |
| Maximum | 58.7% | 60.1% |
| Range | 55.2% | 59.1% |
| Mean | 28.3% | 29.8% |
| Median | 27.0% | 28.9% |
| Interquartile 25% (IQ1) | 21.5% | 22.0% |
| Interquartile 75% (IQ3) | 33.4% | 37.6% |
| Interquartile Range (IQR) | 11.9% | 15.5% |
| Standard Deviation (Sample) | 10.6% | 12.7% |
| Standard Deviation (Population) | 10.5% | 12.6% |
Similar Demographics by Wage/Income Gap
Demographics Similar to Albanians by Wage/Income Gap
In terms of wage/income gap, the demographic groups most similar to Albanians are Shoshone (25.4%, a difference of 0.030%), Native Hawaiian (25.4%, a difference of 0.030%), Korean (25.4%, a difference of 0.060%), French American Indian (25.4%, a difference of 0.26%), and Puget Sound Salish (25.3%, a difference of 0.29%).
| Demographics | Rating | Rank | Wage/Income Gap |
| Immigrants | Northern Africa | 78.1 /100 | #154 | Good 25.2% |
| Immigrants | Vietnam | 77.7 /100 | #155 | Good 25.2% |
| Immigrants | Mexico | 76.4 /100 | #156 | Good 25.3% |
| Costa Ricans | 75.8 /100 | #157 | Good 25.3% |
| Immigrants | Zimbabwe | 73.7 /100 | #158 | Good 25.3% |
| Puget Sound Salish | 73.0 /100 | #159 | Good 25.3% |
| French American Indians | 72.5 /100 | #160 | Good 25.4% |
| Albanians | 69.4 /100 | #161 | Good 25.4% |
| Shoshone | 69.0 /100 | #162 | Good 25.4% |
| Native Hawaiians | 69.0 /100 | #163 | Good 25.4% |
| Koreans | 68.6 /100 | #164 | Good 25.4% |
| Immigrants | Hong Kong | 64.0 /100 | #165 | Good 25.5% |
| Immigrants | Ukraine | 63.8 /100 | #166 | Good 25.5% |
| Paiute | 62.9 /100 | #167 | Good 25.5% |
| Seminole | 62.6 /100 | #168 | Good 25.6% |
Demographics Similar to Creek by Wage/Income Gap
In terms of wage/income gap, the demographic groups most similar to Creek are Immigrants from Europe (27.1%, a difference of 0.020%), Immigrants from Sri Lanka (27.1%, a difference of 0.050%), Spanish (27.1%, a difference of 0.060%), Chickasaw (27.2%, a difference of 0.13%), and Immigrants from the Azores (27.2%, a difference of 0.14%).
| Demographics | Rating | Rank | Wage/Income Gap |
| Immigrants | Pakistan | 4.9 /100 | #234 | Tragic 27.0% |
| Immigrants | Hungary | 4.8 /100 | #235 | Tragic 27.0% |
| Immigrants | Romania | 4.8 /100 | #236 | Tragic 27.0% |
| Immigrants | Eastern Asia | 4.4 /100 | #237 | Tragic 27.1% |
| Osage | 4.4 /100 | #238 | Tragic 27.1% |
| Estonians | 4.3 /100 | #239 | Tragic 27.1% |
| Immigrants | Europe | 3.8 /100 | #240 | Tragic 27.1% |
| Creek | 3.8 /100 | #241 | Tragic 27.1% |
| Immigrants | Sri Lanka | 3.7 /100 | #242 | Tragic 27.1% |
| Spanish | 3.6 /100 | #243 | Tragic 27.1% |
| Chickasaw | 3.5 /100 | #244 | Tragic 27.2% |
| Immigrants | Azores | 3.5 /100 | #245 | Tragic 27.2% |
| Immigrants | Nonimmigrants | 3.3 /100 | #246 | Tragic 27.2% |
| Celtics | 2.8 /100 | #247 | Tragic 27.3% |
| Cypriots | 2.8 /100 | #248 | Tragic 27.3% |