Albanian vs Immigrants from Dominican Republic In Labor Force | Age > 16
COMPARE
Albanian
Immigrants from Dominican Republic
In Labor Force | Age > 16
In Labor Force | Age > 16 Comparison
Albanians
Immigrants from Dominican Republic
65.3%
IN LABOR FORCE | AGE > 16
70.8/ 100
METRIC RATING
162nd/ 347
METRIC RANK
64.4%
IN LABOR FORCE | AGE > 16
1.5/ 100
METRIC RATING
252nd/ 347
METRIC RANK
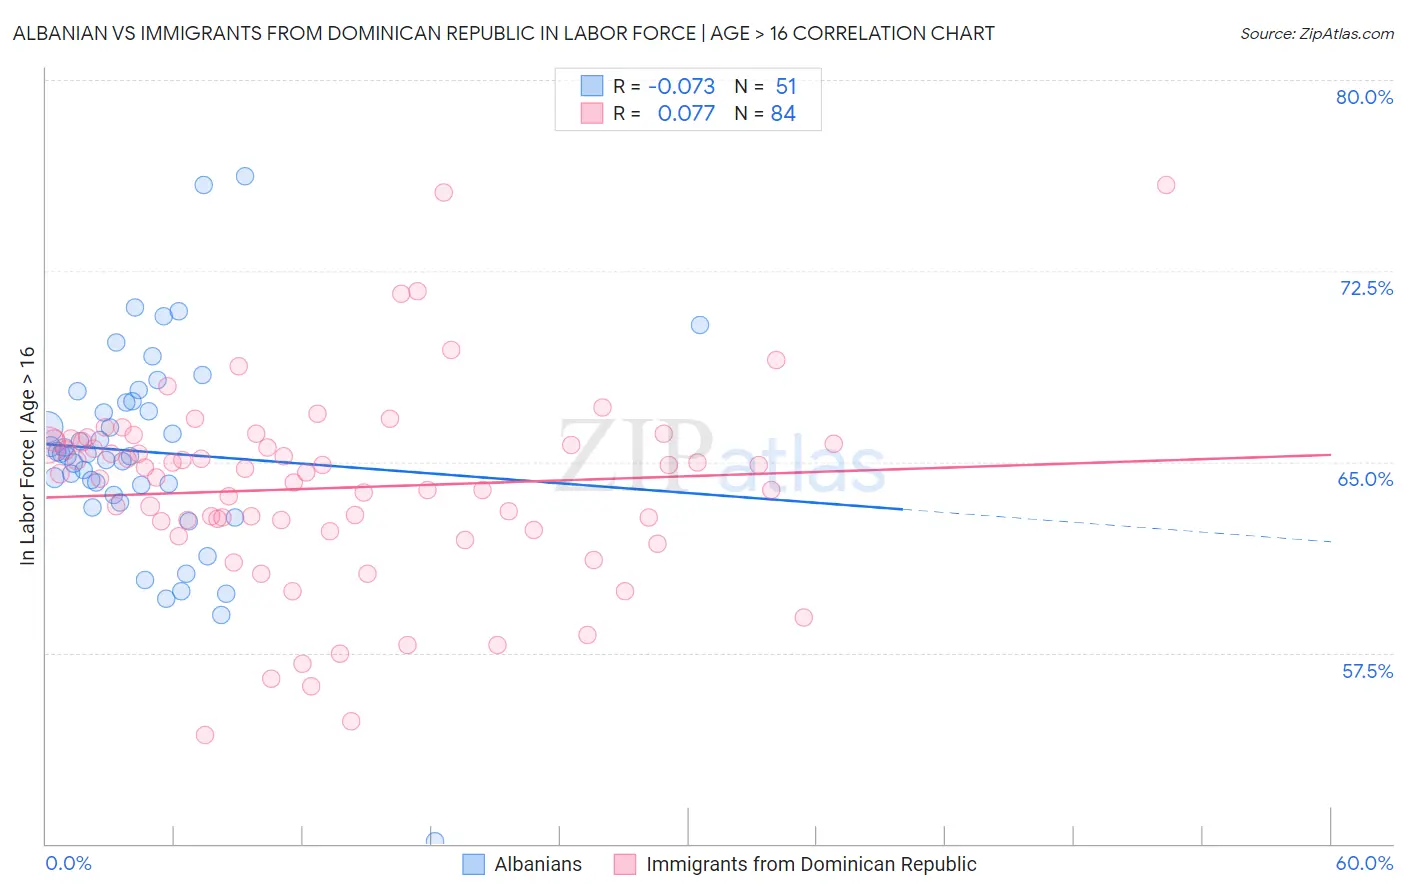
Albanian vs Immigrants from Dominican Republic In Labor Force | Age > 16 Correlation Chart
The statistical analysis conducted on geographies consisting of 193,265,279 people shows a slight negative correlation between the proportion of Albanians and labor force participation rate among population ages 16 and over in the United States with a correlation coefficient (R) of -0.073 and weighted average of 65.3%. Similarly, the statistical analysis conducted on geographies consisting of 275,136,477 people shows a slight positive correlation between the proportion of Immigrants from Dominican Republic and labor force participation rate among population ages 16 and over in the United States with a correlation coefficient (R) of 0.077 and weighted average of 64.4%, a difference of 1.4%.
In Labor Force | Age > 16 Correlation Summary
| Measurement | Albanian | Immigrants from Dominican Republic |
| Minimum | 50.1% | 54.3% |
| Maximum | 76.2% | 75.9% |
| Range | 26.1% | 21.6% |
| Mean | 65.4% | 64.0% |
| Median | 65.3% | 64.6% |
| Interquartile 25% (IQ1) | 63.7% | 62.5% |
| Interquartile 75% (IQ3) | 67.4% | 65.7% |
| Interquartile Range (IQR) | 3.7% | 3.3% |
| Standard Deviation (Sample) | 4.2% | 3.8% |
| Standard Deviation (Population) | 4.2% | 3.8% |
Similar Demographics by In Labor Force | Age > 16
Demographics Similar to Albanians by In Labor Force | Age > 16
In terms of in labor force | age > 16, the demographic groups most similar to Albanians are Australian (65.3%, a difference of 0.010%), South African (65.3%, a difference of 0.010%), Danish (65.3%, a difference of 0.030%), Immigrants from South Africa (65.3%, a difference of 0.040%), and Immigrants from Kazakhstan (65.3%, a difference of 0.040%).
| Demographics | Rating | Rank | In Labor Force | Age > 16 |
| Immigrants | Armenia | 76.6 /100 | #155 | Good 65.3% |
| Immigrants | Ireland | 75.9 /100 | #156 | Good 65.3% |
| Immigrants | Russia | 75.7 /100 | #157 | Good 65.3% |
| Panamanians | 75.2 /100 | #158 | Good 65.3% |
| Immigrants | Syria | 74.6 /100 | #159 | Good 65.3% |
| Immigrants | South Africa | 73.5 /100 | #160 | Good 65.3% |
| Australians | 71.3 /100 | #161 | Good 65.3% |
| Albanians | 70.8 /100 | #162 | Good 65.3% |
| South Africans | 69.8 /100 | #163 | Good 65.3% |
| Danes | 68.8 /100 | #164 | Good 65.3% |
| Immigrants | Kazakhstan | 68.1 /100 | #165 | Good 65.3% |
| Immigrants | Western Asia | 67.3 /100 | #166 | Good 65.3% |
| Immigrants | Belarus | 66.0 /100 | #167 | Good 65.2% |
| Serbians | 63.5 /100 | #168 | Good 65.2% |
| Arabs | 62.4 /100 | #169 | Good 65.2% |
Demographics Similar to Immigrants from Dominican Republic by In Labor Force | Age > 16
In terms of in labor force | age > 16, the demographic groups most similar to Immigrants from Dominican Republic are Czechoslovakian (64.3%, a difference of 0.010%), Immigrants from Uzbekistan (64.3%, a difference of 0.010%), Portuguese (64.4%, a difference of 0.030%), British West Indian (64.4%, a difference of 0.050%), and German (64.4%, a difference of 0.060%).
| Demographics | Rating | Rank | In Labor Force | Age > 16 |
| West Indians | 3.0 /100 | #245 | Tragic 64.5% |
| Immigrants | Caribbean | 2.3 /100 | #246 | Tragic 64.4% |
| Swiss | 2.1 /100 | #247 | Tragic 64.4% |
| Immigrants | Barbados | 2.1 /100 | #248 | Tragic 64.4% |
| Germans | 1.8 /100 | #249 | Tragic 64.4% |
| British West Indians | 1.8 /100 | #250 | Tragic 64.4% |
| Portuguese | 1.6 /100 | #251 | Tragic 64.4% |
| Immigrants | Dominican Republic | 1.5 /100 | #252 | Tragic 64.4% |
| Czechoslovakians | 1.4 /100 | #253 | Tragic 64.3% |
| Immigrants | Uzbekistan | 1.4 /100 | #254 | Tragic 64.3% |
| Hispanics or Latinos | 1.1 /100 | #255 | Tragic 64.3% |
| Immigrants | Mexico | 1.0 /100 | #256 | Tragic 64.3% |
| Inupiat | 0.8 /100 | #257 | Tragic 64.3% |
| Immigrants | Scotland | 0.8 /100 | #258 | Tragic 64.2% |
| Immigrants | Western Europe | 0.7 /100 | #259 | Tragic 64.2% |