Albanian vs Immigrants from Dominican Republic Unemployment Among Ages 60 to 64 years
COMPARE
Albanian
Immigrants from Dominican Republic
Unemployment Among Ages 60 to 64 years
Unemployment Among Ages 60 to 64 years Comparison
Albanians
Immigrants from Dominican Republic
4.7%
UNEMPLOYMENT AMONG AGES 60 TO 64 YEARS
95.3/ 100
METRIC RATING
121st/ 347
METRIC RANK
6.0%
UNEMPLOYMENT AMONG AGES 60 TO 64 YEARS
0.0/ 100
METRIC RATING
333rd/ 347
METRIC RANK
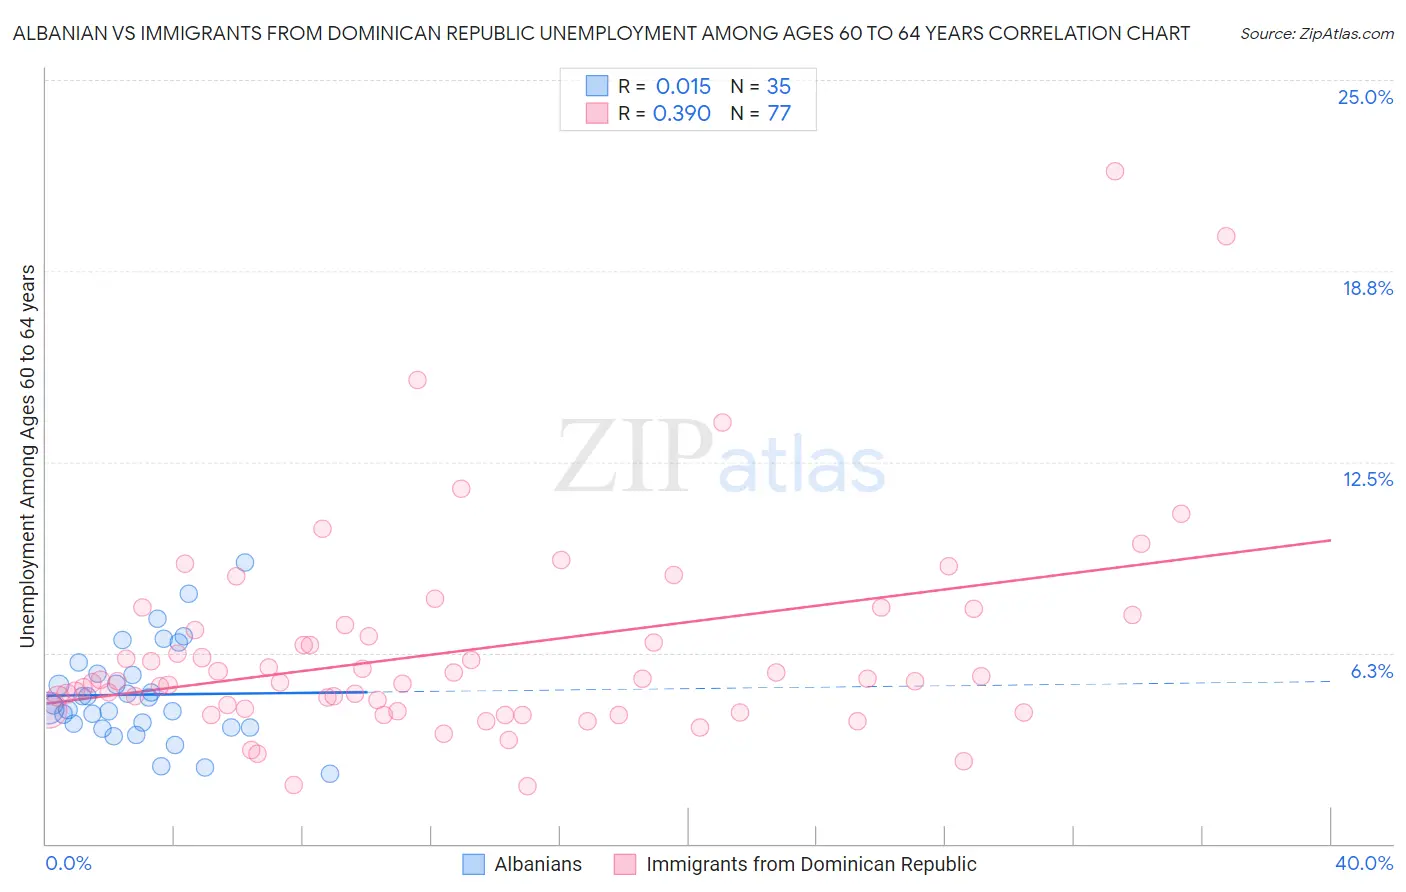
Albanian vs Immigrants from Dominican Republic Unemployment Among Ages 60 to 64 years Correlation Chart
The statistical analysis conducted on geographies consisting of 182,876,519 people shows no correlation between the proportion of Albanians and unemployment rate among population between the ages 60 and 64 in the United States with a correlation coefficient (R) of 0.015 and weighted average of 4.7%. Similarly, the statistical analysis conducted on geographies consisting of 256,183,735 people shows a mild positive correlation between the proportion of Immigrants from Dominican Republic and unemployment rate among population between the ages 60 and 64 in the United States with a correlation coefficient (R) of 0.390 and weighted average of 6.0%, a difference of 26.8%.
Unemployment Among Ages 60 to 64 years Correlation Summary
| Measurement | Albanian | Immigrants from Dominican Republic |
| Minimum | 2.3% | 1.9% |
| Maximum | 9.2% | 22.0% |
| Range | 6.9% | 20.1% |
| Mean | 4.9% | 6.3% |
| Median | 4.6% | 5.3% |
| Interquartile 25% (IQ1) | 3.8% | 4.4% |
| Interquartile 75% (IQ3) | 5.5% | 7.1% |
| Interquartile Range (IQR) | 1.7% | 2.7% |
| Standard Deviation (Sample) | 1.6% | 3.4% |
| Standard Deviation (Population) | 1.5% | 3.4% |
Similar Demographics by Unemployment Among Ages 60 to 64 years
Demographics Similar to Albanians by Unemployment Among Ages 60 to 64 years
In terms of unemployment among ages 60 to 64 years, the demographic groups most similar to Albanians are Immigrants from Kazakhstan (4.7%, a difference of 0.030%), Macedonian (4.7%, a difference of 0.080%), Immigrants from Morocco (4.7%, a difference of 0.090%), Finnish (4.7%, a difference of 0.11%), and Immigrants from Senegal (4.7%, a difference of 0.14%).
| Demographics | Rating | Rank | Unemployment Among Ages 60 to 64 years |
| Maltese | 96.5 /100 | #114 | Exceptional 4.7% |
| Immigrants | Romania | 96.4 /100 | #115 | Exceptional 4.7% |
| Immigrants | England | 96.3 /100 | #116 | Exceptional 4.7% |
| Immigrants | Germany | 96.3 /100 | #117 | Exceptional 4.7% |
| Ukrainians | 96.1 /100 | #118 | Exceptional 4.7% |
| Immigrants | Morocco | 95.7 /100 | #119 | Exceptional 4.7% |
| Macedonians | 95.7 /100 | #120 | Exceptional 4.7% |
| Albanians | 95.3 /100 | #121 | Exceptional 4.7% |
| Immigrants | Kazakhstan | 95.1 /100 | #122 | Exceptional 4.7% |
| Finns | 94.7 /100 | #123 | Exceptional 4.7% |
| Immigrants | Senegal | 94.5 /100 | #124 | Exceptional 4.7% |
| Immigrants | Thailand | 93.7 /100 | #125 | Exceptional 4.7% |
| Immigrants | South Central Asia | 93.0 /100 | #126 | Exceptional 4.7% |
| Austrians | 91.9 /100 | #127 | Exceptional 4.8% |
| Choctaw | 90.3 /100 | #128 | Exceptional 4.8% |
Demographics Similar to Immigrants from Dominican Republic by Unemployment Among Ages 60 to 64 years
In terms of unemployment among ages 60 to 64 years, the demographic groups most similar to Immigrants from Dominican Republic are Dominican (6.0%, a difference of 0.35%), Yakama (6.0%, a difference of 0.37%), Immigrants from Armenia (6.0%, a difference of 0.51%), Immigrants from Bangladesh (6.0%, a difference of 0.77%), and Apache (6.0%, a difference of 0.78%).
| Demographics | Rating | Rank | Unemployment Among Ages 60 to 64 years |
| Immigrants | St. Vincent and the Grenadines | 0.0 /100 | #326 | Tragic 5.9% |
| Immigrants | Grenada | 0.0 /100 | #327 | Tragic 5.9% |
| Apache | 0.0 /100 | #328 | Tragic 6.0% |
| Immigrants | Bangladesh | 0.0 /100 | #329 | Tragic 6.0% |
| Immigrants | Armenia | 0.0 /100 | #330 | Tragic 6.0% |
| Yakama | 0.0 /100 | #331 | Tragic 6.0% |
| Dominicans | 0.0 /100 | #332 | Tragic 6.0% |
| Immigrants | Dominican Republic | 0.0 /100 | #333 | Tragic 6.0% |
| Puerto Ricans | 0.0 /100 | #334 | Tragic 6.1% |
| Vietnamese | 0.0 /100 | #335 | Tragic 6.1% |
| Kiowa | 0.0 /100 | #336 | Tragic 6.2% |
| Navajo | 0.0 /100 | #337 | Tragic 6.3% |
| Arapaho | 0.0 /100 | #338 | Tragic 6.3% |
| Tlingit-Haida | 0.0 /100 | #339 | Tragic 6.4% |
| Pueblo | 0.0 /100 | #340 | Tragic 6.7% |