African vs Dutch West Indian Unemployment Among Ages 30 to 34 years
COMPARE
African
Dutch West Indian
Unemployment Among Ages 30 to 34 years
Unemployment Among Ages 30 to 34 years Comparison
Africans
Dutch West Indians
6.4%
UNEMPLOYMENT AMONG AGES 30 TO 34 YEARS
0.0/ 100
METRIC RATING
282nd/ 347
METRIC RANK
6.6%
UNEMPLOYMENT AMONG AGES 30 TO 34 YEARS
0.0/ 100
METRIC RATING
299th/ 347
METRIC RANK
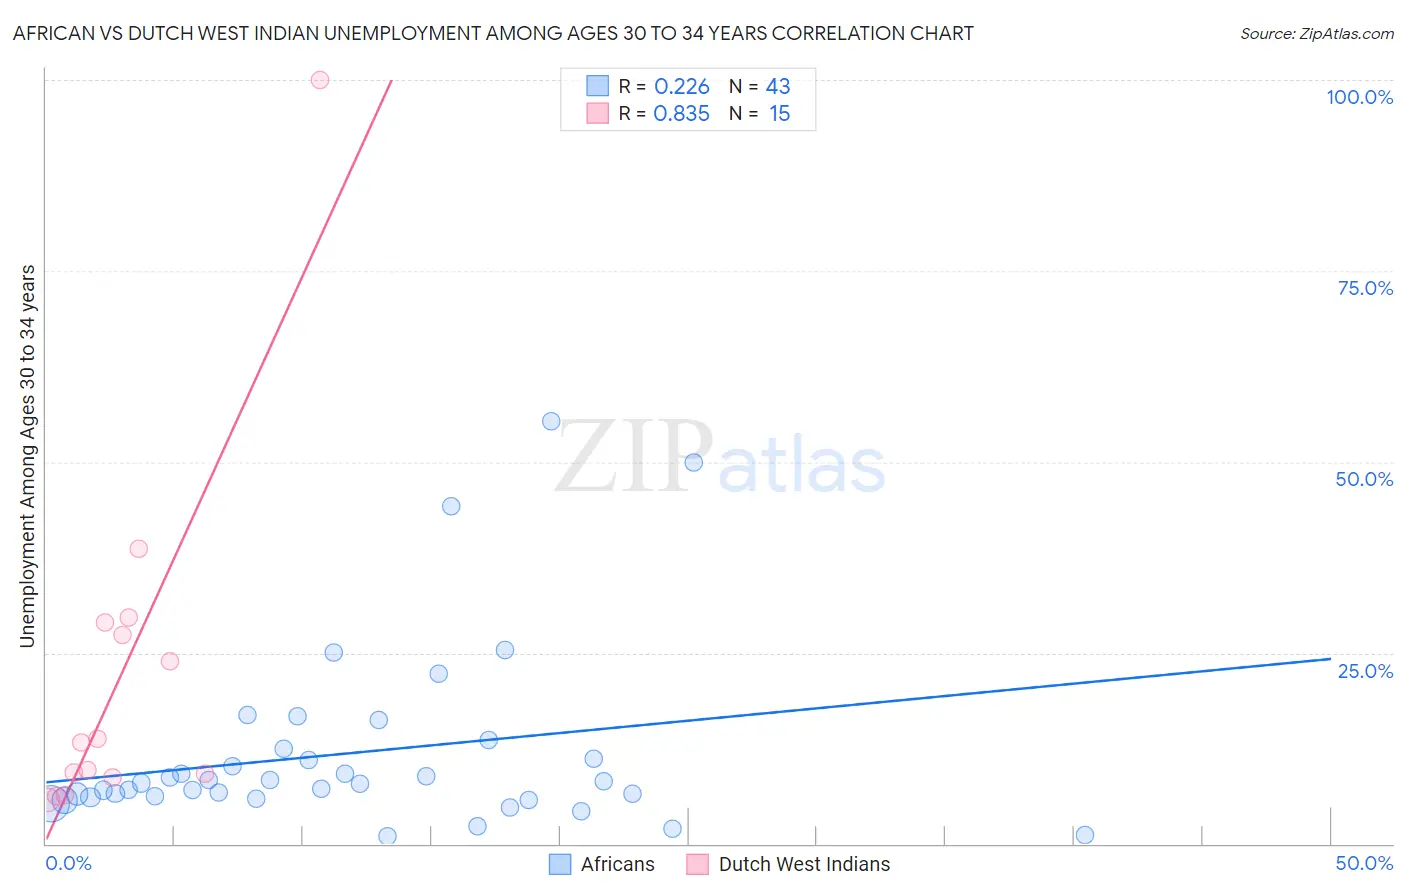
African vs Dutch West Indian Unemployment Among Ages 30 to 34 years Correlation Chart
The statistical analysis conducted on geographies consisting of 439,187,267 people shows a weak positive correlation between the proportion of Africans and unemployment rate among population between the ages 30 and 34 in the United States with a correlation coefficient (R) of 0.226 and weighted average of 6.4%. Similarly, the statistical analysis conducted on geographies consisting of 82,832,966 people shows a very strong positive correlation between the proportion of Dutch West Indians and unemployment rate among population between the ages 30 and 34 in the United States with a correlation coefficient (R) of 0.835 and weighted average of 6.6%, a difference of 2.5%.
Unemployment Among Ages 30 to 34 years Correlation Summary
| Measurement | African | Dutch West Indian |
| Minimum | 1.0% | 5.7% |
| Maximum | 55.4% | 100.0% |
| Range | 54.4% | 94.3% |
| Mean | 11.9% | 22.0% |
| Median | 7.9% | 13.2% |
| Interquartile 25% (IQ1) | 6.1% | 8.7% |
| Interquartile 75% (IQ3) | 12.4% | 28.9% |
| Interquartile Range (IQR) | 6.3% | 20.3% |
| Standard Deviation (Sample) | 11.9% | 24.0% |
| Standard Deviation (Population) | 11.8% | 23.2% |
Demographics Similar to Africans and Dutch West Indians by Unemployment Among Ages 30 to 34 years
In terms of unemployment among ages 30 to 34 years, the demographic groups most similar to Africans are Hispanic or Latino (6.4%, a difference of 0.030%), Immigrants from Bangladesh (6.4%, a difference of 0.090%), Choctaw (6.4%, a difference of 0.20%), Central American Indian (6.4%, a difference of 0.24%), and Immigrants from West Indies (6.4%, a difference of 0.26%). Similarly, the demographic groups most similar to Dutch West Indians are Bahamian (6.6%, a difference of 0.050%), Immigrants from Barbados (6.6%, a difference of 0.10%), Creek (6.6%, a difference of 0.35%), Immigrants from Jamaica (6.5%, a difference of 0.45%), and Trinidadian and Tobagonian (6.5%, a difference of 0.50%).
| Demographics | Rating | Rank | Unemployment Among Ages 30 to 34 years |
| Cherokee | 0.0 /100 | #280 | Tragic 6.4% |
| Immigrants | Caribbean | 0.0 /100 | #281 | Tragic 6.4% |
| Africans | 0.0 /100 | #282 | Tragic 6.4% |
| Hispanics or Latinos | 0.0 /100 | #283 | Tragic 6.4% |
| Immigrants | Bangladesh | 0.0 /100 | #284 | Tragic 6.4% |
| Choctaw | 0.0 /100 | #285 | Tragic 6.4% |
| Central American Indians | 0.0 /100 | #286 | Tragic 6.4% |
| Immigrants | West Indies | 0.0 /100 | #287 | Tragic 6.4% |
| Senegalese | 0.0 /100 | #288 | Tragic 6.4% |
| Menominee | 0.0 /100 | #289 | Tragic 6.4% |
| Immigrants | Trinidad and Tobago | 0.0 /100 | #290 | Tragic 6.5% |
| Jamaicans | 0.0 /100 | #291 | Tragic 6.5% |
| Vietnamese | 0.0 /100 | #292 | Tragic 6.5% |
| West Indians | 0.0 /100 | #293 | Tragic 6.5% |
| Barbadians | 0.0 /100 | #294 | Tragic 6.5% |
| Trinidadians and Tobagonians | 0.0 /100 | #295 | Tragic 6.5% |
| Immigrants | Jamaica | 0.0 /100 | #296 | Tragic 6.5% |
| Creek | 0.0 /100 | #297 | Tragic 6.6% |
| Immigrants | Barbados | 0.0 /100 | #298 | Tragic 6.6% |
| Dutch West Indians | 0.0 /100 | #299 | Tragic 6.6% |
| Bahamians | 0.0 /100 | #300 | Tragic 6.6% |