Spring Ridge, FL Map & Demographics
Spring Ridge Map
Spring Ridge Overview
$40,570
PER CAPITA INCOME
$60,357
AVG FAMILY INCOME
$57,232
AVG HOUSEHOLD INCOME
26.1%
WAGE / INCOME GAP [ % ]
73.9¢/ $1
WAGE / INCOME GAP [ $ ]
0.41
INEQUALITY / GINI INDEX
256
TOTAL POPULATION
129
MALE POPULATION
127
FEMALE POPULATION
101.57
MALES / 100 FEMALES
98.45
FEMALES / 100 MALES
52.3
MEDIAN AGE
2.4
AVG FAMILY SIZE
2.1
AVG HOUSEHOLD SIZE
117
LABOR FORCE [ PEOPLE ]
56.3%
PERCENT IN LABOR FORCE
12.0%
UNEMPLOYMENT RATE
Income in Spring Ridge
Income Overview in Spring Ridge
Per Capita Income in Spring Ridge is $40,570, while median incomes of families and households are $60,357 and $57,232 respectively.
| Characteristic | Number | Measure |
| Per Capita Income | 256 | $40,570 |
| Median Family Income | 88 | $60,357 |
| Mean Family Income | 88 | $101,407 |
| Median Household Income | 121 | $57,232 |
| Mean Household Income | 121 | $86,831 |
| Income Deficit | 88 | $0 |
| Wage / Income Gap (%) | 256 | 26.15% |
| Wage / Income Gap ($) | 256 | 73.85¢ per $1 |
| Gini / Inequality Index | 256 | 0.41 |
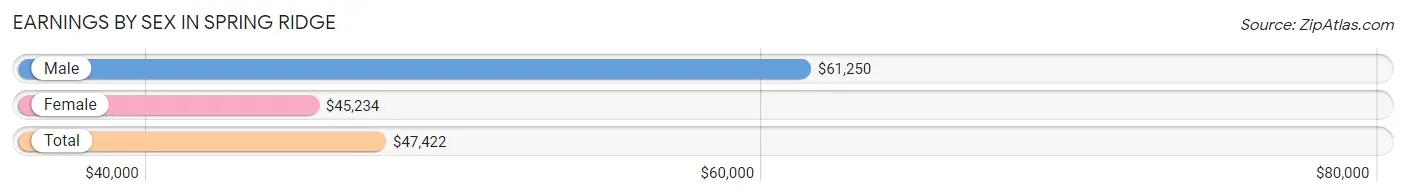
Earnings by Sex in Spring Ridge
Average Earnings in Spring Ridge are $47,422, $61,250 for men and $45,234 for women, a difference of 26.2%.
| Sex | Number | Average Earnings |
| Male | 58 (45.7%) | $61,250 |
| Female | 69 (54.3%) | $45,234 |
| Total | 127 (100.0%) | $47,422 |
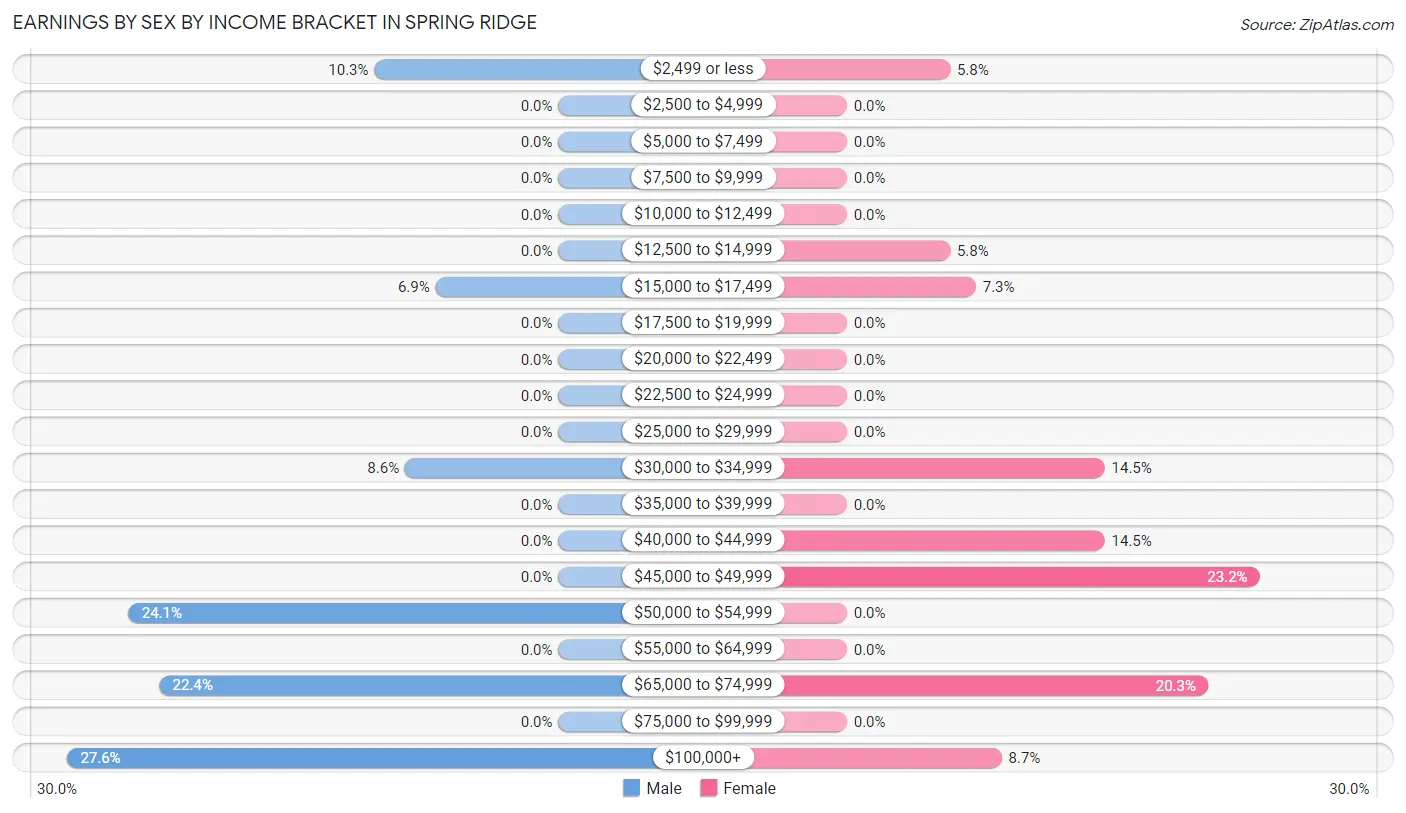
Earnings by Sex by Income Bracket in Spring Ridge
The most common earnings brackets in Spring Ridge are $100,000+ for men (16 | 27.6%) and $45,000 to $49,999 for women (16 | 23.2%).
| Income | Male | Female |
| $2,499 or less | 6 (10.3%) | 4 (5.8%) |
| $2,500 to $4,999 | 0 (0.0%) | 0 (0.0%) |
| $5,000 to $7,499 | 0 (0.0%) | 0 (0.0%) |
| $7,500 to $9,999 | 0 (0.0%) | 0 (0.0%) |
| $10,000 to $12,499 | 0 (0.0%) | 0 (0.0%) |
| $12,500 to $14,999 | 0 (0.0%) | 4 (5.8%) |
| $15,000 to $17,499 | 4 (6.9%) | 5 (7.2%) |
| $17,500 to $19,999 | 0 (0.0%) | 0 (0.0%) |
| $20,000 to $22,499 | 0 (0.0%) | 0 (0.0%) |
| $22,500 to $24,999 | 0 (0.0%) | 0 (0.0%) |
| $25,000 to $29,999 | 0 (0.0%) | 0 (0.0%) |
| $30,000 to $34,999 | 5 (8.6%) | 10 (14.5%) |
| $35,000 to $39,999 | 0 (0.0%) | 0 (0.0%) |
| $40,000 to $44,999 | 0 (0.0%) | 10 (14.5%) |
| $45,000 to $49,999 | 0 (0.0%) | 16 (23.2%) |
| $50,000 to $54,999 | 14 (24.1%) | 0 (0.0%) |
| $55,000 to $64,999 | 0 (0.0%) | 0 (0.0%) |
| $65,000 to $74,999 | 13 (22.4%) | 14 (20.3%) |
| $75,000 to $99,999 | 0 (0.0%) | 0 (0.0%) |
| $100,000+ | 16 (27.6%) | 6 (8.7%) |
| Total | 58 (100.0%) | 69 (100.0%) |
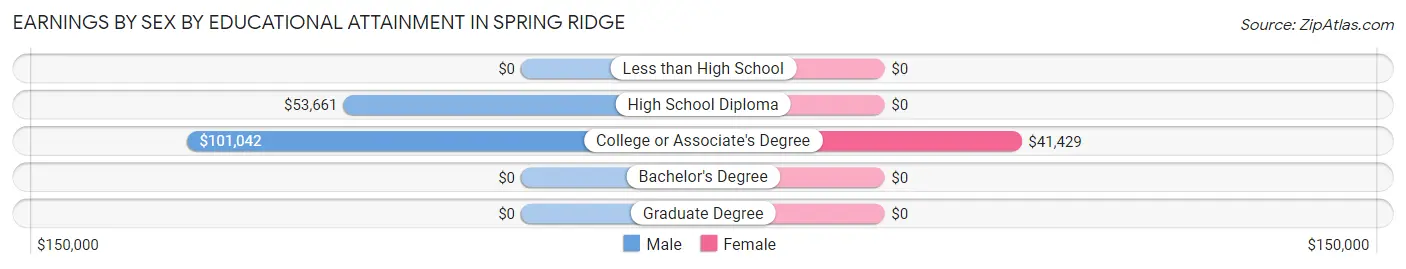
Earnings by Sex by Educational Attainment in Spring Ridge
| Educational Attainment | Male Income | Female Income |
| Less than High School | - | - |
| High School Diploma | $53,661 | $0 |
| College or Associate's Degree | $101,042 | $41,429 |
| Bachelor's Degree | - | - |
| Graduate Degree | - | - |
| Total | - | - |
Family Income in Spring Ridge
Family Income Brackets in Spring Ridge
According to the Spring Ridge family income data, there are 29 families falling into the $35,000 to $49,999 income range, which is the most common income bracket and makes up 33.0% of all families.
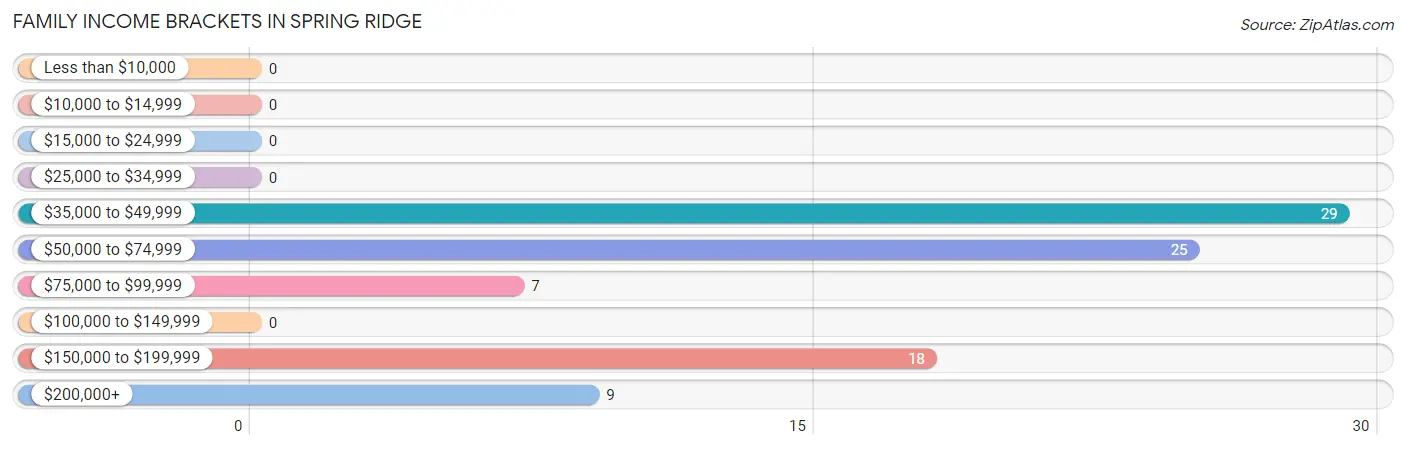
| Income Bracket | # Families | % Families |
| Less than $10,000 | 0 | 0.0% |
| $10,000 to $14,999 | 0 | 0.0% |
| $15,000 to $24,999 | 0 | 0.0% |
| $25,000 to $34,999 | 0 | 0.0% |
| $35,000 to $49,999 | 29 | 33.0% |
| $50,000 to $74,999 | 25 | 28.4% |
| $75,000 to $99,999 | 7 | 8.0% |
| $100,000 to $149,999 | 0 | 0.0% |
| $150,000 to $199,999 | 18 | 20.5% |
| $200,000+ | 9 | 10.2% |
Family Income by Famaliy Size in Spring Ridge
2-person families (54 | 61.4%) account for the highest median family income in Spring Ridge with $71,250 per family, while 2-person families (54 | 61.4%) have the highest median income of $35,625 per family member.
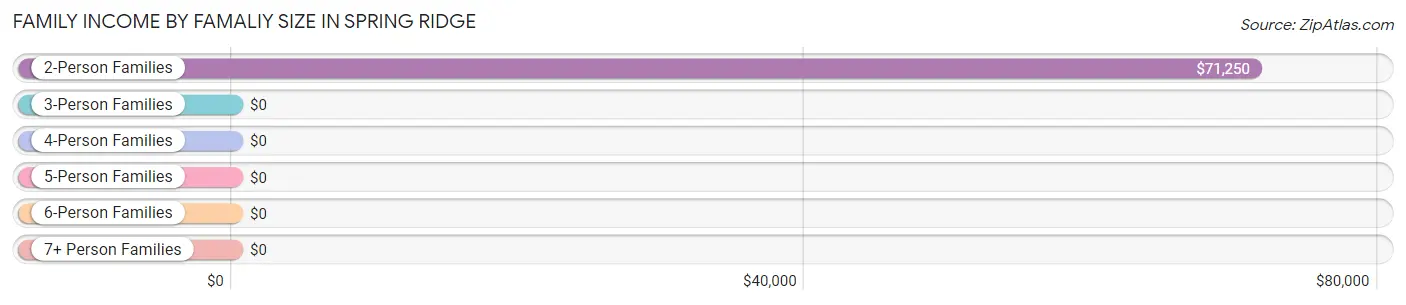
| Income Bracket | # Families | Median Income |
| 2-Person Families | 54 (61.4%) | $71,250 |
| 3-Person Families | 24 (27.3%) | $0 |
| 4-Person Families | 10 (11.4%) | $0 |
| 5-Person Families | 0 (0.0%) | $0 |
| 6-Person Families | 0 (0.0%) | $0 |
| 7+ Person Families | 0 (0.0%) | $0 |
| Total | 88 (100.0%) | $60,357 |
Family Income by Number of Earners in Spring Ridge
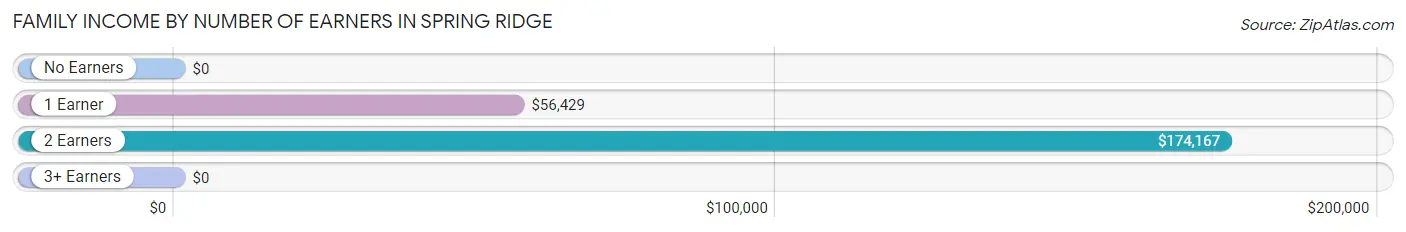
| Number of Earners | # Families | Median Income |
| No Earners | 4 (4.5%) | $0 |
| 1 Earner | 58 (65.9%) | $56,429 |
| 2 Earners | 22 (25.0%) | $174,167 |
| 3+ Earners | 4 (4.5%) | $0 |
| Total | 88 (100.0%) | $60,357 |
Household Income in Spring Ridge
Household Income Brackets in Spring Ridge
With 29 households falling in the category, the $35,000 to $49,999 income range is the most frequent in Spring Ridge, accounting for 24.0% of all households.
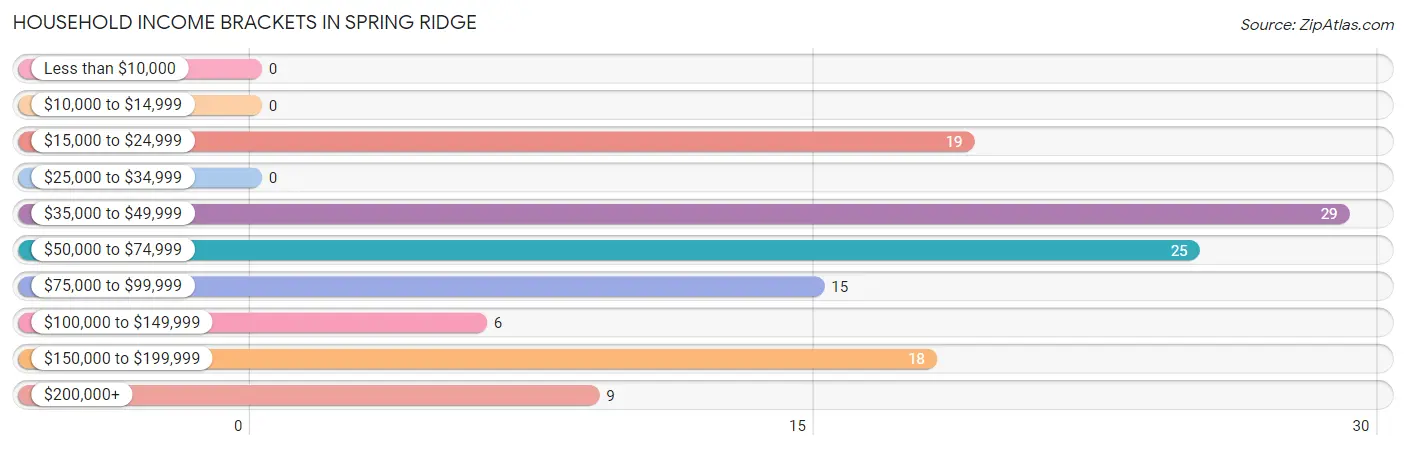
| Income Bracket | # Households | % Households |
| Less than $10,000 | 0 | 0.0% |
| $10,000 to $14,999 | 0 | 0.0% |
| $15,000 to $24,999 | 19 | 15.7% |
| $25,000 to $34,999 | 0 | 0.0% |
| $35,000 to $49,999 | 29 | 24.0% |
| $50,000 to $74,999 | 25 | 20.7% |
| $75,000 to $99,999 | 15 | 12.4% |
| $100,000 to $149,999 | 6 | 5.0% |
| $150,000 to $199,999 | 18 | 14.9% |
| $200,000+ | 9 | 7.4% |
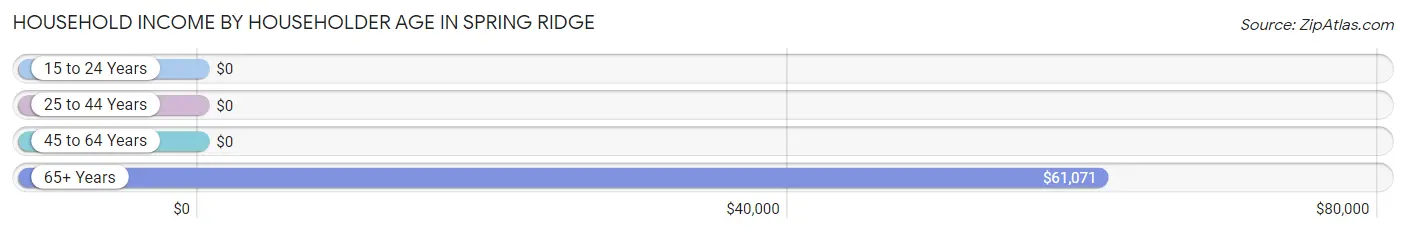
Household Income by Householder Age in Spring Ridge
The median household income in Spring Ridge is $57,232, with the highest median household income of $61,071 found in the 65+ years age bracket for the primary householder. A total of 24 households (19.8%) fall into this category. Meanwhile, the 15 to 24 years age bracket for the primary householder has the lowest median household income of $0, with 6 households (5.0%) in this group.
| Income Bracket | # Households | Median Income |
| 15 to 24 Years | 6 (5.0%) | $0 |
| 25 to 44 Years | 23 (19.0%) | $0 |
| 45 to 64 Years | 68 (56.2%) | $0 |
| 65+ Years | 24 (19.8%) | $61,071 |
| Total | 121 (100.0%) | $57,232 |
Poverty in Spring Ridge
Income Below Poverty by Sex and Age in Spring Ridge
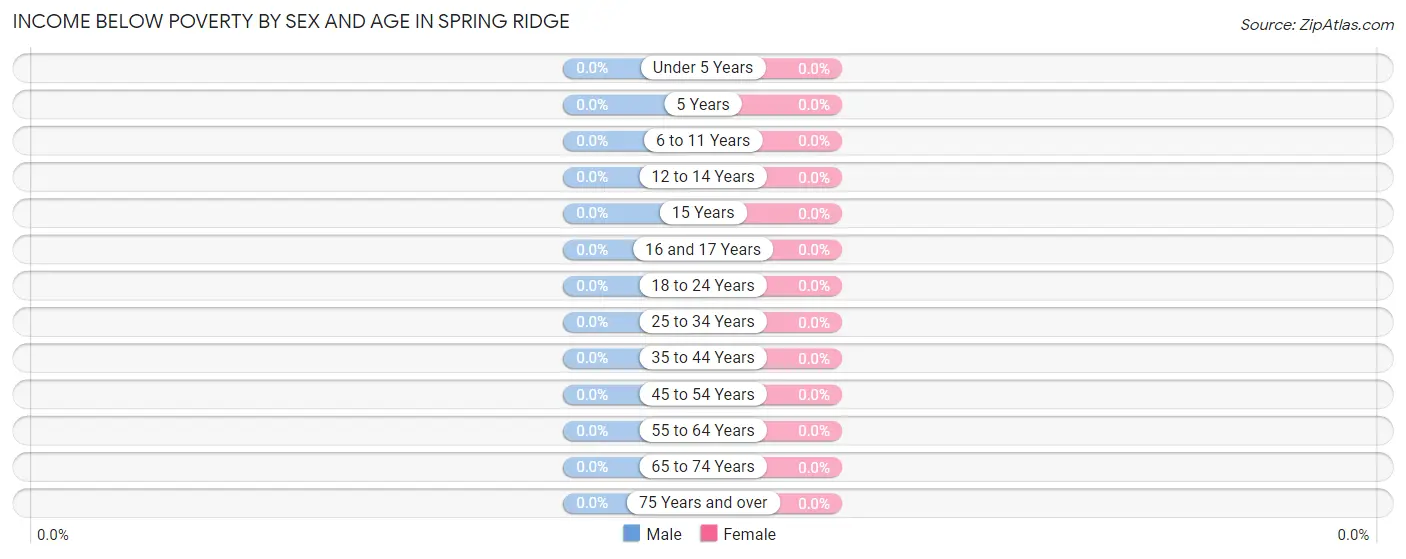
| Age Bracket | Male | Female |
| Under 5 Years | 0 (0.0%) | 0 (0.0%) |
| 5 Years | 0 (0.0%) | 0 (0.0%) |
| 6 to 11 Years | 0 (0.0%) | 0 (0.0%) |
| 12 to 14 Years | 0 (0.0%) | 0 (0.0%) |
| 15 Years | 0 (0.0%) | 0 (0.0%) |
| 16 and 17 Years | 0 (0.0%) | 0 (0.0%) |
| 18 to 24 Years | 0 (0.0%) | 0 (0.0%) |
| 25 to 34 Years | 0 (0.0%) | 0 (0.0%) |
| 35 to 44 Years | 0 (0.0%) | 0 (0.0%) |
| 45 to 54 Years | 0 (0.0%) | 0 (0.0%) |
| 55 to 64 Years | 0 (0.0%) | 0 (0.0%) |
| 65 to 74 Years | 0 (0.0%) | 0 (0.0%) |
| 75 Years and over | 0 (0.0%) | 0 (0.0%) |
| Total | 0 (0.0%) | 0 (0.0%) |
Income Above Poverty by Sex and Age in Spring Ridge
According to the poverty statistics in Spring Ridge, males aged under 5 years and females aged under 5 years are the age groups that are most secure financially, with 100.0% of males and 100.0% of females in these age groups living above the poverty line.
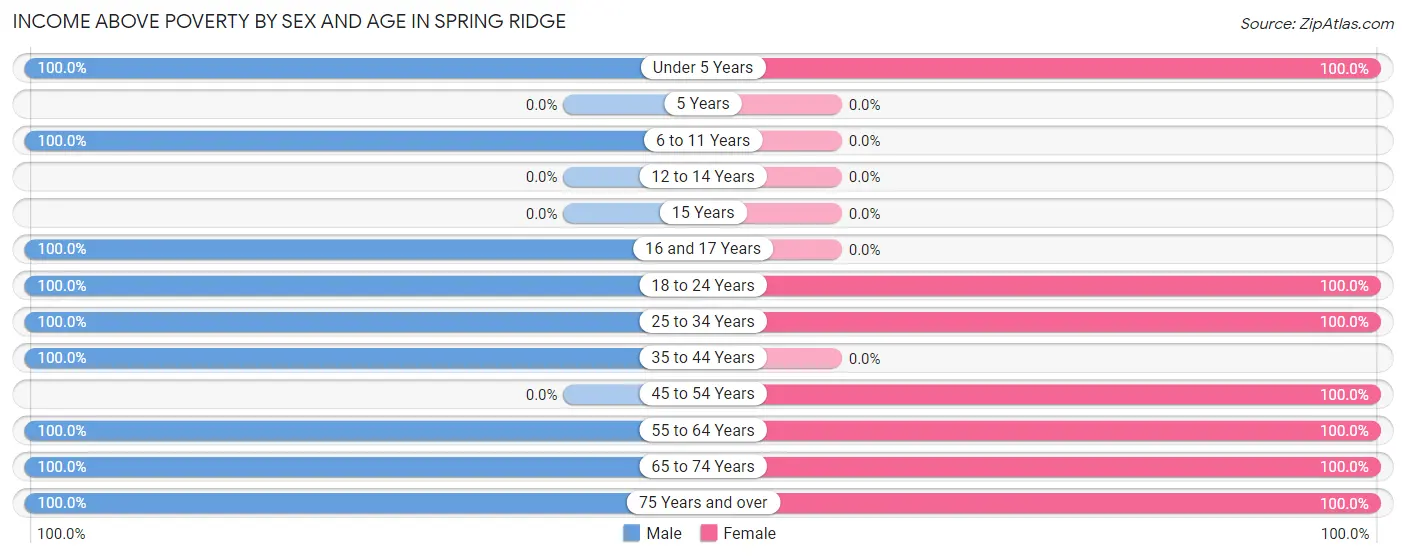
| Age Bracket | Male | Female |
| Under 5 Years | 23 (100.0%) | 11 (100.0%) |
| 5 Years | 0 (0.0%) | 0 (0.0%) |
| 6 to 11 Years | 14 (100.0%) | 0 (0.0%) |
| 12 to 14 Years | 0 (0.0%) | 0 (0.0%) |
| 15 Years | 0 (0.0%) | 0 (0.0%) |
| 16 and 17 Years | 6 (100.0%) | 0 (0.0%) |
| 18 to 24 Years | 9 (100.0%) | 12 (100.0%) |
| 25 to 34 Years | 20 (100.0%) | 22 (100.0%) |
| 35 to 44 Years | 3 (100.0%) | 0 (0.0%) |
| 45 to 54 Years | 0 (0.0%) | 11 (100.0%) |
| 55 to 64 Years | 35 (100.0%) | 44 (100.0%) |
| 65 to 74 Years | 11 (100.0%) | 13 (100.0%) |
| 75 Years and over | 8 (100.0%) | 14 (100.0%) |
| Total | 129 (100.0%) | 127 (100.0%) |
Income Below Poverty Among Married-Couple Families in Spring Ridge
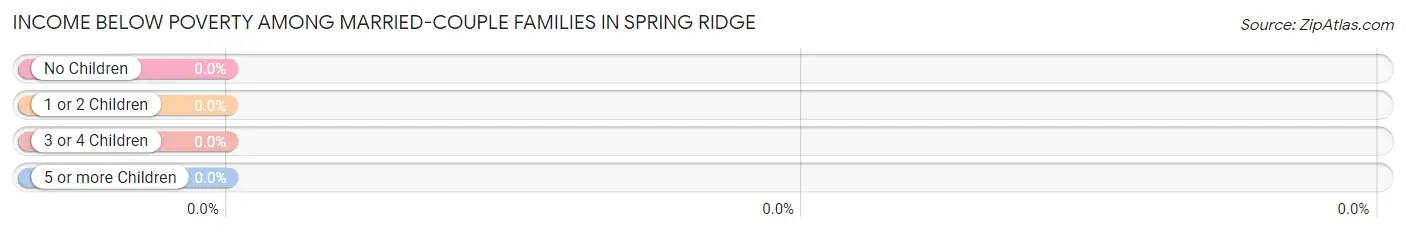
| Children | Above Poverty | Below Poverty |
| No Children | 31 (100.0%) | 0 (0.0%) |
| 1 or 2 Children | 27 (100.0%) | 0 (0.0%) |
| 3 or 4 Children | 0 (0.0%) | 0 (0.0%) |
| 5 or more Children | 0 (0.0%) | 0 (0.0%) |
| Total | 58 (100.0%) | 0 (0.0%) |
Income Below Poverty Among Single-Parent Households in Spring Ridge
| Children | Single Father | Single Mother |
| No Children | 0 (0.0%) | 0 (0.0%) |
| 1 or 2 Children | 0 (0.0%) | 0 (0.0%) |
| 3 or 4 Children | 0 (0.0%) | 0 (0.0%) |
| 5 or more Children | 0 (0.0%) | 0 (0.0%) |
| Total | 0 (0.0%) | 0 (0.0%) |
Income Below Poverty Among Married-Couple vs Single-Parent Households in Spring Ridge
| Children | Married-Couple Families | Single-Parent Households |
| No Children | 0 (0.0%) | 0 (0.0%) |
| 1 or 2 Children | 0 (0.0%) | 0 (0.0%) |
| 3 or 4 Children | 0 (0.0%) | 0 (0.0%) |
| 5 or more Children | 0 (0.0%) | 0 (0.0%) |
| Total | 0 (0.0%) | 0 (0.0%) |
Race in Spring Ridge
The most populous races in Spring Ridge are White / Caucasian (248 | 96.9%), Hispanic or Latino (33 | 12.9%), and Two or more Races (8 | 3.1%).
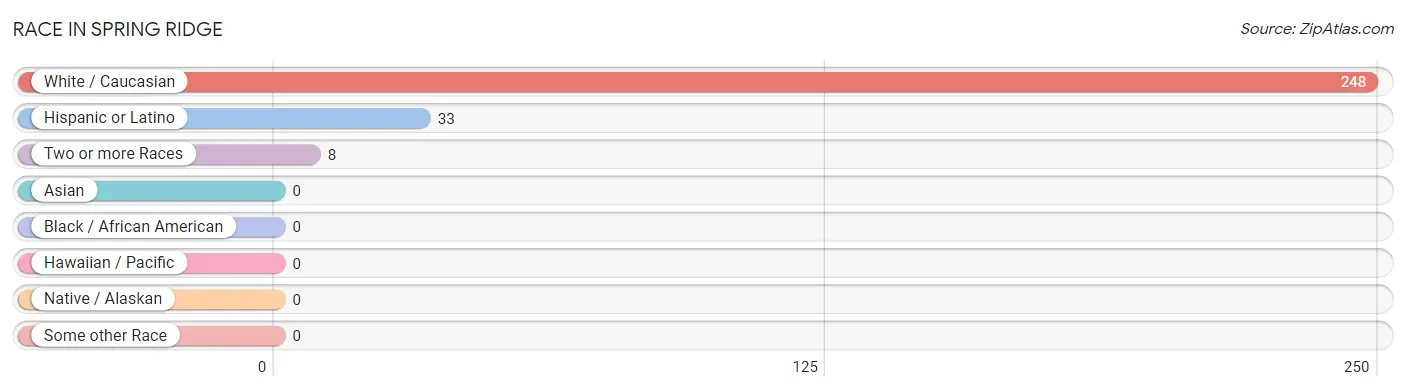
| Race | # Population | % Population |
| Asian | 0 | 0.0% |
| Black / African American | 0 | 0.0% |
| Hawaiian / Pacific | 0 | 0.0% |
| Hispanic or Latino | 33 | 12.9% |
| Native / Alaskan | 0 | 0.0% |
| White / Caucasian | 248 | 96.9% |
| Two or more Races | 8 | 3.1% |
| Some other Race | 0 | 0.0% |
| Total | 256 | 100.0% |
Ancestry in Spring Ridge
The most populous ancestries reported in Spring Ridge are English (52 | 20.3%), German (45 | 17.6%), Irish (28 | 10.9%), Cuban (25 | 9.8%), and Welsh (17 | 6.6%), together accounting for 65.2% of all Spring Ridge residents.
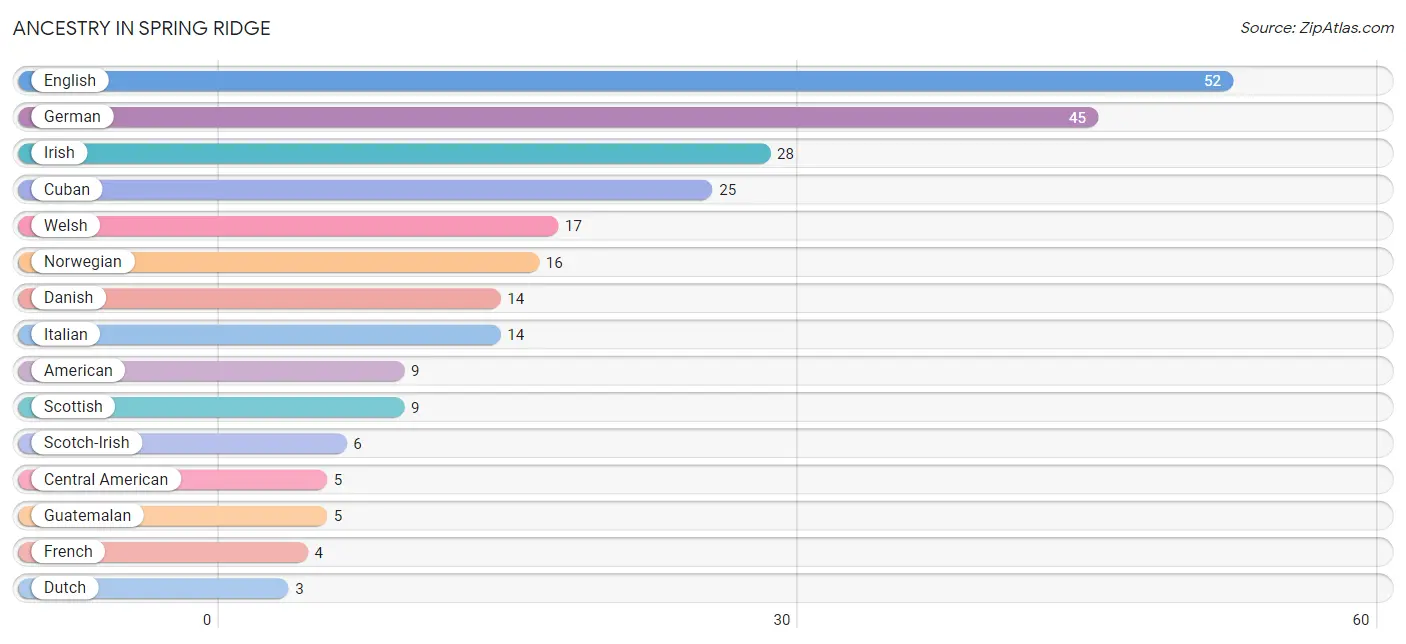
| Ancestry | # Population | % Population |
| American | 9 | 3.5% |
| Central American | 5 | 1.9% |
| Cuban | 25 | 9.8% |
| Danish | 14 | 5.5% |
| Dutch | 3 | 1.2% |
| English | 52 | 20.3% |
| French | 4 | 1.6% |
| German | 45 | 17.6% |
| Guatemalan | 5 | 1.9% |
| Irish | 28 | 10.9% |
| Italian | 14 | 5.5% |
| Mexican | 3 | 1.2% |
| Norwegian | 16 | 6.2% |
| Scotch-Irish | 6 | 2.3% |
| Scottish | 9 | 3.5% |
| Welsh | 17 | 6.6% | View All 16 Rows |
Immigrants in Spring Ridge

| Immigration Origin | # Population | % Population | View All 0 Rows |
Sex and Age in Spring Ridge
Sex and Age in Spring Ridge
The most populous age groups in Spring Ridge are 60 to 64 Years (27 | 20.9%) for men and 60 to 64 Years (28 | 22.1%) for women.
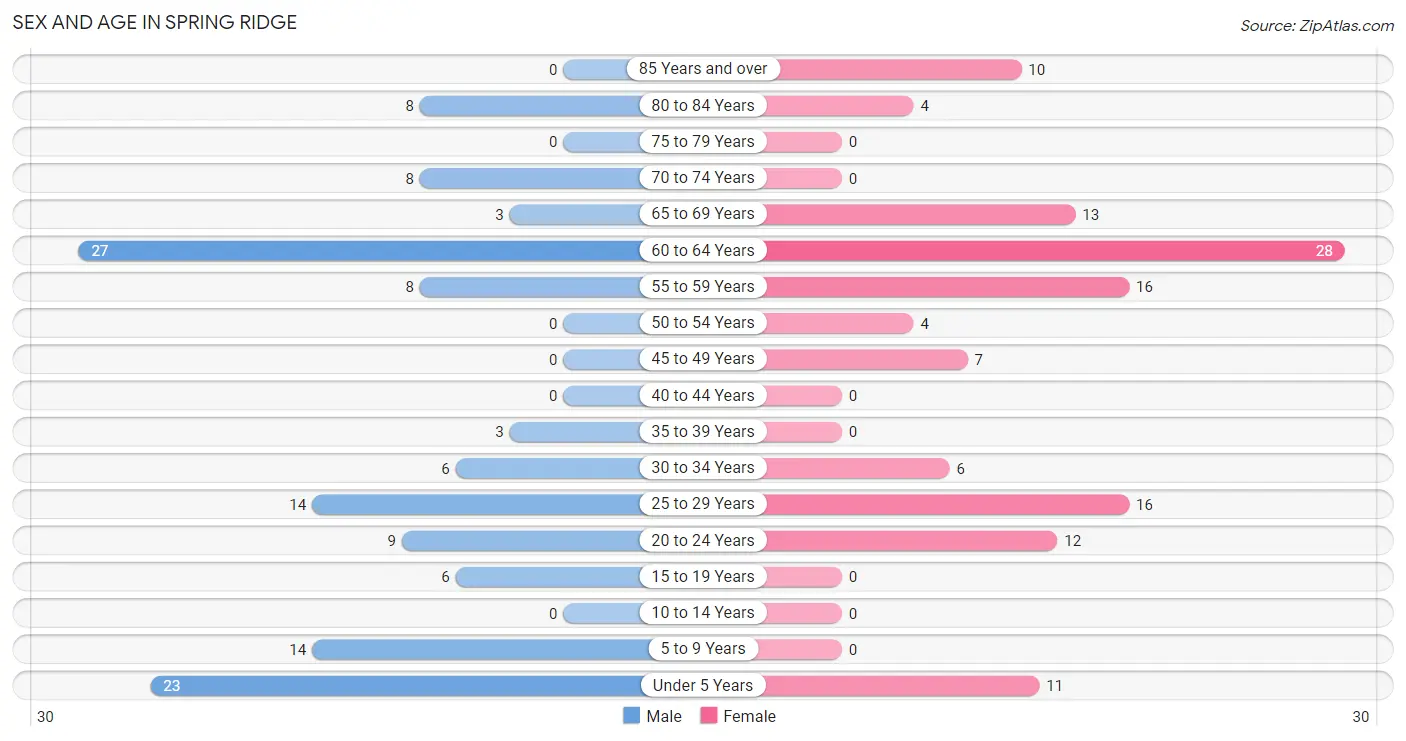
| Age Bracket | Male | Female |
| Under 5 Years | 23 (17.8%) | 11 (8.7%) |
| 5 to 9 Years | 14 (10.8%) | 0 (0.0%) |
| 10 to 14 Years | 0 (0.0%) | 0 (0.0%) |
| 15 to 19 Years | 6 (4.6%) | 0 (0.0%) |
| 20 to 24 Years | 9 (7.0%) | 12 (9.5%) |
| 25 to 29 Years | 14 (10.8%) | 16 (12.6%) |
| 30 to 34 Years | 6 (4.6%) | 6 (4.7%) |
| 35 to 39 Years | 3 (2.3%) | 0 (0.0%) |
| 40 to 44 Years | 0 (0.0%) | 0 (0.0%) |
| 45 to 49 Years | 0 (0.0%) | 7 (5.5%) |
| 50 to 54 Years | 0 (0.0%) | 4 (3.2%) |
| 55 to 59 Years | 8 (6.2%) | 16 (12.6%) |
| 60 to 64 Years | 27 (20.9%) | 28 (22.1%) |
| 65 to 69 Years | 3 (2.3%) | 13 (10.2%) |
| 70 to 74 Years | 8 (6.2%) | 0 (0.0%) |
| 75 to 79 Years | 0 (0.0%) | 0 (0.0%) |
| 80 to 84 Years | 8 (6.2%) | 4 (3.2%) |
| 85 Years and over | 0 (0.0%) | 10 (7.9%) |
| Total | 129 (100.0%) | 127 (100.0%) |
Families and Households in Spring Ridge
Median Family Size in Spring Ridge
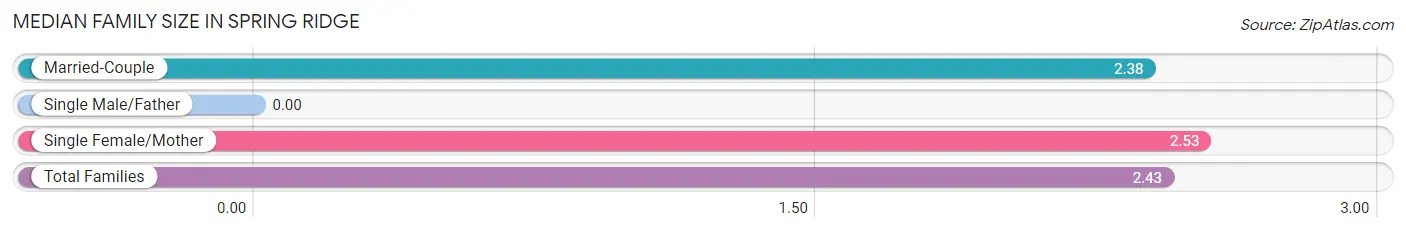
| Family Type | # Families | Family Size |
| Married-Couple | 58 (65.9%) | 2.38 |
| Single Male/Father | 0 (0.0%) | - |
| Single Female/Mother | 30 (34.1%) | 2.53 |
| Total Families | 88 (100.0%) | 2.43 |
Median Household Size in Spring Ridge
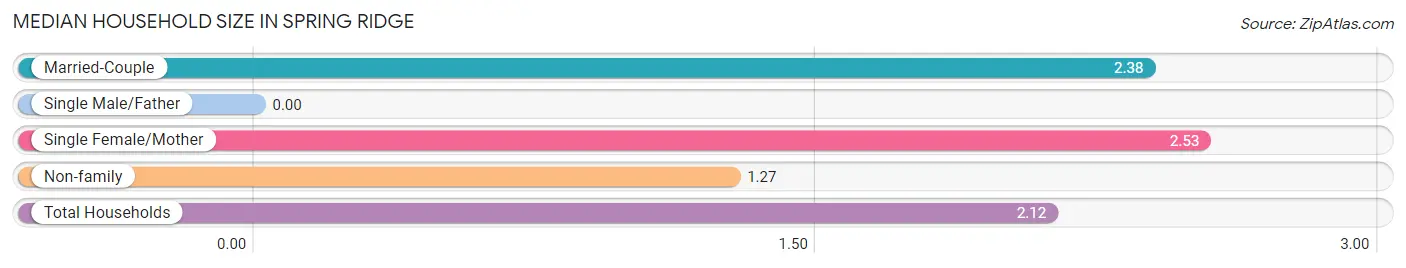
| Household Type | # Households | Household Size |
| Married-Couple | 58 (47.9%) | 2.38 |
| Single Male/Father | 0 (0.0%) | - |
| Single Female/Mother | 30 (24.8%) | 2.53 |
| Non-family | 33 (27.3%) | 1.27 |
| Total Households | 121 (100.0%) | 2.12 |
Household Size by Marriage Status in Spring Ridge
Out of a total of 121 households in Spring Ridge, 88 (72.7%) are family households, while 33 (27.3%) are nonfamily households. The most numerous type of family households are 2-person households, comprising 54, and the most common type of nonfamily households are 1-person households, comprising 27.
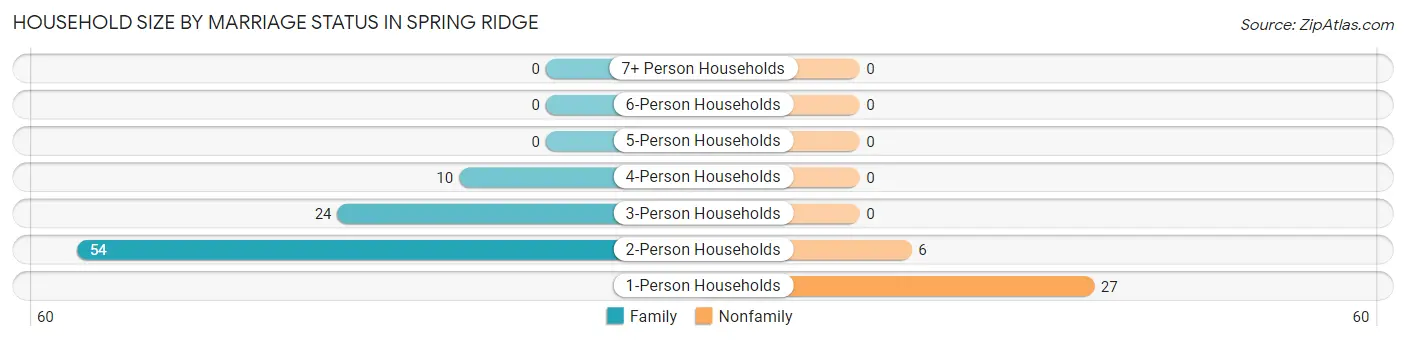
| Household Size | Family Households | Nonfamily Households |
| 1-Person Households | - | 27 (22.3%) |
| 2-Person Households | 54 (44.6%) | 6 (5.0%) |
| 3-Person Households | 24 (19.8%) | 0 (0.0%) |
| 4-Person Households | 10 (8.3%) | 0 (0.0%) |
| 5-Person Households | 0 (0.0%) | 0 (0.0%) |
| 6-Person Households | 0 (0.0%) | 0 (0.0%) |
| 7+ Person Households | 0 (0.0%) | 0 (0.0%) |
| Total | 88 (72.7%) | 33 (27.3%) |
Female Fertility in Spring Ridge
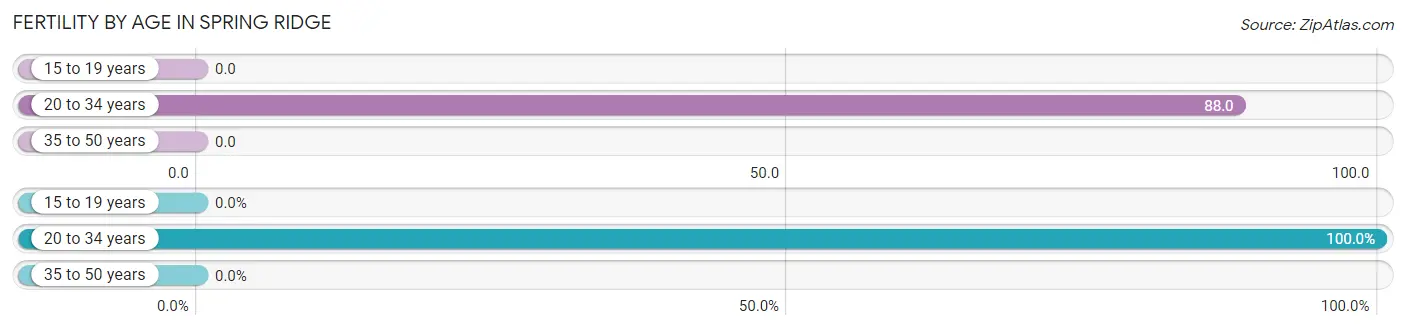
Fertility by Age in Spring Ridge
Average fertility rate in Spring Ridge is 73.0 births per 1,000 women. Women in the age bracket of 20 to 34 years have the highest fertility rate with 88.0 births per 1,000 women. Women in the age bracket of 20 to 34 years acount for 100.0% of all women with births.
| Age Bracket | Women with Births | Births / 1,000 Women |
| 15 to 19 years | 0 (0.0%) | 0.0 |
| 20 to 34 years | 3 (100.0%) | 88.0 |
| 35 to 50 years | 0 (0.0%) | 0.0 |
| Total | 3 (100.0%) | 73.0 |
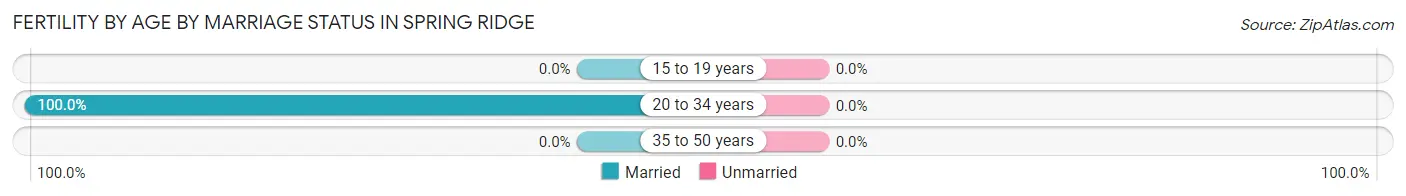
Fertility by Age by Marriage Status in Spring Ridge
| Age Bracket | Married | Unmarried |
| 15 to 19 years | 0 (0.0%) | 0 (0.0%) |
| 20 to 34 years | 3 (100.0%) | 0 (0.0%) |
| 35 to 50 years | 0 (0.0%) | 0 (0.0%) |
| Total | 3 (100.0%) | 0 (0.0%) |
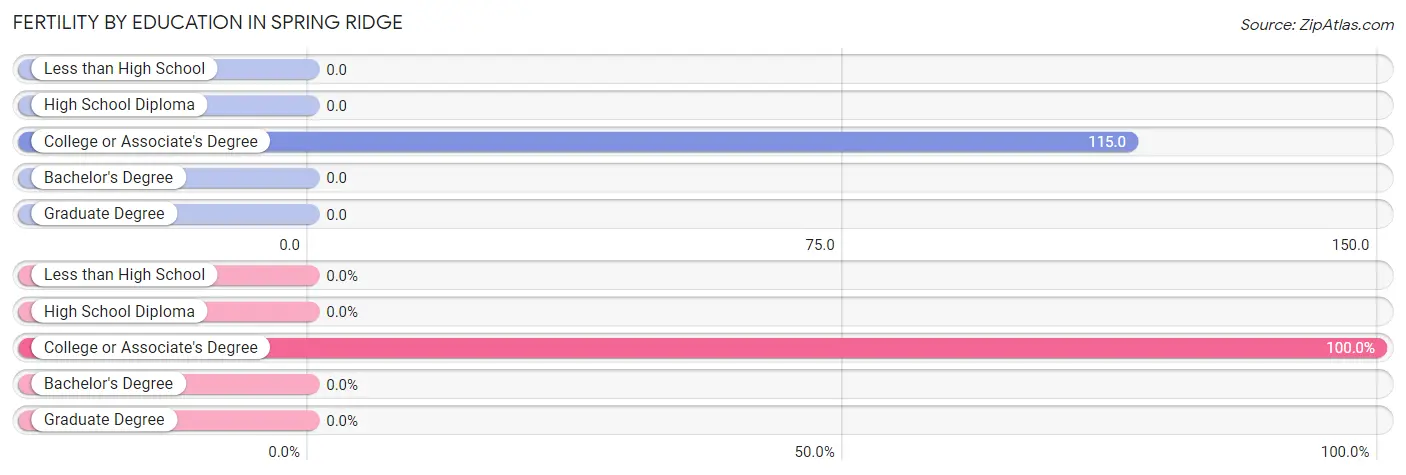
Fertility by Education in Spring Ridge
| Educational Attainment | Women with Births | Births / 1,000 Women |
| Less than High School | 0 (0.0%) | 0.0 |
| High School Diploma | 0 (0.0%) | 0.0 |
| College or Associate's Degree | 3 (100.0%) | 115.0 |
| Bachelor's Degree | 0 (0.0%) | 0.0 |
| Graduate Degree | 0 (0.0%) | 0.0 |
| Total | 3 (100.0%) | 73.0 |
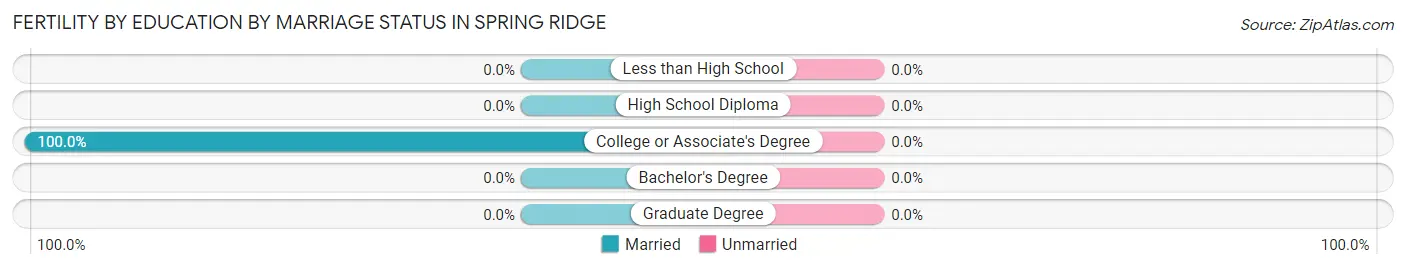
Fertility by Education by Marriage Status in Spring Ridge
| Educational Attainment | Married | Unmarried |
| Less than High School | 0 (0.0%) | 0 (0.0%) |
| High School Diploma | 0 (0.0%) | 0 (0.0%) |
| College or Associate's Degree | 3 (100.0%) | 0 (0.0%) |
| Bachelor's Degree | 0 (0.0%) | 0 (0.0%) |
| Graduate Degree | 0 (0.0%) | 0 (0.0%) |
| Total | 3 (100.0%) | 0 (0.0%) |
Employment Characteristics in Spring Ridge
Employment by Class of Employer in Spring Ridge
Among the 89 employed individuals in Spring Ridge, private company employees (38 | 42.7%), self-employed (incorporated) (24 | 27.0%), and state government employees (16 | 18.0%) make up the most common classes of employment.
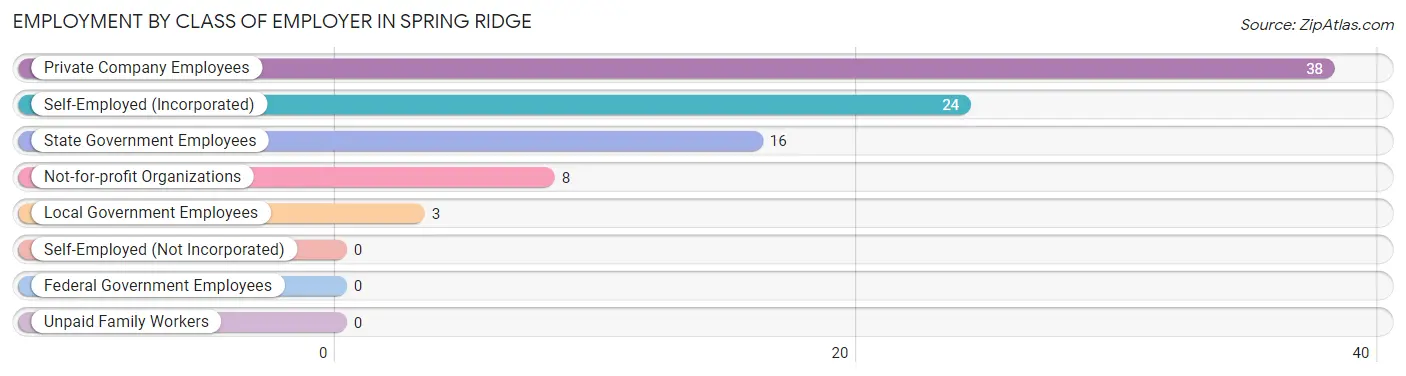
| Employer Class | # Employees | % Employees |
| Private Company Employees | 38 | 42.7% |
| Self-Employed (Incorporated) | 24 | 27.0% |
| Self-Employed (Not Incorporated) | 0 | 0.0% |
| Not-for-profit Organizations | 8 | 9.0% |
| Local Government Employees | 3 | 3.4% |
| State Government Employees | 16 | 18.0% |
| Federal Government Employees | 0 | 0.0% |
| Unpaid Family Workers | 0 | 0.0% |
| Total | 89 | 100.0% |
Employment Status by Age in Spring Ridge
According to the labor force statistics for Spring Ridge, out of the total population over 16 years of age (208), 56.3% or 117 individuals are in the labor force, with 12.0% or 14 of them unemployed. The age group with the highest labor force participation rate is 30 to 34 years, with 100.0% or 12 individuals in the labor force. Within the labor force, the 25 to 29 years age range has the highest percentage of unemployed individuals, with 100.0% or 14 of them being unemployed.
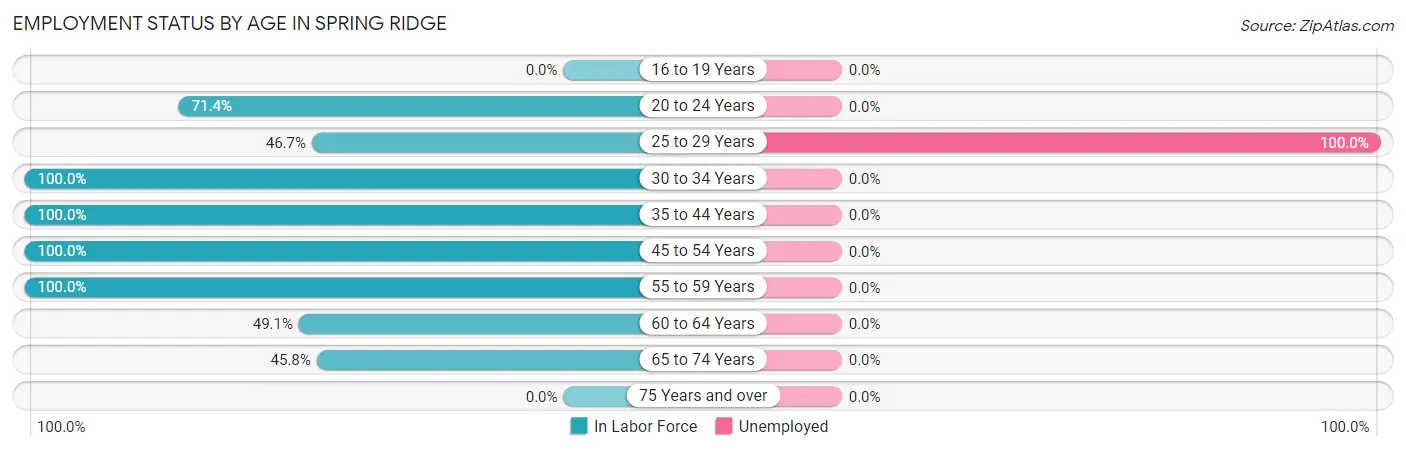
| Age Bracket | In Labor Force | Unemployed |
| 16 to 19 Years | 0 (0.0%) | 0 (0.0%) |
| 20 to 24 Years | 15 (71.4%) | 0 (0.0%) |
| 25 to 29 Years | 14 (46.7%) | 14 (100.0%) |
| 30 to 34 Years | 12 (100.0%) | 0 (0.0%) |
| 35 to 44 Years | 3 (100.0%) | 0 (0.0%) |
| 45 to 54 Years | 11 (100.0%) | 0 (0.0%) |
| 55 to 59 Years | 24 (100.0%) | 0 (0.0%) |
| 60 to 64 Years | 27 (49.1%) | 0 (0.0%) |
| 65 to 74 Years | 11 (45.8%) | 0 (0.0%) |
| 75 Years and over | 0 (0.0%) | 0 (0.0%) |
| Total | 117 (56.3%) | 14 (12.0%) |
Employment Status by Educational Attainment in Spring Ridge
According to labor force statistics for Spring Ridge, 67.4% of individuals (91) out of the total population between 25 and 64 years of age (135) are in the labor force, with 15.4% or 14 of them being unemployed. The group with the highest labor force participation rate are those with the educational attainment of less than high school, with 100.0% or 4 individuals in the labor force. Within the labor force, individuals with high school diploma education have the highest percentage of unemployment, with 51.9% or 14 of them being unemployed.
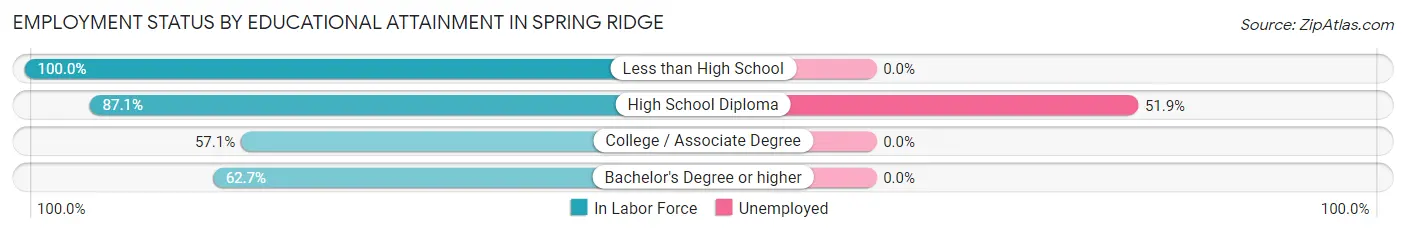
| Educational Attainment | In Labor Force | Unemployed |
| Less than High School | 4 (100.0%) | 0 (0.0%) |
| High School Diploma | 27 (87.1%) | 16 (51.9%) |
| College / Associate Degree | 28 (57.1%) | 0 (0.0%) |
| Bachelor's Degree or higher | 32 (62.7%) | 0 (0.0%) |
| Total | 91 (67.4%) | 21 (15.4%) |
Employment Occupations by Sex in Spring Ridge
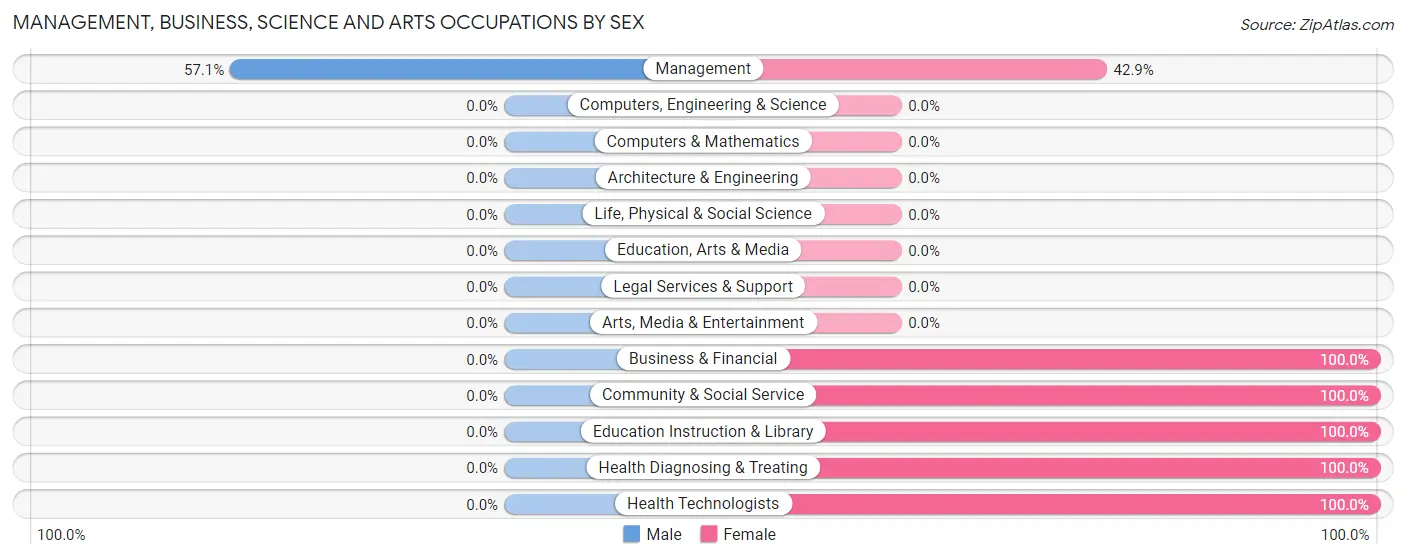
Management, Business, Science and Arts Occupations
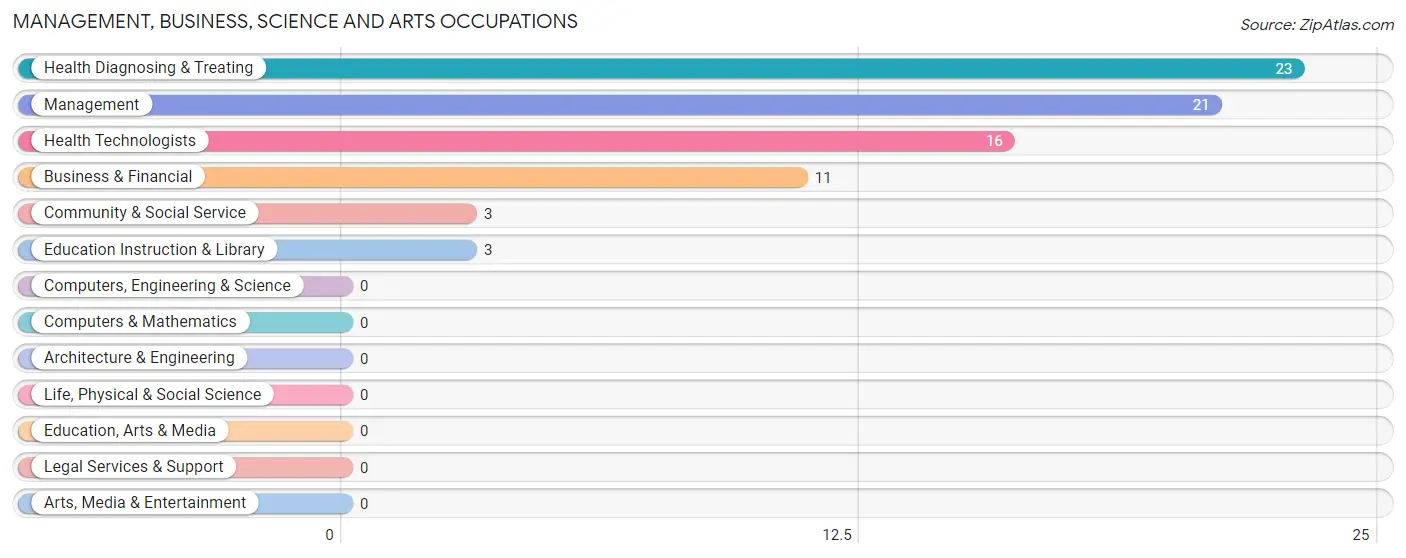
The most common Management, Business, Science and Arts occupations in Spring Ridge are Health Diagnosing & Treating (23 | 22.3%), Management (21 | 20.4%), Health Technologists (16 | 15.5%), Business & Financial (11 | 10.7%), and Community & Social Service (3 | 2.9%).
Management, Business, Science and Arts Occupations by Sex
| Occupation | Male | Female |
| Management | 12 (57.1%) | 9 (42.9%) |
| Business & Financial | 0 (0.0%) | 11 (100.0%) |
| Computers, Engineering & Science | 0 (0.0%) | 0 (0.0%) |
| Computers & Mathematics | 0 (0.0%) | 0 (0.0%) |
| Architecture & Engineering | 0 (0.0%) | 0 (0.0%) |
| Life, Physical & Social Science | 0 (0.0%) | 0 (0.0%) |
| Community & Social Service | 0 (0.0%) | 3 (100.0%) |
| Education, Arts & Media | 0 (0.0%) | 0 (0.0%) |
| Legal Services & Support | 0 (0.0%) | 0 (0.0%) |
| Education Instruction & Library | 0 (0.0%) | 3 (100.0%) |
| Arts, Media & Entertainment | 0 (0.0%) | 0 (0.0%) |
| Health Diagnosing & Treating | 0 (0.0%) | 23 (100.0%) |
| Health Technologists | 0 (0.0%) | 16 (100.0%) |
| Total (Category) | 12 (20.7%) | 46 (79.3%) |
| Total (Overall) | 38 (36.9%) | 65 (63.1%) |
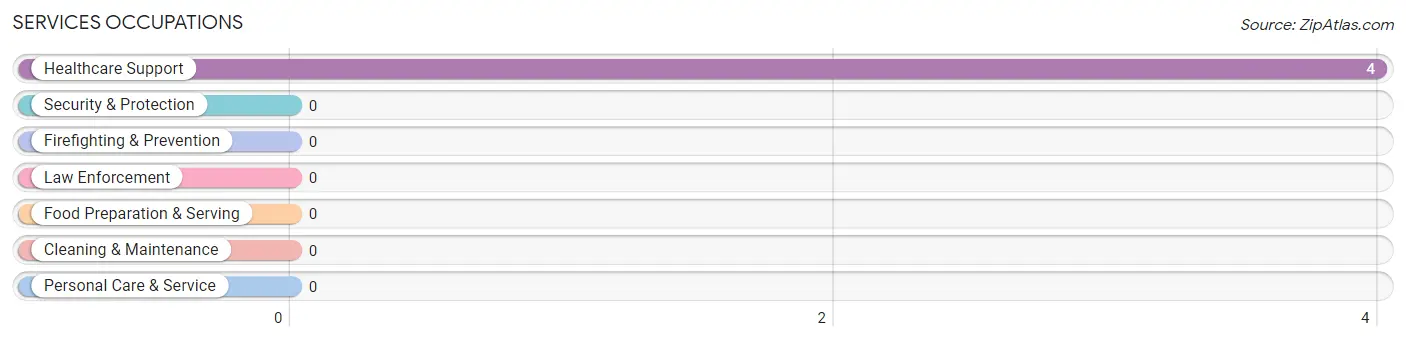
Services Occupations
The most common Services occupations in Spring Ridge are , and Healthcare Support (4 | 3.9%).
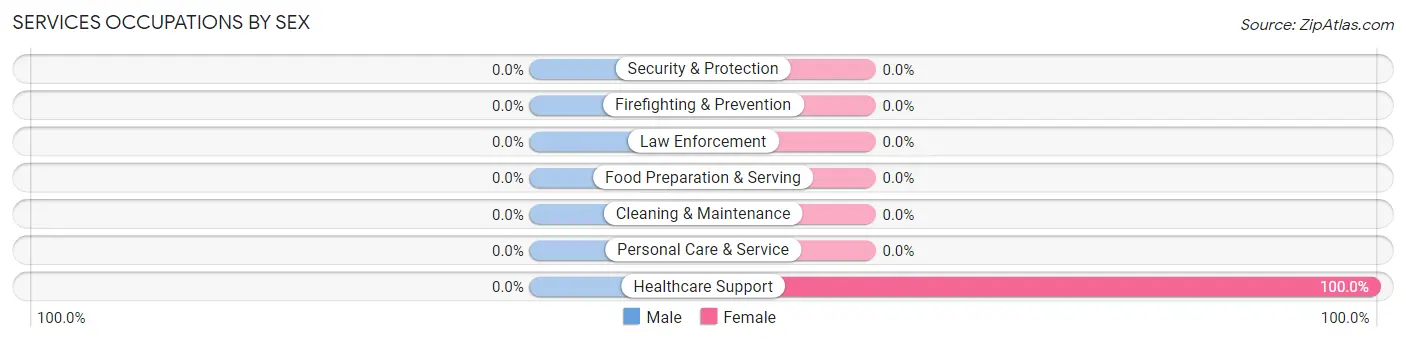
Services Occupations by Sex
| Occupation | Male | Female |
| Healthcare Support | 0 (0.0%) | 4 (100.0%) |
| Security & Protection | 0 (0.0%) | 0 (0.0%) |
| Firefighting & Prevention | 0 (0.0%) | 0 (0.0%) |
| Law Enforcement | 0 (0.0%) | 0 (0.0%) |
| Food Preparation & Serving | 0 (0.0%) | 0 (0.0%) |
| Cleaning & Maintenance | 0 (0.0%) | 0 (0.0%) |
| Personal Care & Service | 0 (0.0%) | 0 (0.0%) |
| Total (Category) | 0 (0.0%) | 4 (100.0%) |
| Total (Overall) | 38 (36.9%) | 65 (63.1%) |
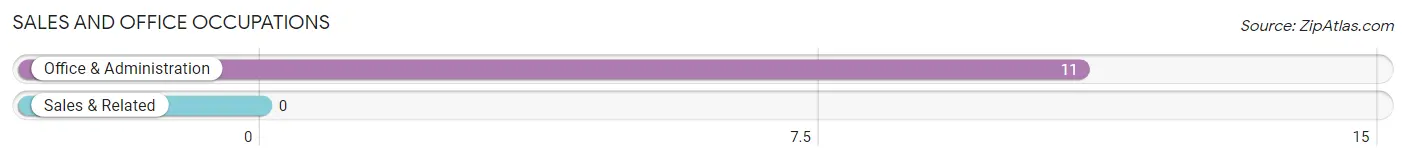
Sales and Office Occupations
The most common Sales and Office occupations in Spring Ridge are , and Office & Administration (11 | 10.7%).
Sales and Office Occupations by Sex
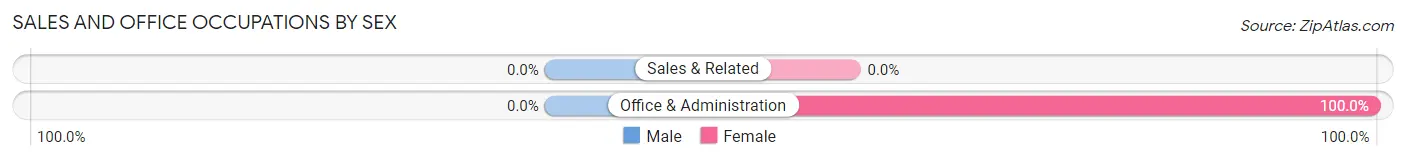
| Occupation | Male | Female |
| Sales & Related | 0 (0.0%) | 0 (0.0%) |
| Office & Administration | 0 (0.0%) | 11 (100.0%) |
| Total (Category) | 0 (0.0%) | 11 (100.0%) |
| Total (Overall) | 38 (36.9%) | 65 (63.1%) |
Natural Resources, Construction and Maintenance Occupations
The most common Natural Resources, Construction and Maintenance occupations in Spring Ridge are , and Construction & Extraction (15 | 14.6%).
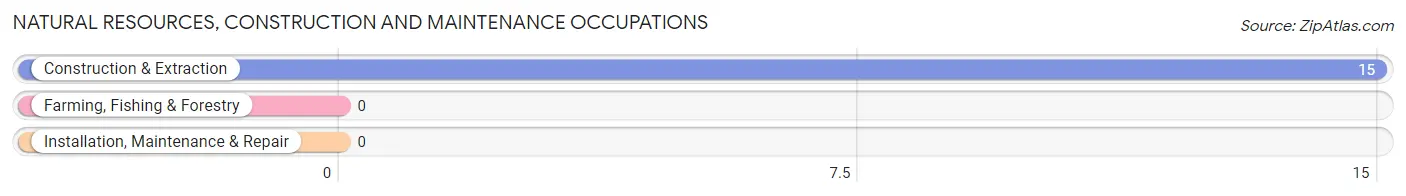
Natural Resources, Construction and Maintenance Occupations by Sex
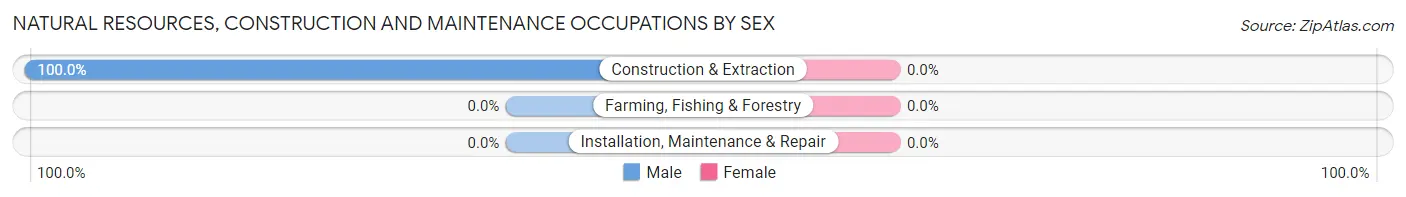
| Occupation | Male | Female |
| Farming, Fishing & Forestry | 0 (0.0%) | 0 (0.0%) |
| Construction & Extraction | 15 (100.0%) | 0 (0.0%) |
| Installation, Maintenance & Repair | 0 (0.0%) | 0 (0.0%) |
| Total (Category) | 15 (100.0%) | 0 (0.0%) |
| Total (Overall) | 38 (36.9%) | 65 (63.1%) |
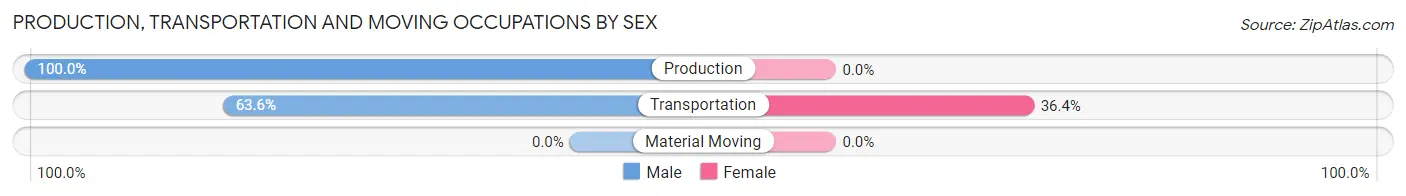
Production, Transportation and Moving Occupations
The most common Production, Transportation and Moving occupations in Spring Ridge are Transportation (11 | 10.7%), and Production (4 | 3.9%).
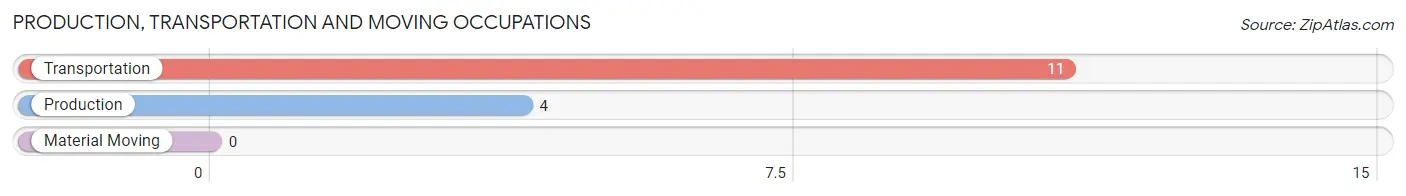
Production, Transportation and Moving Occupations by Sex
| Occupation | Male | Female |
| Production | 4 (100.0%) | 0 (0.0%) |
| Transportation | 7 (63.6%) | 4 (36.4%) |
| Material Moving | 0 (0.0%) | 0 (0.0%) |
| Total (Category) | 11 (73.3%) | 4 (26.7%) |
| Total (Overall) | 38 (36.9%) | 65 (63.1%) |
Employment Industries by Sex in Spring Ridge
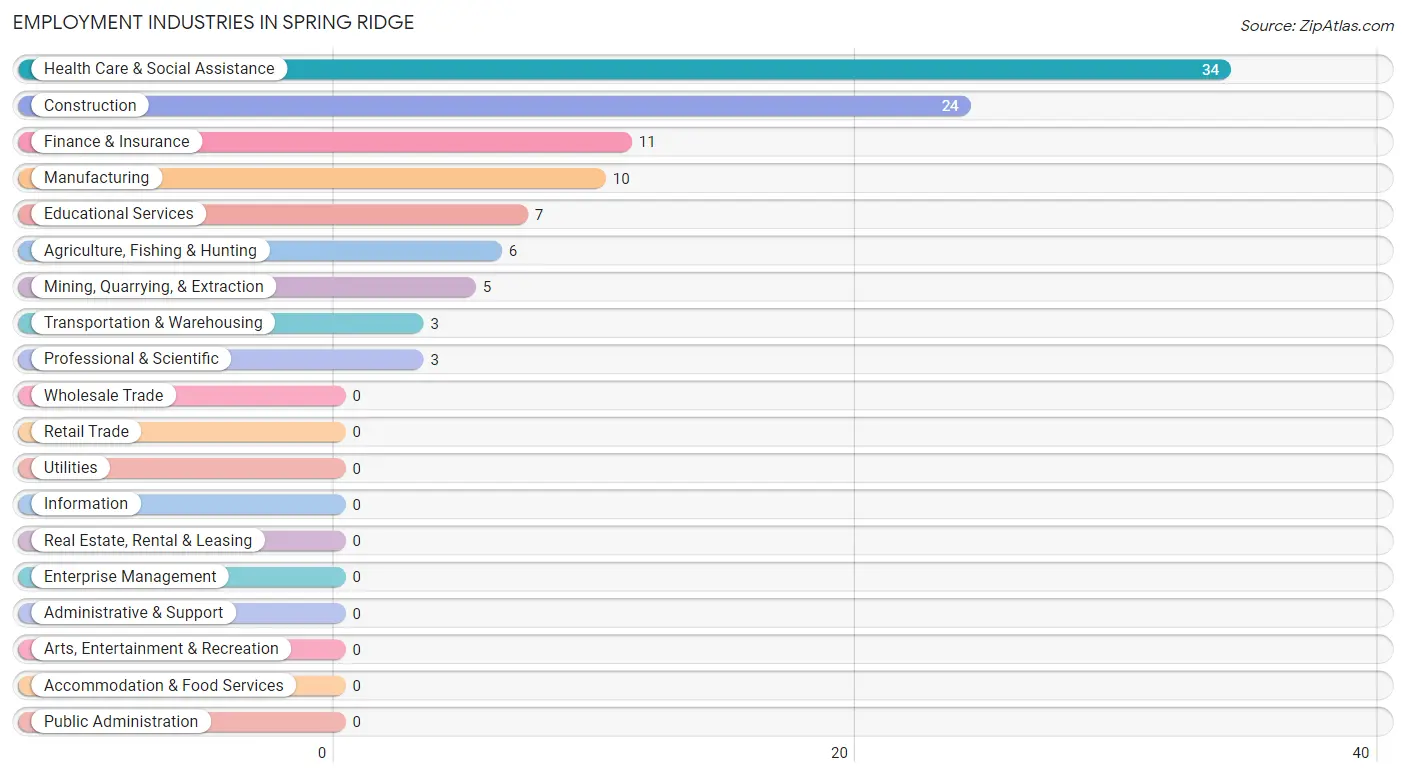
Employment Industries in Spring Ridge
The major employment industries in Spring Ridge include Health Care & Social Assistance (34 | 33.0%), Construction (24 | 23.3%), Finance & Insurance (11 | 10.7%), Manufacturing (10 | 9.7%), and Educational Services (7 | 6.8%).
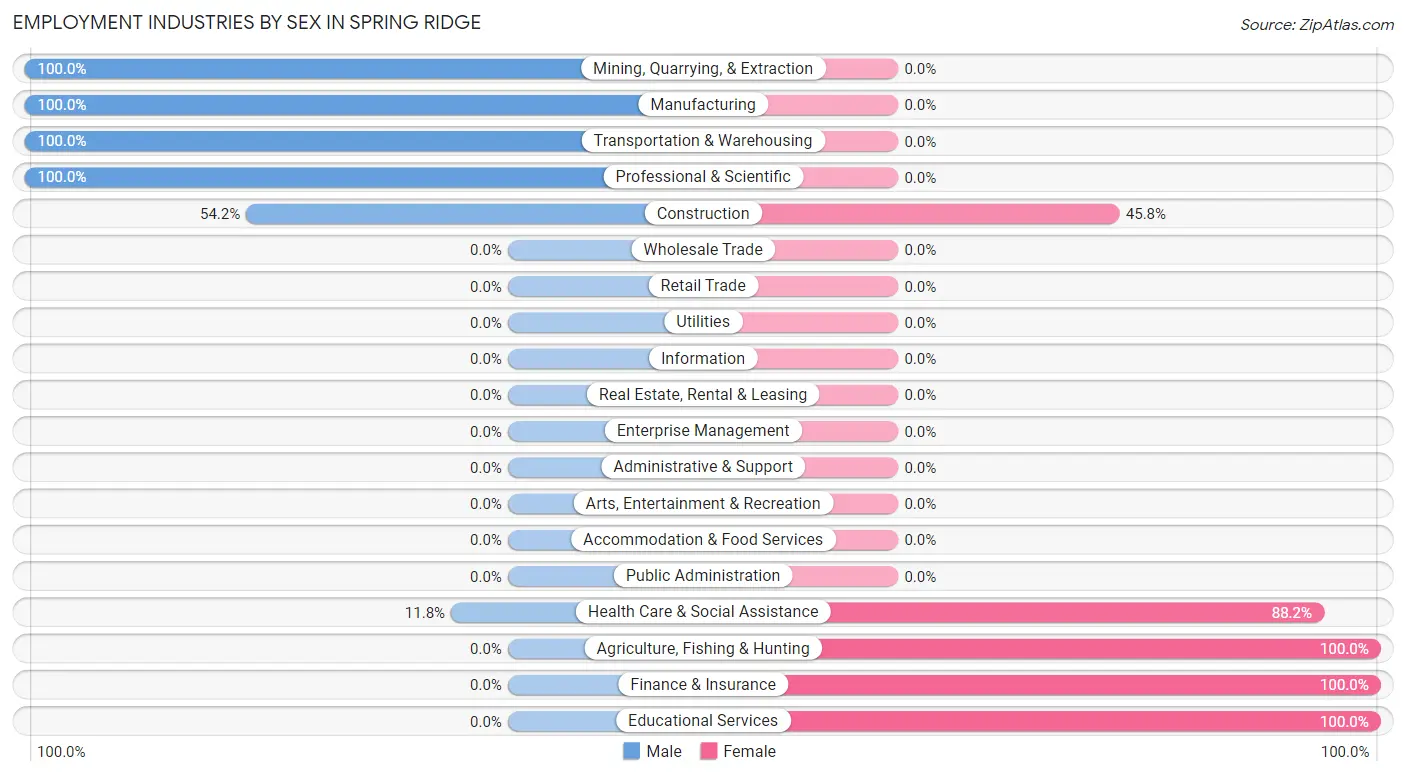
Employment Industries by Sex in Spring Ridge
The Spring Ridge industries that see more men than women are Mining, Quarrying, & Extraction (100.0%), Manufacturing (100.0%), and Transportation & Warehousing (100.0%), whereas the industries that tend to have a higher number of women are Agriculture, Fishing & Hunting (100.0%), Finance & Insurance (100.0%), and Educational Services (100.0%).
| Industry | Male | Female |
| Agriculture, Fishing & Hunting | 0 (0.0%) | 6 (100.0%) |
| Mining, Quarrying, & Extraction | 5 (100.0%) | 0 (0.0%) |
| Construction | 13 (54.2%) | 11 (45.8%) |
| Manufacturing | 10 (100.0%) | 0 (0.0%) |
| Wholesale Trade | 0 (0.0%) | 0 (0.0%) |
| Retail Trade | 0 (0.0%) | 0 (0.0%) |
| Transportation & Warehousing | 3 (100.0%) | 0 (0.0%) |
| Utilities | 0 (0.0%) | 0 (0.0%) |
| Information | 0 (0.0%) | 0 (0.0%) |
| Finance & Insurance | 0 (0.0%) | 11 (100.0%) |
| Real Estate, Rental & Leasing | 0 (0.0%) | 0 (0.0%) |
| Professional & Scientific | 3 (100.0%) | 0 (0.0%) |
| Enterprise Management | 0 (0.0%) | 0 (0.0%) |
| Administrative & Support | 0 (0.0%) | 0 (0.0%) |
| Educational Services | 0 (0.0%) | 7 (100.0%) |
| Health Care & Social Assistance | 4 (11.8%) | 30 (88.2%) |
| Arts, Entertainment & Recreation | 0 (0.0%) | 0 (0.0%) |
| Accommodation & Food Services | 0 (0.0%) | 0 (0.0%) |
| Public Administration | 0 (0.0%) | 0 (0.0%) |
| Total | 38 (36.9%) | 65 (63.1%) |
Education in Spring Ridge
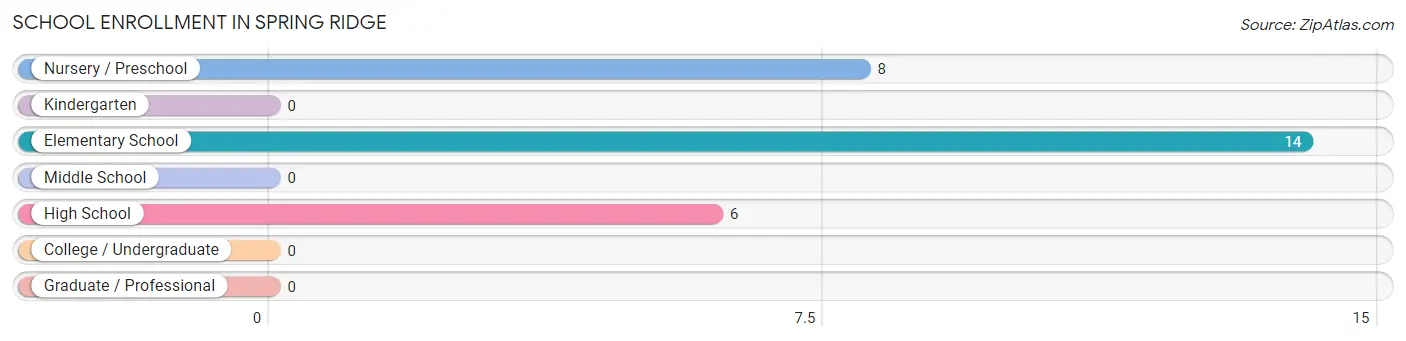
School Enrollment in Spring Ridge
The most common levels of schooling among the 28 students in Spring Ridge are elementary school (14 | 50.0%), nursery / preschool (8 | 28.6%), and high school (6 | 21.4%).
| School Level | # Students | % Students |
| Nursery / Preschool | 8 | 28.6% |
| Kindergarten | 0 | 0.0% |
| Elementary School | 14 | 50.0% |
| Middle School | 0 | 0.0% |
| High School | 6 | 21.4% |
| College / Undergraduate | 0 | 0.0% |
| Graduate / Professional | 0 | 0.0% |
| Total | 28 | 100.0% |
School Enrollment by Age by Funding Source in Spring Ridge
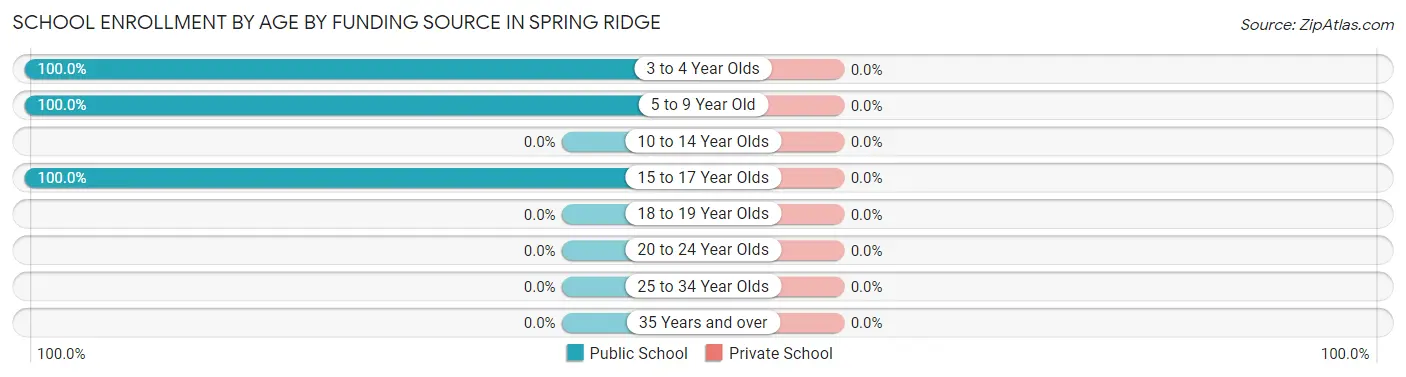
| Age Bracket | Public School | Private School |
| 3 to 4 Year Olds | 8 (100.0%) | 0 (0.0%) |
| 5 to 9 Year Old | 14 (100.0%) | 0 (0.0%) |
| 10 to 14 Year Olds | 0 (0.0%) | 0 (0.0%) |
| 15 to 17 Year Olds | 6 (100.0%) | 0 (0.0%) |
| 18 to 19 Year Olds | 0 (0.0%) | 0 (0.0%) |
| 20 to 24 Year Olds | 0 (0.0%) | 0 (0.0%) |
| 25 to 34 Year Olds | 0 (0.0%) | 0 (0.0%) |
| 35 Years and over | 0 (0.0%) | 0 (0.0%) |
| Total | 28 (100.0%) | 0 (0.0%) |
Educational Attainment by Field of Study in Spring Ridge
Science & technology (16 | 24.6%), business (16 | 24.6%), physical & health sciences (14 | 21.5%), computers & mathematics (6 | 9.2%), and communications (6 | 9.2%) are the most common fields of study among 65 individuals in Spring Ridge who have obtained a bachelor's degree or higher.
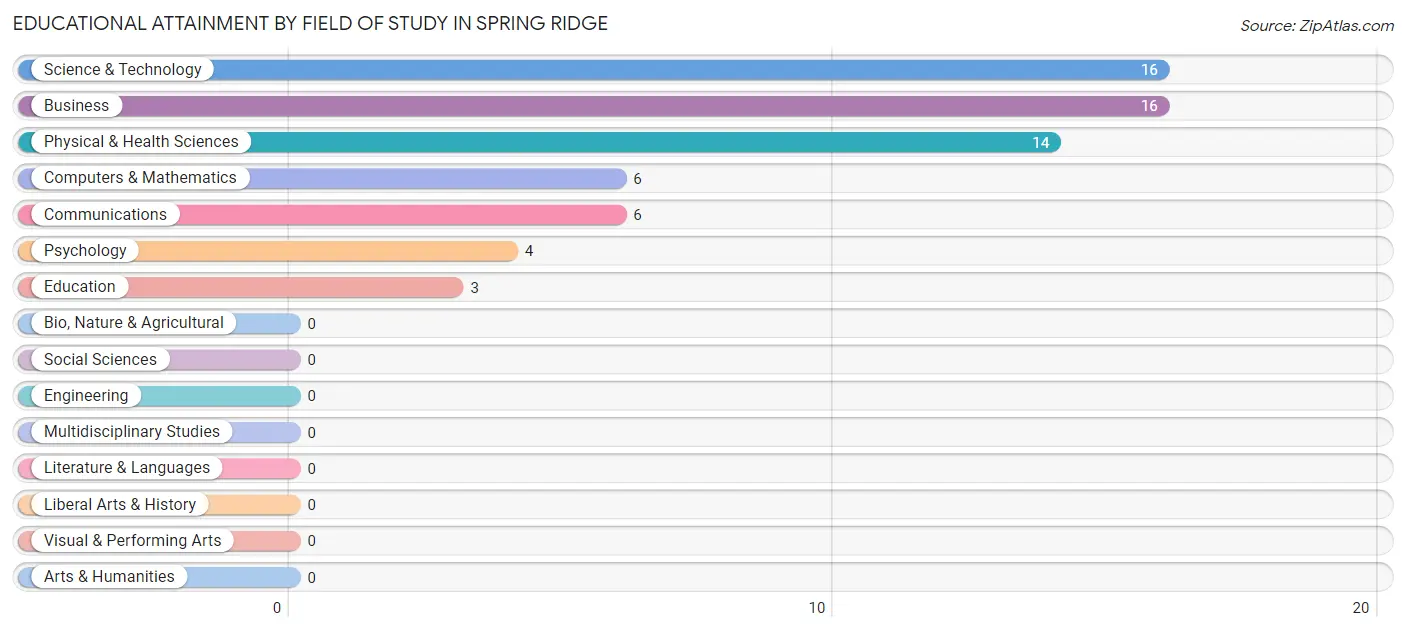
| Field of Study | # Graduates | % Graduates |
| Computers & Mathematics | 6 | 9.2% |
| Bio, Nature & Agricultural | 0 | 0.0% |
| Physical & Health Sciences | 14 | 21.5% |
| Psychology | 4 | 6.1% |
| Social Sciences | 0 | 0.0% |
| Engineering | 0 | 0.0% |
| Multidisciplinary Studies | 0 | 0.0% |
| Science & Technology | 16 | 24.6% |
| Business | 16 | 24.6% |
| Education | 3 | 4.6% |
| Literature & Languages | 0 | 0.0% |
| Liberal Arts & History | 0 | 0.0% |
| Visual & Performing Arts | 0 | 0.0% |
| Communications | 6 | 9.2% |
| Arts & Humanities | 0 | 0.0% |
| Total | 65 | 100.0% |
Transportation & Commute in Spring Ridge
Vehicle Availability by Sex in Spring Ridge
The most prevalent vehicle ownership categories in Spring Ridge are males with 2 vehicles (16, accounting for 57.1%) and females with 2 vehicles (22, making up 26.2%).
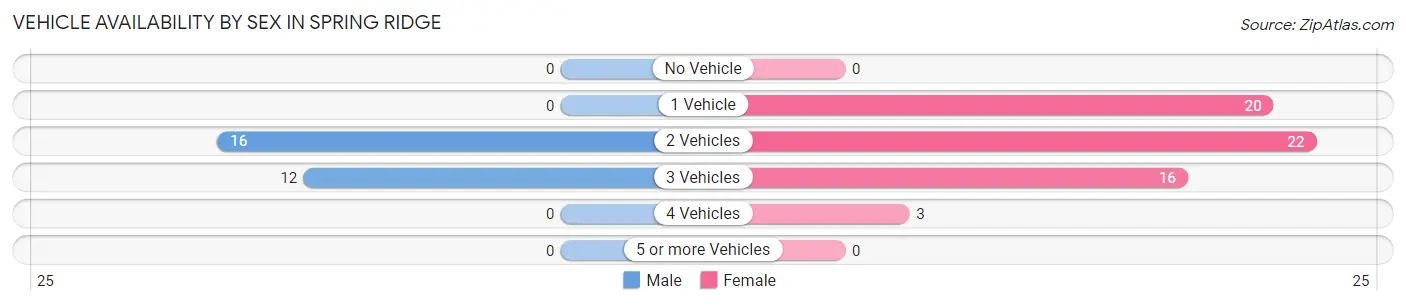
| Vehicles Available | Male | Female |
| No Vehicle | 0 (0.0%) | 0 (0.0%) |
| 1 Vehicle | 0 (0.0%) | 20 (32.8%) |
| 2 Vehicles | 16 (57.1%) | 22 (36.1%) |
| 3 Vehicles | 12 (42.9%) | 16 (26.2%) |
| 4 Vehicles | 0 (0.0%) | 3 (4.9%) |
| 5 or more Vehicles | 0 (0.0%) | 0 (0.0%) |
| Total | 28 (100.0%) | 61 (100.0%) |
Commute Time in Spring Ridge
The most frequently occuring commute durations in Spring Ridge are 45 to 59 minutes (28 commuters, 38.4%), 10 to 14 minutes (15 commuters, 20.5%), and 40 to 44 minutes (14 commuters, 19.2%).
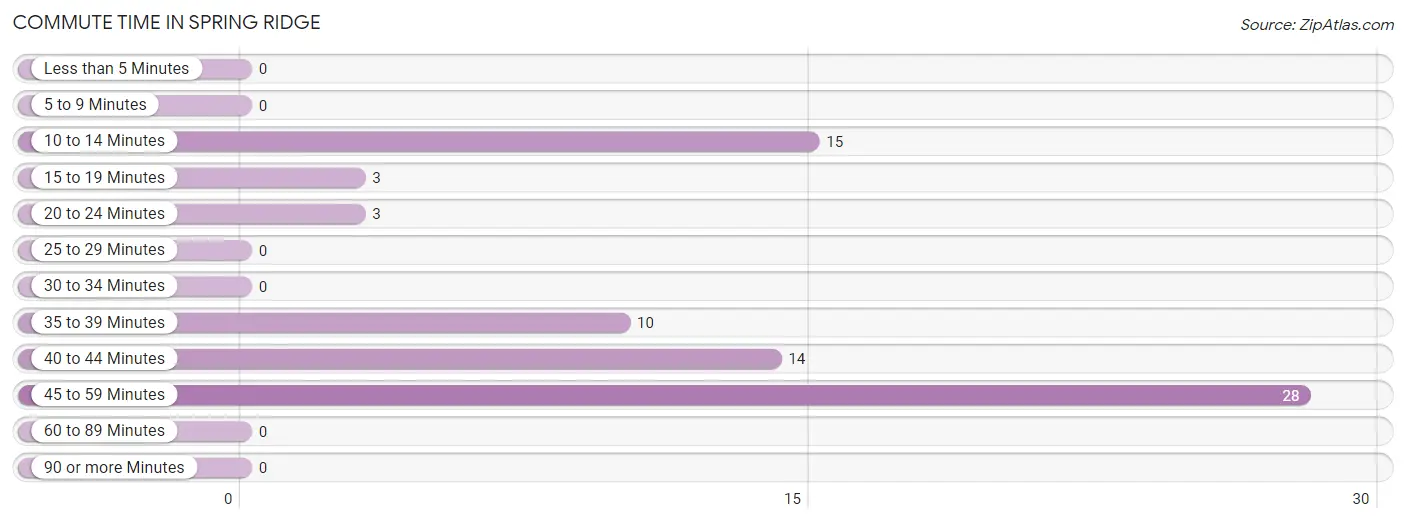
| Commute Time | # Commuters | % Commuters |
| Less than 5 Minutes | 0 | 0.0% |
| 5 to 9 Minutes | 0 | 0.0% |
| 10 to 14 Minutes | 15 | 20.5% |
| 15 to 19 Minutes | 3 | 4.1% |
| 20 to 24 Minutes | 3 | 4.1% |
| 25 to 29 Minutes | 0 | 0.0% |
| 30 to 34 Minutes | 0 | 0.0% |
| 35 to 39 Minutes | 10 | 13.7% |
| 40 to 44 Minutes | 14 | 19.2% |
| 45 to 59 Minutes | 28 | 38.4% |
| 60 to 89 Minutes | 0 | 0.0% |
| 90 or more Minutes | 0 | 0.0% |
Commute Time by Sex in Spring Ridge
The most common commute times in Spring Ridge are 10 to 14 minutes (9 commuters, 39.1%) for males and 45 to 59 minutes (20 commuters, 40.0%) for females.
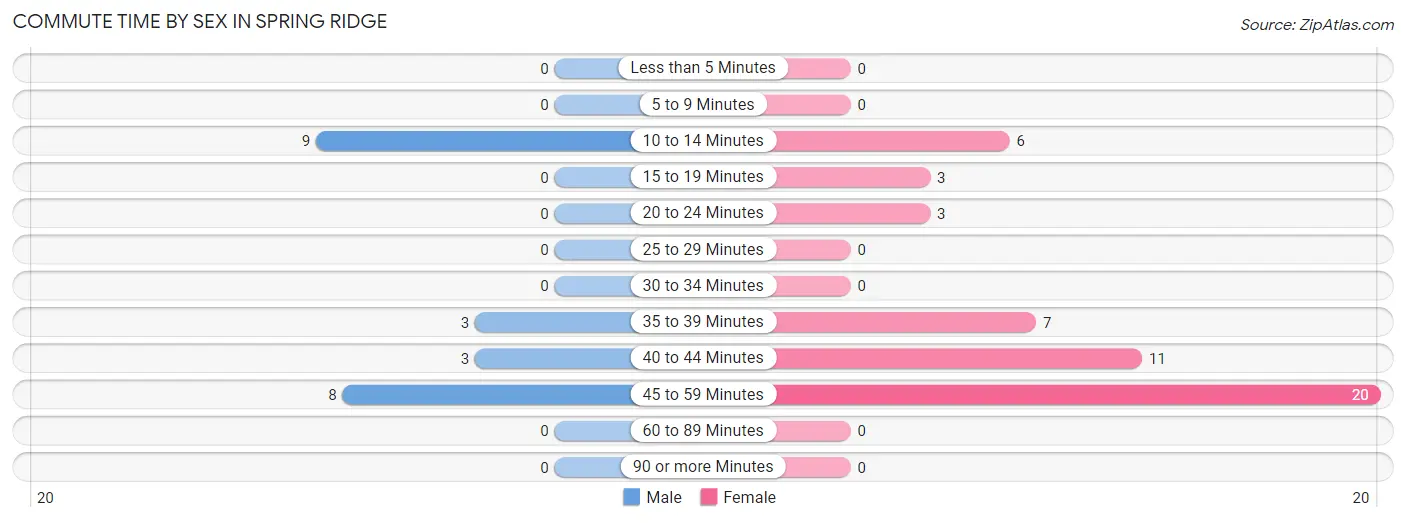
| Commute Time | Male | Female |
| Less than 5 Minutes | 0 (0.0%) | 0 (0.0%) |
| 5 to 9 Minutes | 0 (0.0%) | 0 (0.0%) |
| 10 to 14 Minutes | 9 (39.1%) | 6 (12.0%) |
| 15 to 19 Minutes | 0 (0.0%) | 3 (6.0%) |
| 20 to 24 Minutes | 0 (0.0%) | 3 (6.0%) |
| 25 to 29 Minutes | 0 (0.0%) | 0 (0.0%) |
| 30 to 34 Minutes | 0 (0.0%) | 0 (0.0%) |
| 35 to 39 Minutes | 3 (13.0%) | 7 (14.0%) |
| 40 to 44 Minutes | 3 (13.0%) | 11 (22.0%) |
| 45 to 59 Minutes | 8 (34.8%) | 20 (40.0%) |
| 60 to 89 Minutes | 0 (0.0%) | 0 (0.0%) |
| 90 or more Minutes | 0 (0.0%) | 0 (0.0%) |
Time of Departure to Work by Sex in Spring Ridge
The most frequent times of departure to work in Spring Ridge are 5:30 AM to 5:59 AM (9, 39.1%) for males and 6:30 AM to 6:59 AM (16, 32.0%) for females.
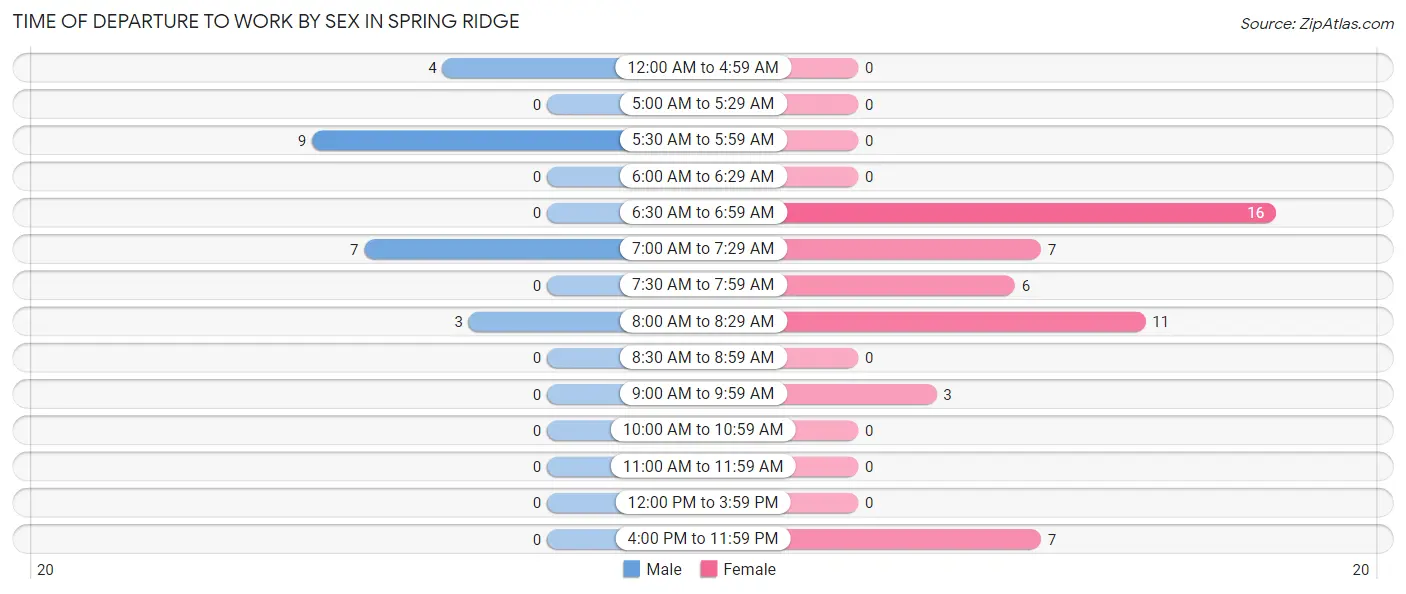
| Time of Departure | Male | Female |
| 12:00 AM to 4:59 AM | 4 (17.4%) | 0 (0.0%) |
| 5:00 AM to 5:29 AM | 0 (0.0%) | 0 (0.0%) |
| 5:30 AM to 5:59 AM | 9 (39.1%) | 0 (0.0%) |
| 6:00 AM to 6:29 AM | 0 (0.0%) | 0 (0.0%) |
| 6:30 AM to 6:59 AM | 0 (0.0%) | 16 (32.0%) |
| 7:00 AM to 7:29 AM | 7 (30.4%) | 7 (14.0%) |
| 7:30 AM to 7:59 AM | 0 (0.0%) | 6 (12.0%) |
| 8:00 AM to 8:29 AM | 3 (13.0%) | 11 (22.0%) |
| 8:30 AM to 8:59 AM | 0 (0.0%) | 0 (0.0%) |
| 9:00 AM to 9:59 AM | 0 (0.0%) | 3 (6.0%) |
| 10:00 AM to 10:59 AM | 0 (0.0%) | 0 (0.0%) |
| 11:00 AM to 11:59 AM | 0 (0.0%) | 0 (0.0%) |
| 12:00 PM to 3:59 PM | 0 (0.0%) | 0 (0.0%) |
| 4:00 PM to 11:59 PM | 0 (0.0%) | 7 (14.0%) |
| Total | 23 (100.0%) | 50 (100.0%) |
Housing Occupancy in Spring Ridge
Occupancy by Ownership in Spring Ridge
Of the total 121 dwellings in Spring Ridge, owner-occupied units account for 121 (100.0%), while renter-occupied units make up 0 (0.0%).
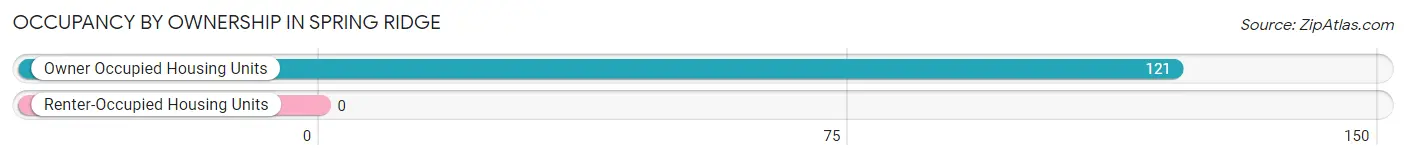
| Occupancy | # Housing Units | % Housing Units |
| Owner Occupied Housing Units | 121 | 100.0% |
| Renter-Occupied Housing Units | 0 | 0.0% |
| Total Occupied Housing Units | 121 | 100.0% |
Occupancy by Household Size in Spring Ridge
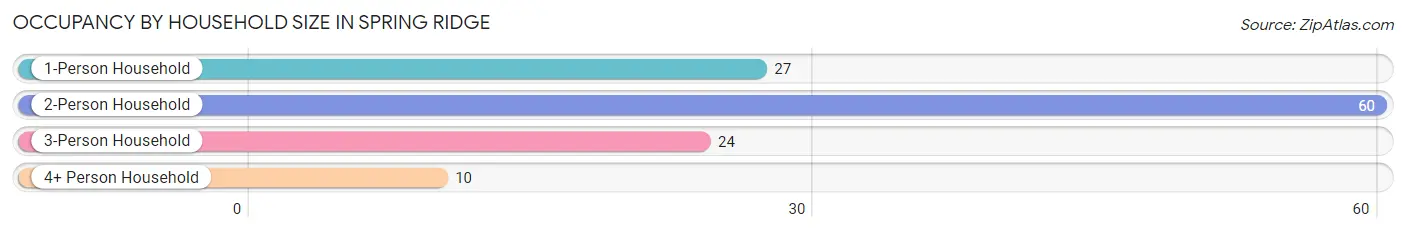
| Household Size | # Housing Units | % Housing Units |
| 1-Person Household | 27 | 22.3% |
| 2-Person Household | 60 | 49.6% |
| 3-Person Household | 24 | 19.8% |
| 4+ Person Household | 10 | 8.3% |
| Total Housing Units | 121 | 100.0% |
Occupancy by Ownership by Household Size in Spring Ridge
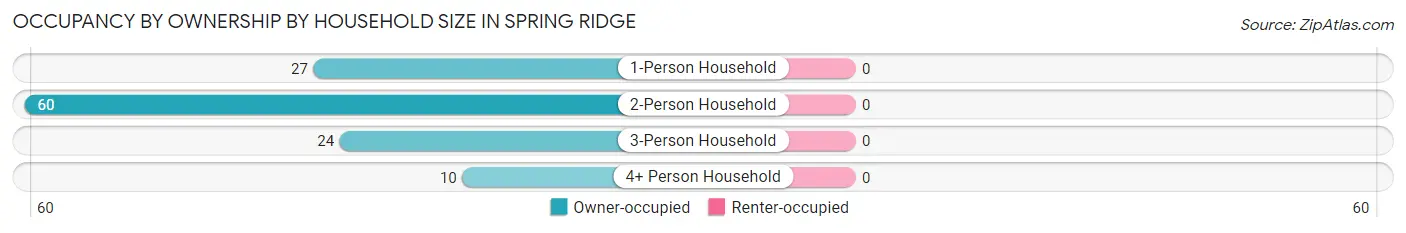
| Household Size | Owner-occupied | Renter-occupied |
| 1-Person Household | 27 (100.0%) | 0 (0.0%) |
| 2-Person Household | 60 (100.0%) | 0 (0.0%) |
| 3-Person Household | 24 (100.0%) | 0 (0.0%) |
| 4+ Person Household | 10 (100.0%) | 0 (0.0%) |
| Total Housing Units | 121 (100.0%) | 0 (0.0%) |
Occupancy by Educational Attainment in Spring Ridge
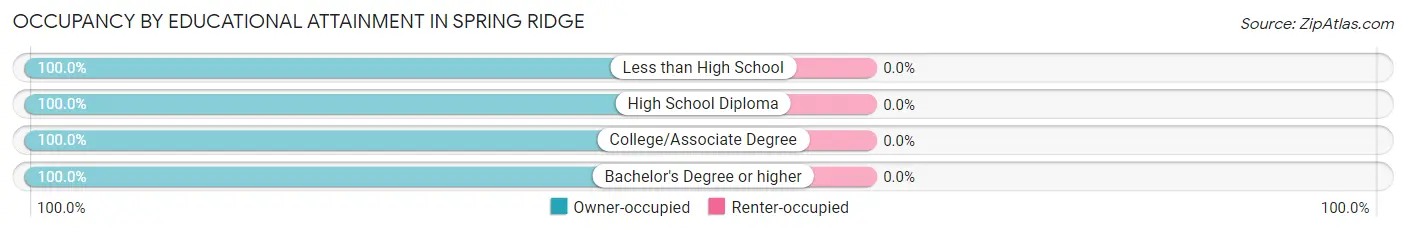
| Household Size | Owner-occupied | Renter-occupied |
| Less than High School | 9 (100.0%) | 0 (0.0%) |
| High School Diploma | 32 (100.0%) | 0 (0.0%) |
| College/Associate Degree | 25 (100.0%) | 0 (0.0%) |
| Bachelor's Degree or higher | 55 (100.0%) | 0 (0.0%) |
Occupancy by Age of Householder in Spring Ridge
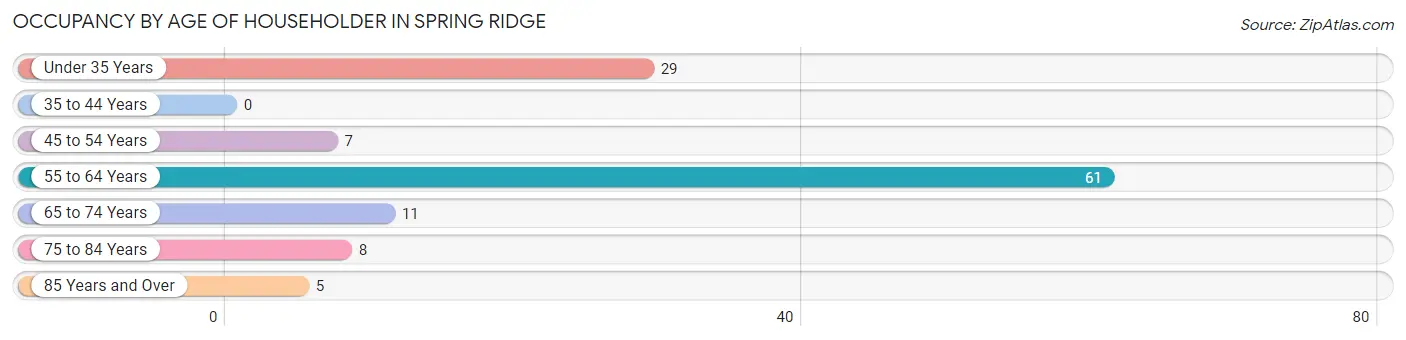
| Age Bracket | # Households | % Households |
| Under 35 Years | 29 | 24.0% |
| 35 to 44 Years | 0 | 0.0% |
| 45 to 54 Years | 7 | 5.8% |
| 55 to 64 Years | 61 | 50.4% |
| 65 to 74 Years | 11 | 9.1% |
| 75 to 84 Years | 8 | 6.6% |
| 85 Years and Over | 5 | 4.1% |
| Total | 121 | 100.0% |
Housing Finances in Spring Ridge
Median Income by Occupancy in Spring Ridge
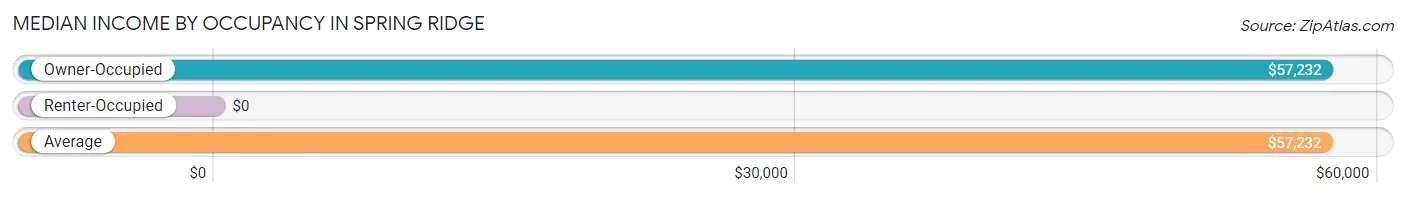
| Occupancy Type | # Households | Median Income |
| Owner-Occupied | 121 (100.0%) | $57,232 |
| Renter-Occupied | 0 (0.0%) | $0 |
| Average | 121 (100.0%) | $57,232 |
Occupancy by Householder Income Bracket in Spring Ridge
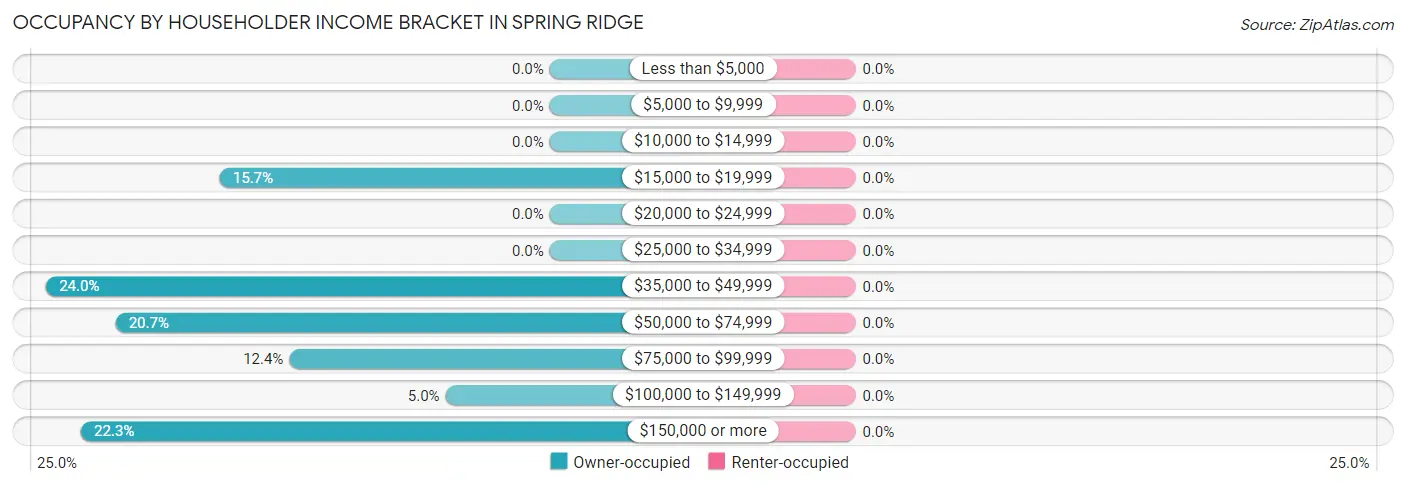
| Income Bracket | Owner-occupied | Renter-occupied |
| Less than $5,000 | 0 (0.0%) | 0 (0.0%) |
| $5,000 to $9,999 | 0 (0.0%) | 0 (0.0%) |
| $10,000 to $14,999 | 0 (0.0%) | 0 (0.0%) |
| $15,000 to $19,999 | 19 (15.7%) | 0 (0.0%) |
| $20,000 to $24,999 | 0 (0.0%) | 0 (0.0%) |
| $25,000 to $34,999 | 0 (0.0%) | 0 (0.0%) |
| $35,000 to $49,999 | 29 (24.0%) | 0 (0.0%) |
| $50,000 to $74,999 | 25 (20.7%) | 0 (0.0%) |
| $75,000 to $99,999 | 15 (12.4%) | 0 (0.0%) |
| $100,000 to $149,999 | 6 (5.0%) | 0 (0.0%) |
| $150,000 or more | 27 (22.3%) | 0 (0.0%) |
| Total | 121 (100.0%) | 0 (0.0%) |
Monthly Housing Cost Tiers in Spring Ridge
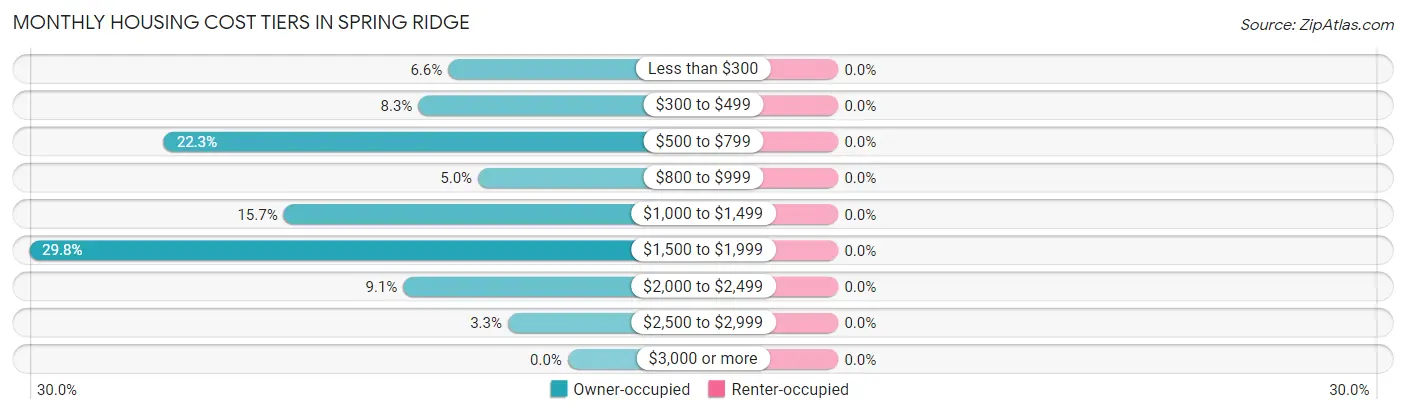
| Monthly Cost | Owner-occupied | Renter-occupied |
| Less than $300 | 8 (6.6%) | 0 (0.0%) |
| $300 to $499 | 10 (8.3%) | 0 (0.0%) |
| $500 to $799 | 27 (22.3%) | 0 (0.0%) |
| $800 to $999 | 6 (5.0%) | 0 (0.0%) |
| $1,000 to $1,499 | 19 (15.7%) | 0 (0.0%) |
| $1,500 to $1,999 | 36 (29.7%) | 0 (0.0%) |
| $2,000 to $2,499 | 11 (9.1%) | 0 (0.0%) |
| $2,500 to $2,999 | 4 (3.3%) | 0 (0.0%) |
| $3,000 or more | 0 (0.0%) | 0 (0.0%) |
| Total | 121 (100.0%) | 0 (0.0%) |
Physical Housing Characteristics in Spring Ridge
Housing Structures in Spring Ridge
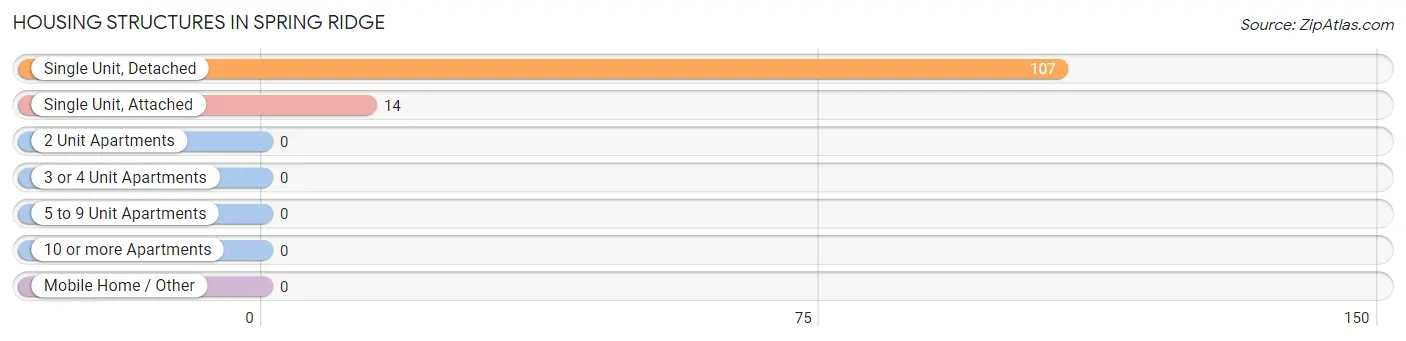
| Structure Type | # Housing Units | % Housing Units |
| Single Unit, Detached | 107 | 88.4% |
| Single Unit, Attached | 14 | 11.6% |
| 2 Unit Apartments | 0 | 0.0% |
| 3 or 4 Unit Apartments | 0 | 0.0% |
| 5 to 9 Unit Apartments | 0 | 0.0% |
| 10 or more Apartments | 0 | 0.0% |
| Mobile Home / Other | 0 | 0.0% |
| Total | 121 | 100.0% |
Housing Structures by Occupancy in Spring Ridge
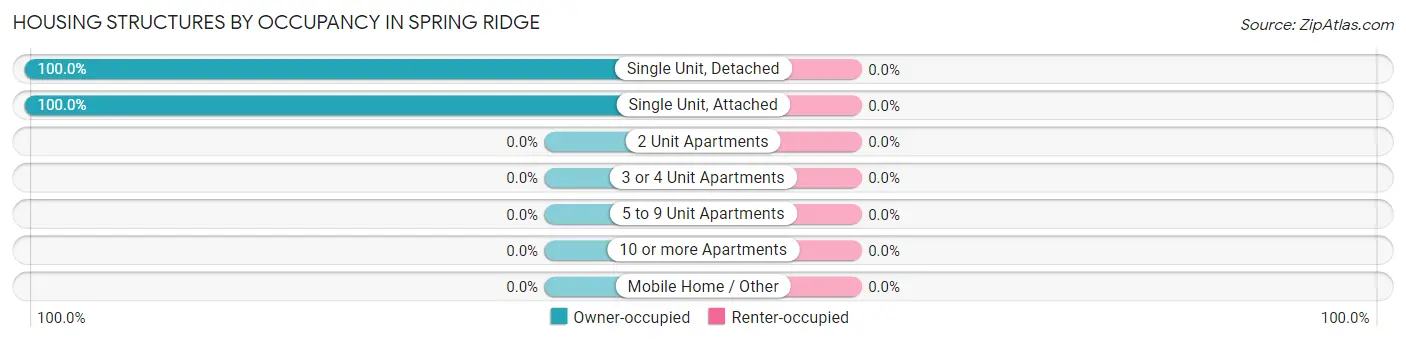
| Structure Type | Owner-occupied | Renter-occupied |
| Single Unit, Detached | 107 (100.0%) | 0 (0.0%) |
| Single Unit, Attached | 14 (100.0%) | 0 (0.0%) |
| 2 Unit Apartments | 0 (0.0%) | 0 (0.0%) |
| 3 or 4 Unit Apartments | 0 (0.0%) | 0 (0.0%) |
| 5 to 9 Unit Apartments | 0 (0.0%) | 0 (0.0%) |
| 10 or more Apartments | 0 (0.0%) | 0 (0.0%) |
| Mobile Home / Other | 0 (0.0%) | 0 (0.0%) |
| Total | 121 (100.0%) | 0 (0.0%) |
Housing Structures by Number of Rooms in Spring Ridge
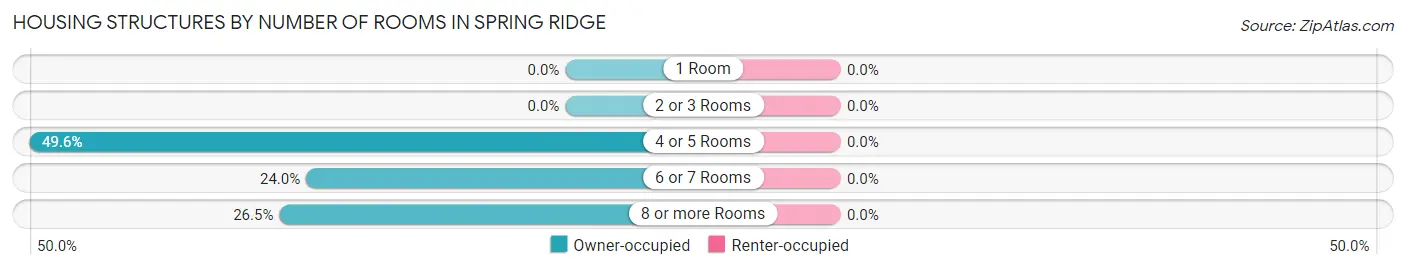
| Number of Rooms | Owner-occupied | Renter-occupied |
| 1 Room | 0 (0.0%) | 0 (0.0%) |
| 2 or 3 Rooms | 0 (0.0%) | 0 (0.0%) |
| 4 or 5 Rooms | 60 (49.6%) | 0 (0.0%) |
| 6 or 7 Rooms | 29 (24.0%) | 0 (0.0%) |
| 8 or more Rooms | 32 (26.5%) | 0 (0.0%) |
| Total | 121 (100.0%) | 0 (0.0%) |
Housing Structure by Heating Type in Spring Ridge
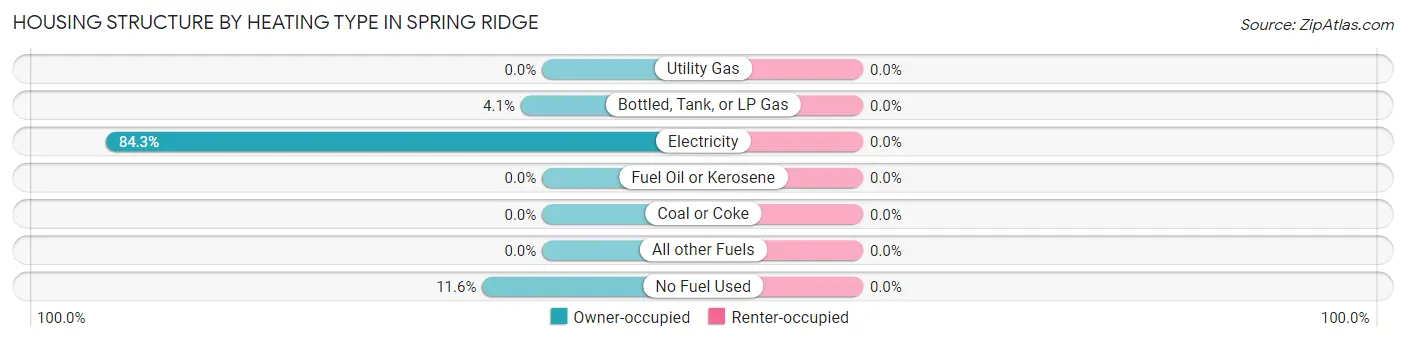
| Heating Type | Owner-occupied | Renter-occupied |
| Utility Gas | 0 (0.0%) | 0 (0.0%) |
| Bottled, Tank, or LP Gas | 5 (4.1%) | 0 (0.0%) |
| Electricity | 102 (84.3%) | 0 (0.0%) |
| Fuel Oil or Kerosene | 0 (0.0%) | 0 (0.0%) |
| Coal or Coke | 0 (0.0%) | 0 (0.0%) |
| All other Fuels | 0 (0.0%) | 0 (0.0%) |
| No Fuel Used | 14 (11.6%) | 0 (0.0%) |
| Total | 121 (100.0%) | 0 (0.0%) |
Household Vehicle Usage in Spring Ridge
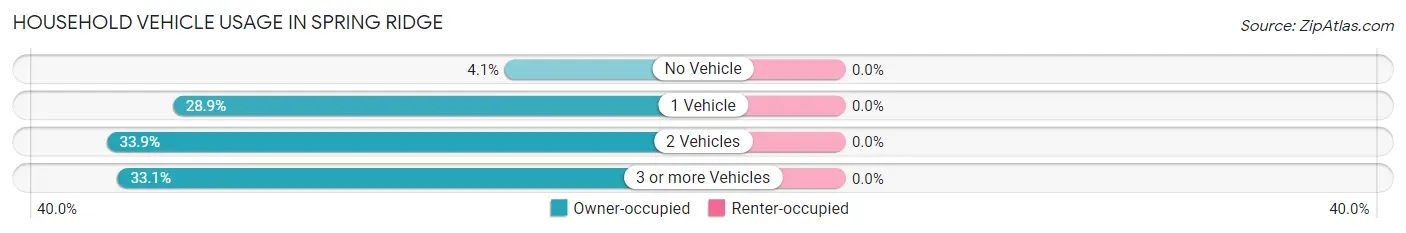
| Vehicles per Household | Owner-occupied | Renter-occupied |
| No Vehicle | 5 (4.1%) | 0 (0.0%) |
| 1 Vehicle | 35 (28.9%) | 0 (0.0%) |
| 2 Vehicles | 41 (33.9%) | 0 (0.0%) |
| 3 or more Vehicles | 40 (33.1%) | 0 (0.0%) |
| Total | 121 (100.0%) | 0 (0.0%) |
Real Estate & Mortgages in Spring Ridge
Real Estate and Mortgage Overview in Spring Ridge
| Characteristic | Without Mortgage | With Mortgage |
| Housing Units | 26 | 95 |
| Median Property Value | $231,300 | $281,500 |
| Median Household Income | - | - |
| Monthly Housing Costs | $450 | $0 |
| Real Estate Taxes | $1,750 | $0 |
Property Value by Mortgage Status in Spring Ridge
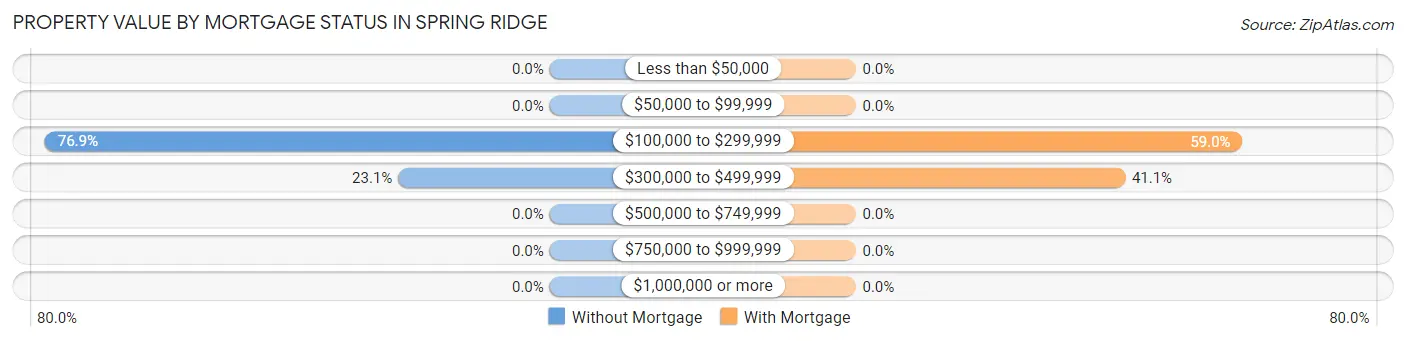
| Property Value | Without Mortgage | With Mortgage |
| Less than $50,000 | 0 (0.0%) | 0 (0.0%) |
| $50,000 to $99,999 | 0 (0.0%) | 0 (0.0%) |
| $100,000 to $299,999 | 20 (76.9%) | 56 (59.0%) |
| $300,000 to $499,999 | 6 (23.1%) | 39 (41.0%) |
| $500,000 to $749,999 | 0 (0.0%) | 0 (0.0%) |
| $750,000 to $999,999 | 0 (0.0%) | 0 (0.0%) |
| $1,000,000 or more | 0 (0.0%) | 0 (0.0%) |
| Total | 26 (100.0%) | 95 (100.0%) |
Household Income by Mortgage Status in Spring Ridge
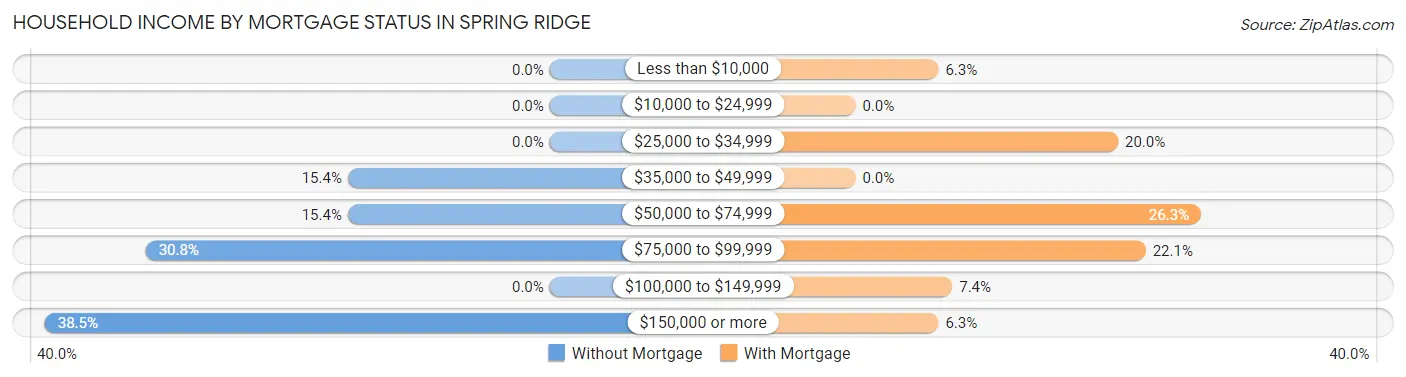
| Household Income | Without Mortgage | With Mortgage |
| Less than $10,000 | 0 (0.0%) | 6 (6.3%) |
| $10,000 to $24,999 | 0 (0.0%) | 0 (0.0%) |
| $25,000 to $34,999 | 0 (0.0%) | 19 (20.0%) |
| $35,000 to $49,999 | 4 (15.4%) | 0 (0.0%) |
| $50,000 to $74,999 | 4 (15.4%) | 25 (26.3%) |
| $75,000 to $99,999 | 8 (30.8%) | 21 (22.1%) |
| $100,000 to $149,999 | 0 (0.0%) | 7 (7.4%) |
| $150,000 or more | 10 (38.5%) | 6 (6.3%) |
| Total | 26 (100.0%) | 95 (100.0%) |
Property Value to Household Income Ratio in Spring Ridge
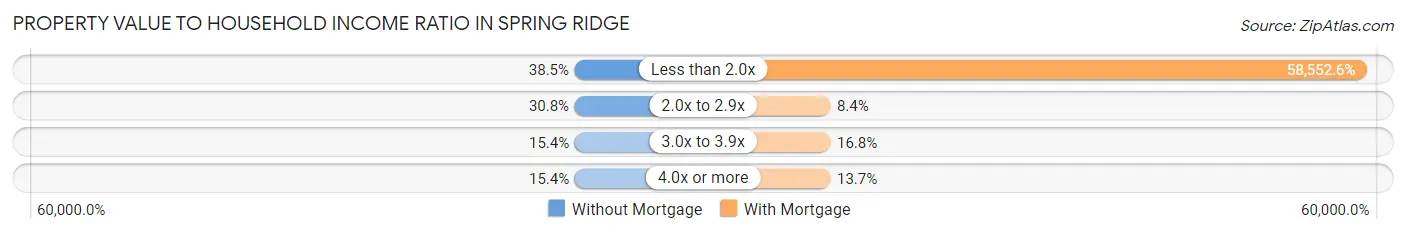
| Value-to-Income Ratio | Without Mortgage | With Mortgage |
| Less than 2.0x | 10 (38.5%) | 55,625 (58,552.6%) |
| 2.0x to 2.9x | 8 (30.8%) | 8 (8.4%) |
| 3.0x to 3.9x | 4 (15.4%) | 16 (16.8%) |
| 4.0x or more | 4 (15.4%) | 13 (13.7%) |
| Total | 26 (100.0%) | 95 (100.0%) |
Real Estate Taxes by Mortgage Status in Spring Ridge
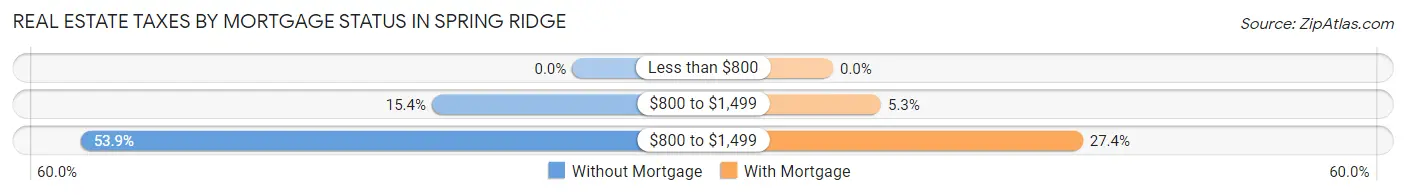
| Property Taxes | Without Mortgage | With Mortgage |
| Less than $800 | 0 (0.0%) | 0 (0.0%) |
| $800 to $1,499 | 4 (15.4%) | 5 (5.3%) |
| $800 to $1,499 | 14 (53.8%) | 26 (27.4%) |
| Total | 26 (100.0%) | 95 (100.0%) |
Health & Disability in Spring Ridge
Health Insurance Coverage by Age in Spring Ridge
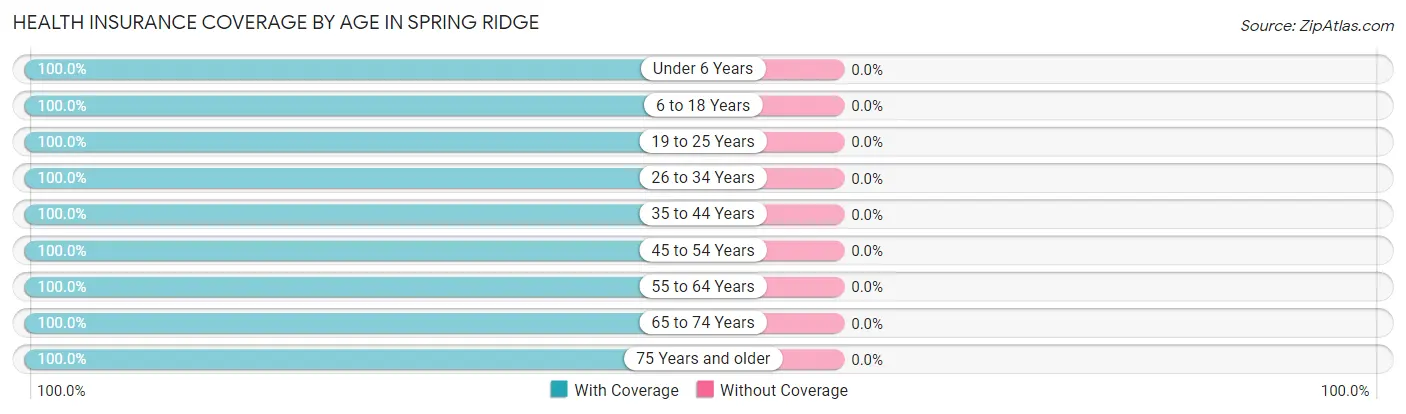
| Age Bracket | With Coverage | Without Coverage |
| Under 6 Years | 34 (100.0%) | 0 (0.0%) |
| 6 to 18 Years | 20 (100.0%) | 0 (0.0%) |
| 19 to 25 Years | 21 (100.0%) | 0 (0.0%) |
| 26 to 34 Years | 42 (100.0%) | 0 (0.0%) |
| 35 to 44 Years | 3 (100.0%) | 0 (0.0%) |
| 45 to 54 Years | 11 (100.0%) | 0 (0.0%) |
| 55 to 64 Years | 79 (100.0%) | 0 (0.0%) |
| 65 to 74 Years | 24 (100.0%) | 0 (0.0%) |
| 75 Years and older | 22 (100.0%) | 0 (0.0%) |
| Total | 256 (100.0%) | 0 (0.0%) |
Health Insurance Coverage by Citizenship Status in Spring Ridge
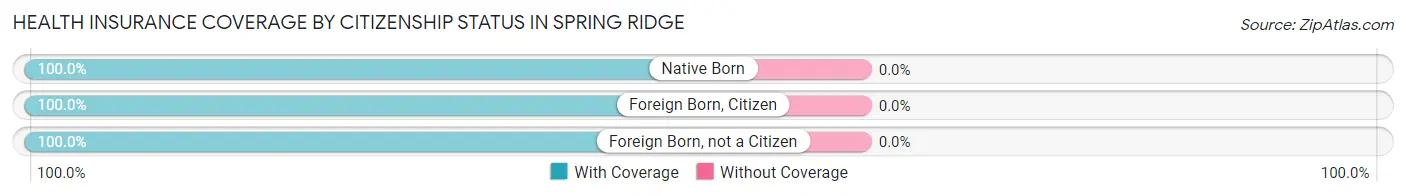
| Citizenship Status | With Coverage | Without Coverage |
| Native Born | 34 (100.0%) | 0 (0.0%) |
| Foreign Born, Citizen | 20 (100.0%) | 0 (0.0%) |
| Foreign Born, not a Citizen | 21 (100.0%) | 0 (0.0%) |
Health Insurance Coverage by Household Income in Spring Ridge
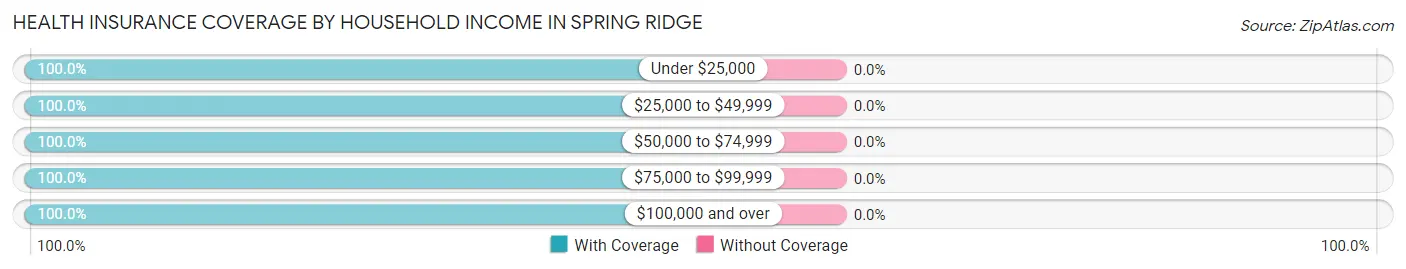
| Household Income | With Coverage | Without Coverage |
| Under $25,000 | 19 (100.0%) | 0 (0.0%) |
| $25,000 to $49,999 | 71 (100.0%) | 0 (0.0%) |
| $50,000 to $74,999 | 58 (100.0%) | 0 (0.0%) |
| $75,000 to $99,999 | 19 (100.0%) | 0 (0.0%) |
| $100,000 and over | 89 (100.0%) | 0 (0.0%) |
Public vs Private Health Insurance Coverage by Age in Spring Ridge
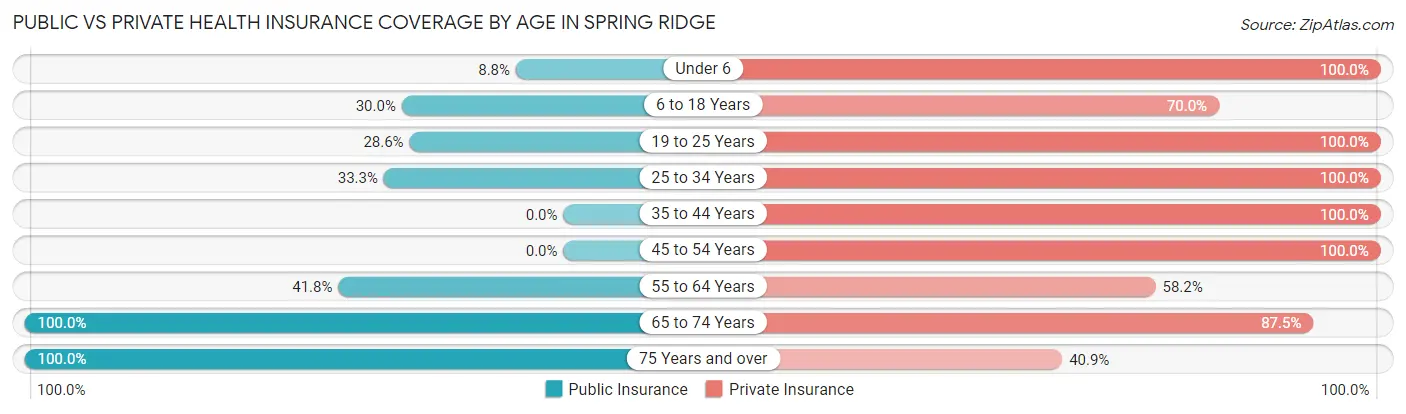
| Age Bracket | Public Insurance | Private Insurance |
| Under 6 | 3 (8.8%) | 34 (100.0%) |
| 6 to 18 Years | 6 (30.0%) | 14 (70.0%) |
| 19 to 25 Years | 6 (28.6%) | 21 (100.0%) |
| 25 to 34 Years | 14 (33.3%) | 42 (100.0%) |
| 35 to 44 Years | 0 (0.0%) | 3 (100.0%) |
| 45 to 54 Years | 0 (0.0%) | 11 (100.0%) |
| 55 to 64 Years | 33 (41.8%) | 46 (58.2%) |
| 65 to 74 Years | 24 (100.0%) | 21 (87.5%) |
| 75 Years and over | 22 (100.0%) | 9 (40.9%) |
| Total | 108 (42.2%) | 201 (78.5%) |
Disability Status by Sex by Age in Spring Ridge
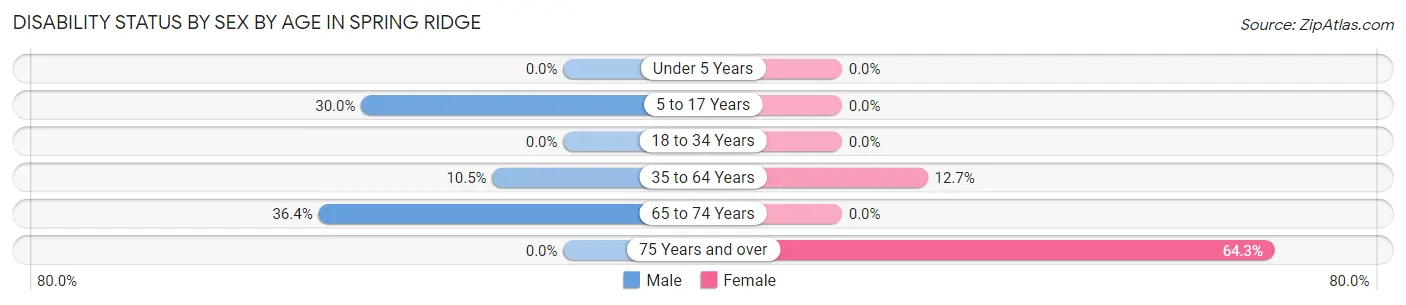
| Age Bracket | Male | Female |
| Under 5 Years | 0 (0.0%) | 0 (0.0%) |
| 5 to 17 Years | 6 (30.0%) | 0 (0.0%) |
| 18 to 34 Years | 0 (0.0%) | 0 (0.0%) |
| 35 to 64 Years | 4 (10.5%) | 7 (12.7%) |
| 65 to 74 Years | 4 (36.4%) | 0 (0.0%) |
| 75 Years and over | 0 (0.0%) | 9 (64.3%) |
Disability Class by Sex by Age in Spring Ridge
Disability Class: Hearing Difficulty
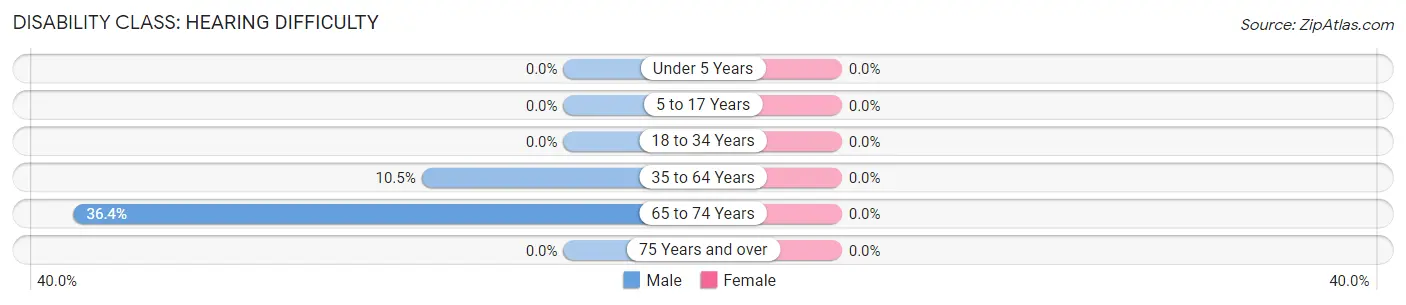
| Age Bracket | Male | Female |
| Under 5 Years | 0 (0.0%) | 0 (0.0%) |
| 5 to 17 Years | 0 (0.0%) | 0 (0.0%) |
| 18 to 34 Years | 0 (0.0%) | 0 (0.0%) |
| 35 to 64 Years | 4 (10.5%) | 0 (0.0%) |
| 65 to 74 Years | 4 (36.4%) | 0 (0.0%) |
| 75 Years and over | 0 (0.0%) | 0 (0.0%) |
Disability Class: Vision Difficulty
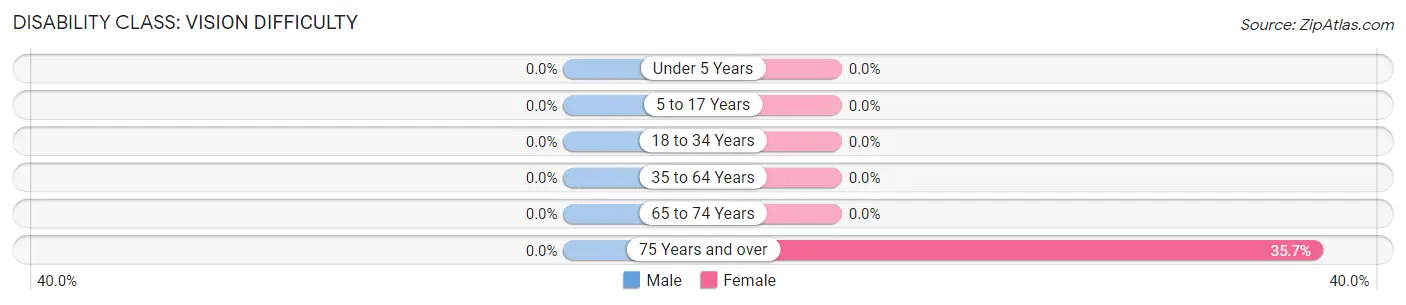
| Age Bracket | Male | Female |
| Under 5 Years | 0 (0.0%) | 0 (0.0%) |
| 5 to 17 Years | 0 (0.0%) | 0 (0.0%) |
| 18 to 34 Years | 0 (0.0%) | 0 (0.0%) |
| 35 to 64 Years | 0 (0.0%) | 0 (0.0%) |
| 65 to 74 Years | 0 (0.0%) | 0 (0.0%) |
| 75 Years and over | 0 (0.0%) | 5 (35.7%) |
Disability Class: Cognitive Difficulty
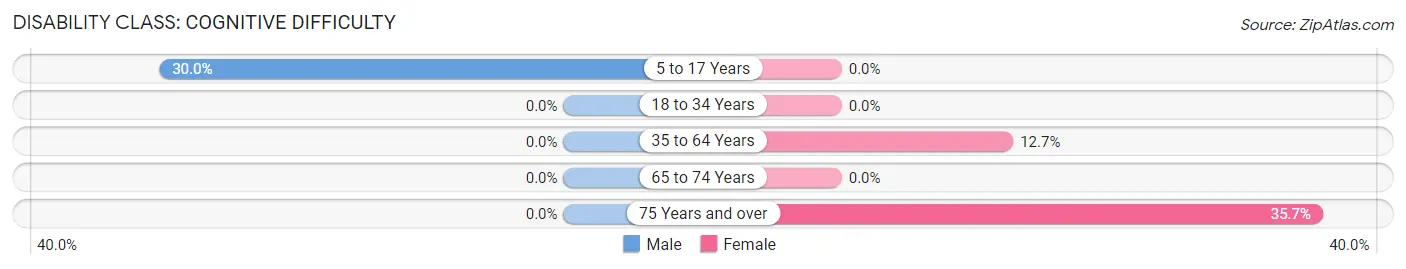
| Age Bracket | Male | Female |
| 5 to 17 Years | 6 (30.0%) | 0 (0.0%) |
| 18 to 34 Years | 0 (0.0%) | 0 (0.0%) |
| 35 to 64 Years | 0 (0.0%) | 7 (12.7%) |
| 65 to 74 Years | 0 (0.0%) | 0 (0.0%) |
| 75 Years and over | 0 (0.0%) | 5 (35.7%) |
Disability Class: Ambulatory Difficulty
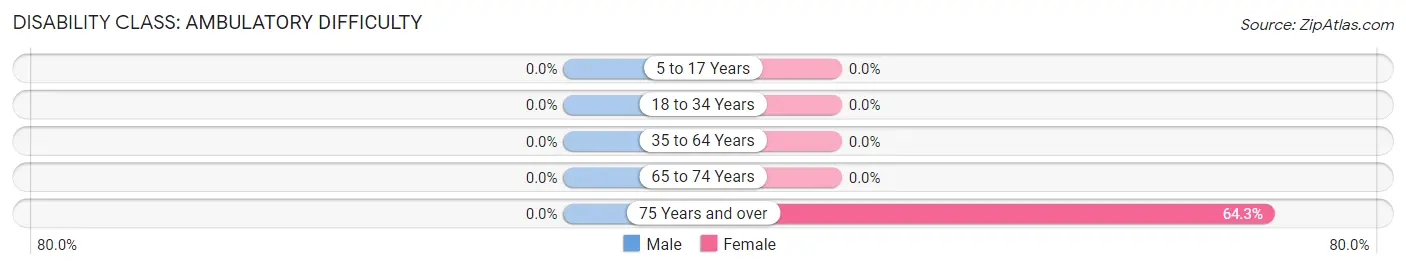
| Age Bracket | Male | Female |
| 5 to 17 Years | 0 (0.0%) | 0 (0.0%) |
| 18 to 34 Years | 0 (0.0%) | 0 (0.0%) |
| 35 to 64 Years | 0 (0.0%) | 0 (0.0%) |
| 65 to 74 Years | 0 (0.0%) | 0 (0.0%) |
| 75 Years and over | 0 (0.0%) | 9 (64.3%) |
Disability Class: Self-Care Difficulty
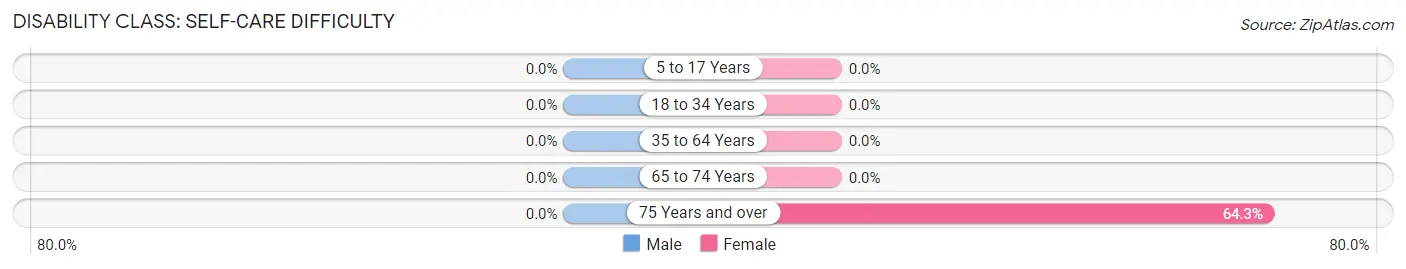
| Age Bracket | Male | Female |
| 5 to 17 Years | 0 (0.0%) | 0 (0.0%) |
| 18 to 34 Years | 0 (0.0%) | 0 (0.0%) |
| 35 to 64 Years | 0 (0.0%) | 0 (0.0%) |
| 65 to 74 Years | 0 (0.0%) | 0 (0.0%) |
| 75 Years and over | 0 (0.0%) | 9 (64.3%) |
Technology Access in Spring Ridge
Computing Device Access in Spring Ridge
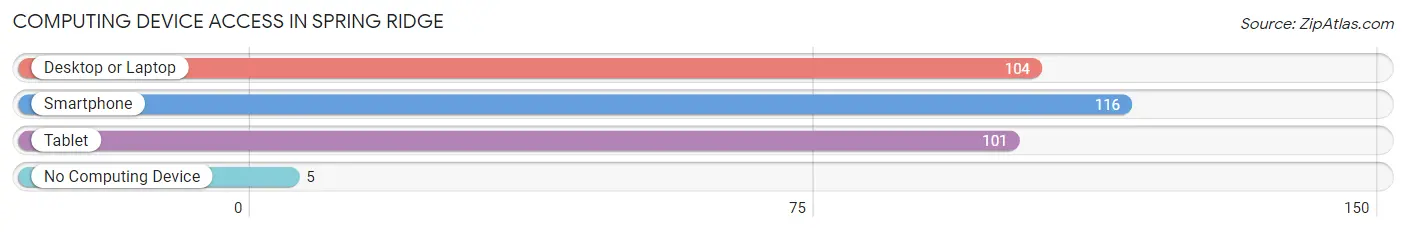
| Device Type | # Households | % Households |
| Desktop or Laptop | 104 | 86.0% |
| Smartphone | 116 | 95.9% |
| Tablet | 101 | 83.5% |
| No Computing Device | 5 | 4.1% |
| Total | 121 | 100.0% |
Internet Access in Spring Ridge
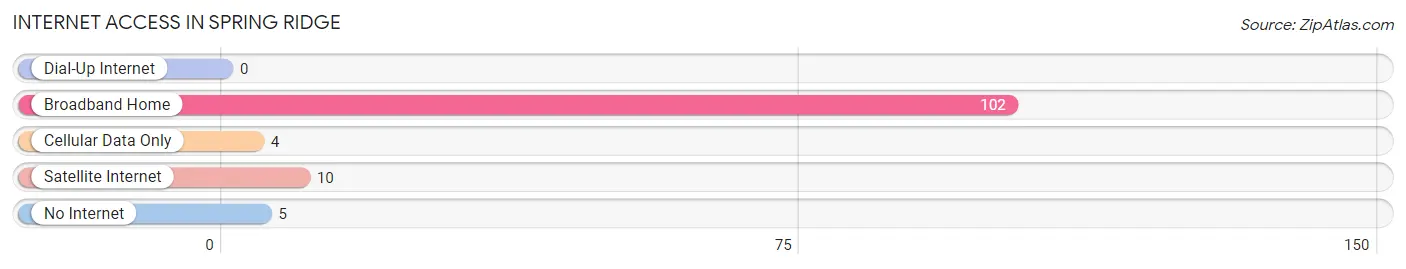
| Internet Type | # Households | % Households |
| Dial-Up Internet | 0 | 0.0% |
| Broadband Home | 102 | 84.3% |
| Cellular Data Only | 4 | 3.3% |
| Satellite Internet | 10 | 8.3% |
| No Internet | 5 | 4.1% |
| Total | 121 | 100.0% |
Spring Ridge Summary
Ridge Spring is a small town located in Saluda County, South Carolina. It is situated in the foothills of the Blue Ridge Mountains, approximately 25 miles northwest of Columbia, the state capital. The town was founded in 1820 and is home to a population of approximately 1,000 people.
History
Ridge Spring was founded in 1820 by a group of settlers from the nearby town of Saluda. The town was named after the nearby ridge of the Blue Ridge Mountains. The settlers were attracted to the area due to its fertile soil and abundant natural resources. The town quickly grew and by the mid-1800s, it had become a thriving agricultural community.
The town was also home to a number of businesses, including a general store, a blacksmith shop, a grist mill, and a cotton gin. In the late 1800s, the town was connected to the rest of the state by the Columbia, Newberry, and Laurens Railroad. This allowed for the transportation of goods and people to and from the town.
In the early 1900s, the town experienced a period of growth and prosperity. The town was home to a number of businesses, including a bank, a hotel, a movie theater, and a number of stores. The town also had a number of churches, including the First Baptist Church, which was founded in 1820.
Geography
Ridge Spring is located in the foothills of the Blue Ridge Mountains in Saluda County, South Carolina. The town is situated at an elevation of approximately 1,000 feet above sea level. The town is located approximately 25 miles northwest of Columbia, the state capital.
The town is located in a rural area and is surrounded by rolling hills and farmland. The town is located near the Saluda River, which is a tributary of the Broad River. The town is also located near the Sumter National Forest, which is a popular destination for outdoor recreation.
Economy
Ridge Spring is a small, rural town and the economy is largely based on agriculture. The town is home to a number of farms, which produce a variety of crops, including corn, soybeans, cotton, and tobacco. The town is also home to a number of businesses, including a general store, a bank, a hotel, and a number of stores.
The town is also home to a number of manufacturing businesses, including a furniture factory and a textile mill. The town is also home to a number of service businesses, including a number of restaurants, a gas station, and a number of auto repair shops.
Demographics
Ridge Spring is home to a population of approximately 1,000 people. The town is predominantly white, with approximately 95% of the population being white. The town is also home to a small African American population, with approximately 5% of the population being African American. The town is also home to a small Hispanic population, with approximately 2% of the population being Hispanic.
The town has a median household income of approximately $35,000, which is slightly lower than the state average. The town also has a poverty rate of approximately 15%, which is slightly higher than the state average. The town is also home to a number of educational institutions, including a public elementary school, a public middle school, and a public high school.
Common Questions
What is Per Capita Income in Spring Ridge?
Per Capita income in Spring Ridge is $40,570.
What is the Median Family Income in Spring Ridge?
Median Family Income in Spring Ridge is $60,357.
What is the Median Household income in Spring Ridge?
Median Household Income in Spring Ridge is $57,232.
What is Income or Wage Gap in Spring Ridge?
Income or Wage Gap in Spring Ridge is 26.1%.
Women in Spring Ridge earn 73.9 cents for every dollar earned by a man.
What is Inequality or Gini Index in Spring Ridge?
Inequality or Gini Index in Spring Ridge is 0.41.
What is the Total Population of Spring Ridge?
Total Population of Spring Ridge is 256.
What is the Total Male Population of Spring Ridge?
Total Male Population of Spring Ridge is 129.
What is the Total Female Population of Spring Ridge?
Total Female Population of Spring Ridge is 127.
What is the Ratio of Males per 100 Females in Spring Ridge?
There are 101.57 Males per 100 Females in Spring Ridge.
What is the Ratio of Females per 100 Males in Spring Ridge?
There are 98.45 Females per 100 Males in Spring Ridge.
What is the Median Population Age in Spring Ridge?
Median Population Age in Spring Ridge is 52.3 Years.
What is the Average Family Size in Spring Ridge
Average Family Size in Spring Ridge is 2.4 People.
What is the Average Household Size in Spring Ridge
Average Household Size in Spring Ridge is 2.1 People.
How Large is the Labor Force in Spring Ridge?
There are 117 People in the Labor Forcein in Spring Ridge.
What is the Percentage of People in the Labor Force in Spring Ridge?
56.3% of People are in the Labor Force in Spring Ridge.
What is the Unemployment Rate in Spring Ridge?
Unemployment Rate in Spring Ridge is 12.0%.