Punta Rassa, FL Map & Demographics
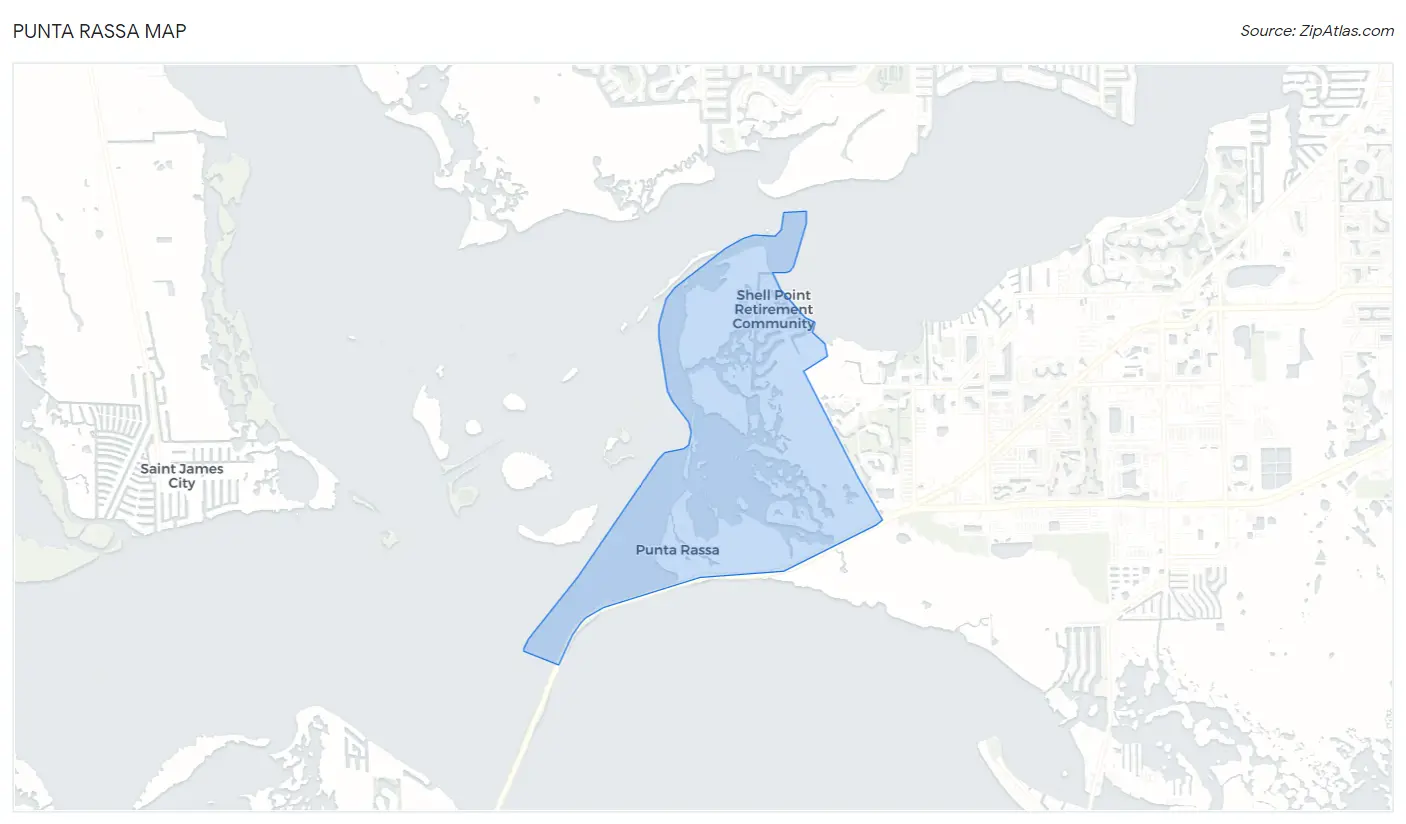
Punta Rassa Map
Punta Rassa Overview
$78,793
PER CAPITA INCOME
$105,000
AVG FAMILY INCOME
$90,000
AVG HOUSEHOLD INCOME
0.51
INEQUALITY / GINI INDEX
1,370
TOTAL POPULATION
580
MALE POPULATION
790
FEMALE POPULATION
73.42
MALES / 100 FEMALES
136.21
FEMALES / 100 MALES
81.1
MEDIAN AGE
2.0
AVG FAMILY SIZE
1.6
AVG HOUSEHOLD SIZE
89
LABOR FORCE [ PEOPLE ]
6.5%
PERCENT IN LABOR FORCE
Income in Punta Rassa
Income Overview in Punta Rassa
Per Capita Income in Punta Rassa is $78,793, while median incomes of families and households are $105,000 and $90,000 respectively.
| Characteristic | Number | Measure |
| Per Capita Income | 1,370 | $78,793 |
| Median Family Income | 434 | $105,000 |
| Mean Family Income | 434 | $144,237 |
| Median Household Income | 834 | $90,000 |
| Mean Household Income | 834 | $125,160 |
| Income Deficit | 434 | $0 |
| Wage / Income Gap (%) | 1,370 | 0.00% |
| Wage / Income Gap ($) | 1,370 | 100.00¢ per $1 |
| Gini / Inequality Index | 1,370 | 0.51 |
Earnings by Sex in Punta Rassa
| Sex | Number | Average Earnings |
| Male | 58 (51.8%) | $0 |
| Female | 54 (48.2%) | $0 |
| Total | 112 (100.0%) | $0 |
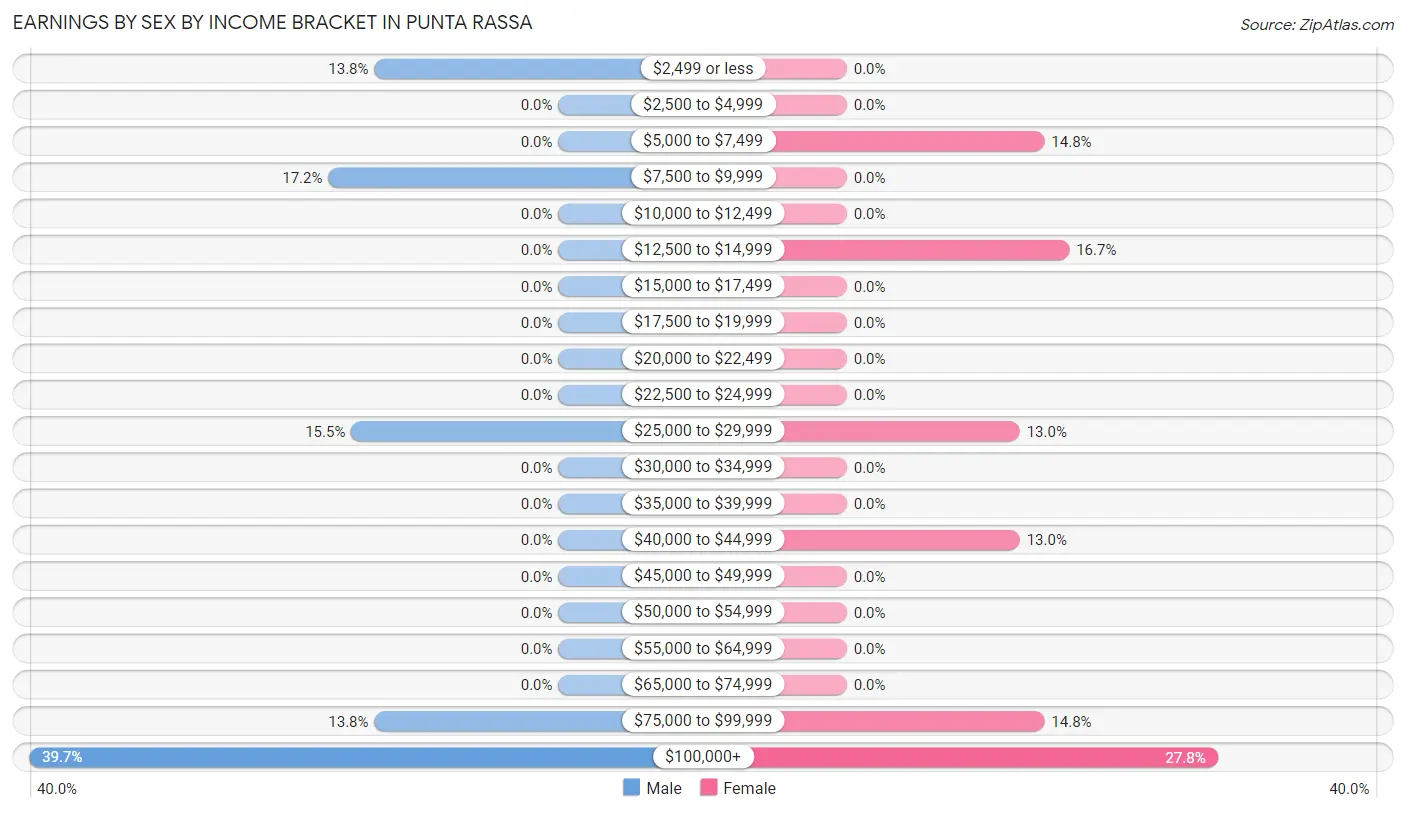
Earnings by Sex by Income Bracket in Punta Rassa
The most common earnings brackets in Punta Rassa are $100,000+ for men (23 | 39.7%) and $100,000+ for women (15 | 27.8%).
| Income | Male | Female |
| $2,499 or less | 8 (13.8%) | 0 (0.0%) |
| $2,500 to $4,999 | 0 (0.0%) | 0 (0.0%) |
| $5,000 to $7,499 | 0 (0.0%) | 8 (14.8%) |
| $7,500 to $9,999 | 10 (17.2%) | 0 (0.0%) |
| $10,000 to $12,499 | 0 (0.0%) | 0 (0.0%) |
| $12,500 to $14,999 | 0 (0.0%) | 9 (16.7%) |
| $15,000 to $17,499 | 0 (0.0%) | 0 (0.0%) |
| $17,500 to $19,999 | 0 (0.0%) | 0 (0.0%) |
| $20,000 to $22,499 | 0 (0.0%) | 0 (0.0%) |
| $22,500 to $24,999 | 0 (0.0%) | 0 (0.0%) |
| $25,000 to $29,999 | 9 (15.5%) | 7 (13.0%) |
| $30,000 to $34,999 | 0 (0.0%) | 0 (0.0%) |
| $35,000 to $39,999 | 0 (0.0%) | 0 (0.0%) |
| $40,000 to $44,999 | 0 (0.0%) | 7 (13.0%) |
| $45,000 to $49,999 | 0 (0.0%) | 0 (0.0%) |
| $50,000 to $54,999 | 0 (0.0%) | 0 (0.0%) |
| $55,000 to $64,999 | 0 (0.0%) | 0 (0.0%) |
| $65,000 to $74,999 | 0 (0.0%) | 0 (0.0%) |
| $75,000 to $99,999 | 8 (13.8%) | 8 (14.8%) |
| $100,000+ | 23 (39.7%) | 15 (27.8%) |
| Total | 58 (100.0%) | 54 (100.0%) |
Earnings by Sex by Educational Attainment in Punta Rassa
| Educational Attainment | Male Income | Female Income |
| Less than High School | - | - |
| High School Diploma | - | - |
| College or Associate's Degree | - | - |
| Bachelor's Degree | - | - |
| Graduate Degree | - | - |
| Total | - | - |
Family Income in Punta Rassa
Family Income Brackets in Punta Rassa
According to the Punta Rassa family income data, there are 124 families falling into the $100,000 to $149,999 income range, which is the most common income bracket and makes up 28.6% of all families.
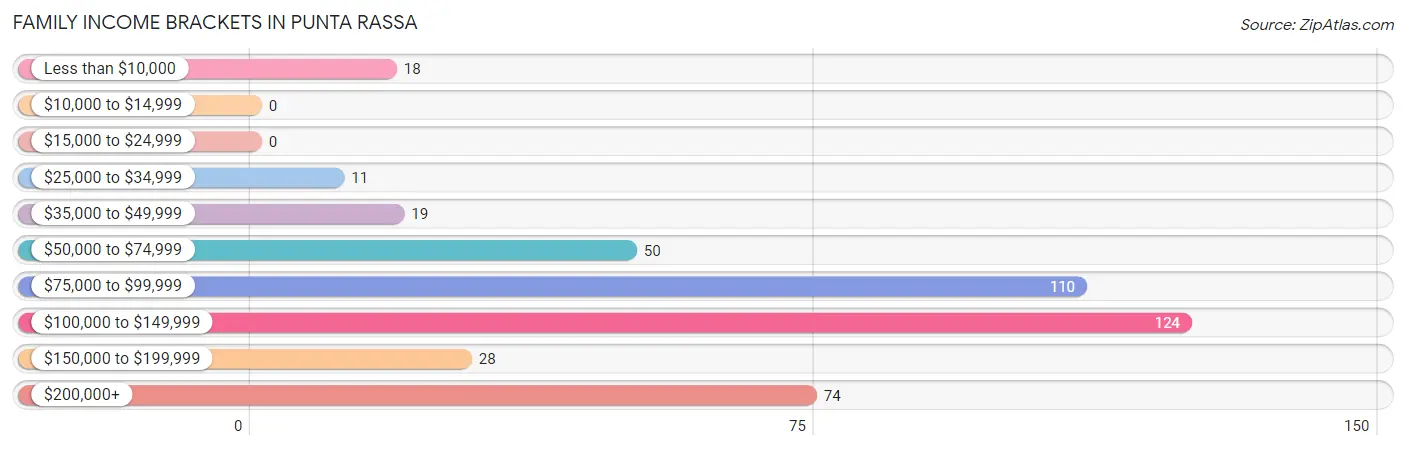
| Income Bracket | # Families | % Families |
| Less than $10,000 | 18 | 4.1% |
| $10,000 to $14,999 | 0 | 0.0% |
| $15,000 to $24,999 | 0 | 0.0% |
| $25,000 to $34,999 | 11 | 2.5% |
| $35,000 to $49,999 | 19 | 4.4% |
| $50,000 to $74,999 | 50 | 11.5% |
| $75,000 to $99,999 | 110 | 25.3% |
| $100,000 to $149,999 | 124 | 28.6% |
| $150,000 to $199,999 | 28 | 6.5% |
| $200,000+ | 74 | 17.1% |
Family Income by Famaliy Size in Punta Rassa
2-person families (434 | 100.0%) account for the highest median family income in Punta Rassa with $105,000 per family, while 2-person families (434 | 100.0%) have the highest median income of $52,500 per family member.
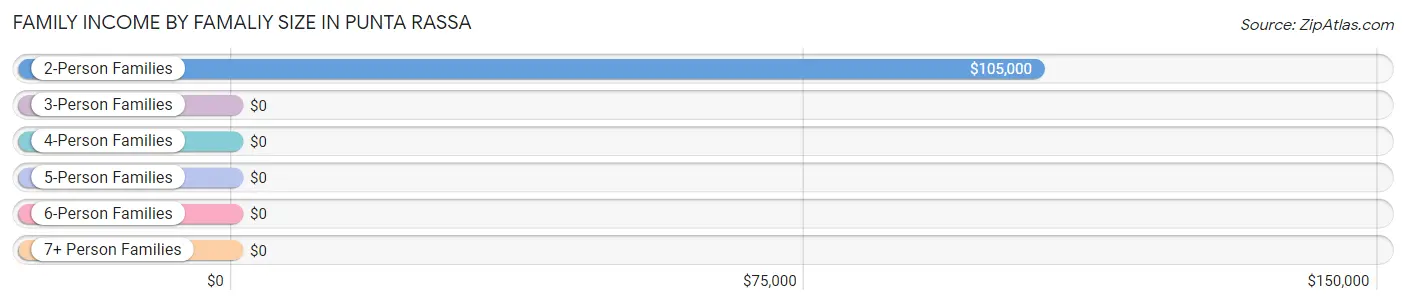
| Income Bracket | # Families | Median Income |
| 2-Person Families | 434 (100.0%) | $105,000 |
| 3-Person Families | 0 (0.0%) | $0 |
| 4-Person Families | 0 (0.0%) | $0 |
| 5-Person Families | 0 (0.0%) | $0 |
| 6-Person Families | 0 (0.0%) | $0 |
| 7+ Person Families | 0 (0.0%) | $0 |
| Total | 434 (100.0%) | $105,000 |
Family Income by Number of Earners in Punta Rassa
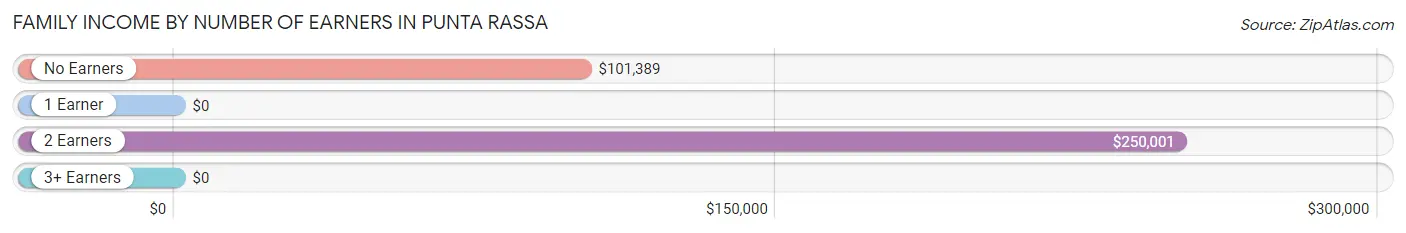
| Number of Earners | # Families | Median Income |
| No Earners | 378 (87.1%) | $101,389 |
| 1 Earner | 34 (7.8%) | $0 |
| 2 Earners | 22 (5.1%) | $250,001 |
| 3+ Earners | 0 (0.0%) | $0 |
| Total | 434 (100.0%) | $105,000 |
Household Income in Punta Rassa
Household Income Brackets in Punta Rassa
With 178 households falling in the category, the $100,000 to $149,999 income range is the most frequent in Punta Rassa, accounting for 21.3% of all households. In contrast, only 31 households (3.7%) fall into the $10,000 to $14,999 income bracket, making it the least populous group.
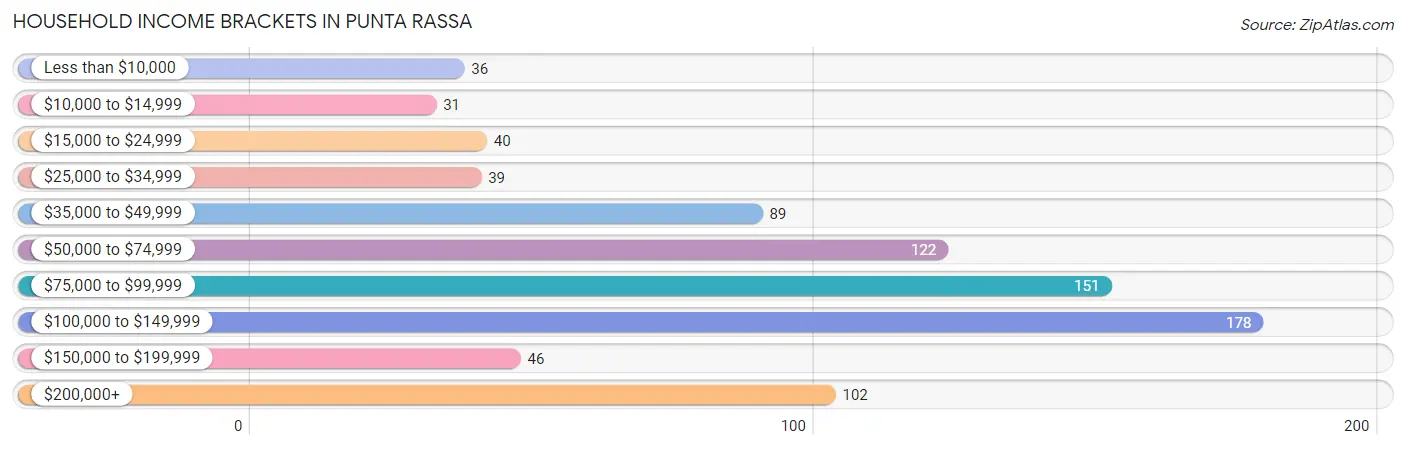
| Income Bracket | # Households | % Households |
| Less than $10,000 | 36 | 4.3% |
| $10,000 to $14,999 | 31 | 3.7% |
| $15,000 to $24,999 | 40 | 4.8% |
| $25,000 to $34,999 | 39 | 4.7% |
| $35,000 to $49,999 | 89 | 10.7% |
| $50,000 to $74,999 | 122 | 14.6% |
| $75,000 to $99,999 | 151 | 18.1% |
| $100,000 to $149,999 | 178 | 21.3% |
| $150,000 to $199,999 | 46 | 5.5% |
| $200,000+ | 102 | 12.2% |
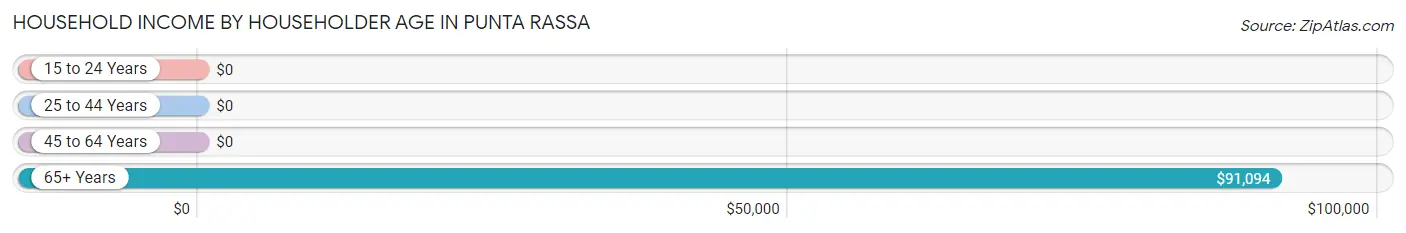
Household Income by Householder Age in Punta Rassa
The median household income in Punta Rassa is $90,000, with the highest median household income of $91,094 found in the 65+ years age bracket for the primary householder. A total of 742 households (89.0%) fall into this category.
| Income Bracket | # Households | Median Income |
| 15 to 24 Years | 0 (0.0%) | $0 |
| 25 to 44 Years | 0 (0.0%) | $0 |
| 45 to 64 Years | 92 (11.0%) | $0 |
| 65+ Years | 742 (89.0%) | $91,094 |
| Total | 834 (100.0%) | $90,000 |
Poverty in Punta Rassa
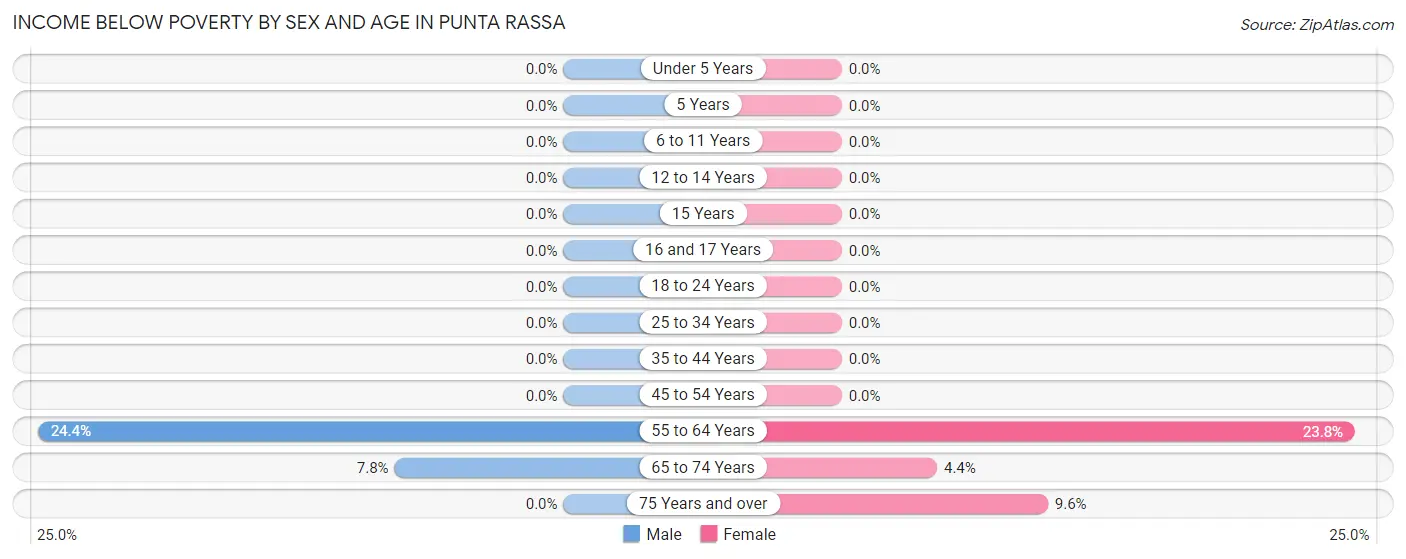
Income Below Poverty by Sex and Age in Punta Rassa
With 3.3% poverty level for males and 9.8% for females among the residents of Punta Rassa, 55 to 64 year old males and 55 to 64 year old females are the most vulnerable to poverty, with 10 males (24.4%) and 20 females (23.8%) in their respective age groups living below the poverty level.
| Age Bracket | Male | Female |
| Under 5 Years | 0 (0.0%) | 0 (0.0%) |
| 5 Years | 0 (0.0%) | 0 (0.0%) |
| 6 to 11 Years | 0 (0.0%) | 0 (0.0%) |
| 12 to 14 Years | 0 (0.0%) | 0 (0.0%) |
| 15 Years | 0 (0.0%) | 0 (0.0%) |
| 16 and 17 Years | 0 (0.0%) | 0 (0.0%) |
| 18 to 24 Years | 0 (0.0%) | 0 (0.0%) |
| 25 to 34 Years | 0 (0.0%) | 0 (0.0%) |
| 35 to 44 Years | 0 (0.0%) | 0 (0.0%) |
| 45 to 54 Years | 0 (0.0%) | 0 (0.0%) |
| 55 to 64 Years | 10 (24.4%) | 20 (23.8%) |
| 65 to 74 Years | 8 (7.8%) | 8 (4.4%) |
| 75 Years and over | 0 (0.0%) | 46 (9.6%) |
| Total | 18 (3.3%) | 74 (9.8%) |
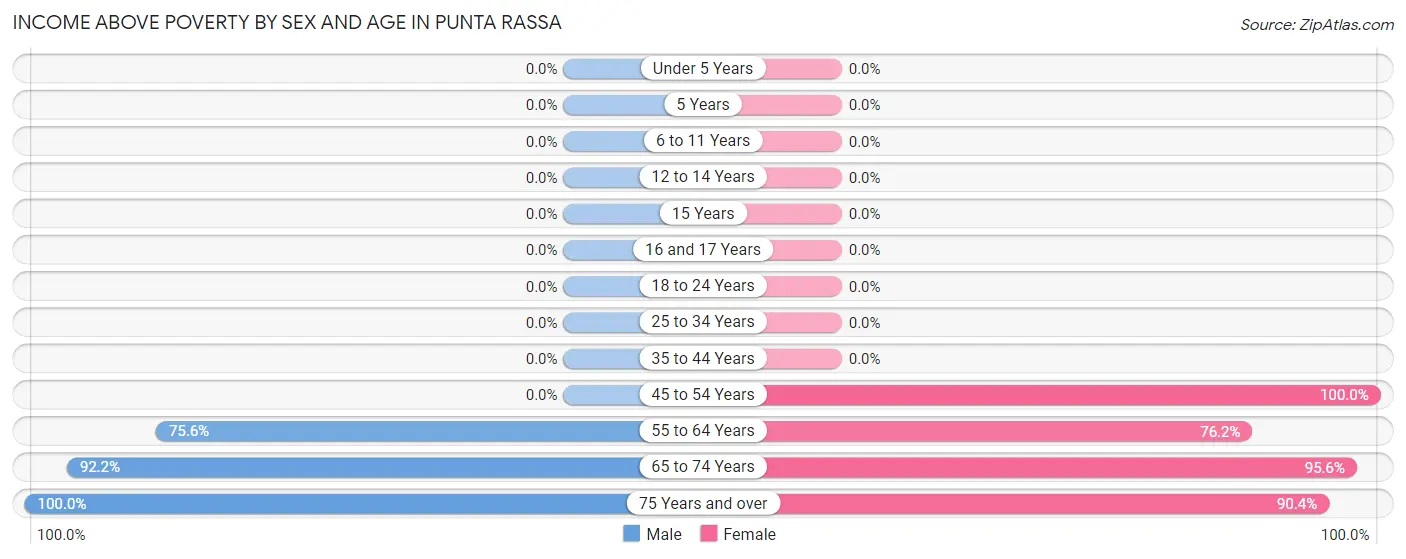
Income Above Poverty by Sex and Age in Punta Rassa
According to the poverty statistics in Punta Rassa, males aged 75 years and over and females aged 45 to 54 years are the age groups that are most secure financially, with 100.0% of males and 100.0% of females in these age groups living above the poverty line.
| Age Bracket | Male | Female |
| Under 5 Years | 0 (0.0%) | 0 (0.0%) |
| 5 Years | 0 (0.0%) | 0 (0.0%) |
| 6 to 11 Years | 0 (0.0%) | 0 (0.0%) |
| 12 to 14 Years | 0 (0.0%) | 0 (0.0%) |
| 15 Years | 0 (0.0%) | 0 (0.0%) |
| 16 and 17 Years | 0 (0.0%) | 0 (0.0%) |
| 18 to 24 Years | 0 (0.0%) | 0 (0.0%) |
| 25 to 34 Years | 0 (0.0%) | 0 (0.0%) |
| 35 to 44 Years | 0 (0.0%) | 0 (0.0%) |
| 45 to 54 Years | 0 (0.0%) | 7 (100.0%) |
| 55 to 64 Years | 31 (75.6%) | 64 (76.2%) |
| 65 to 74 Years | 94 (92.2%) | 173 (95.6%) |
| 75 Years and over | 404 (100.0%) | 435 (90.4%) |
| Total | 529 (96.7%) | 679 (90.2%) |
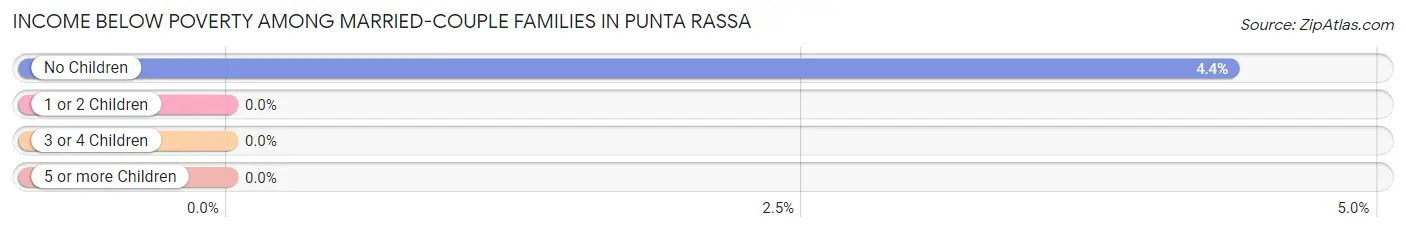
Income Below Poverty Among Married-Couple Families in Punta Rassa
The poverty statistics for married-couple families in Punta Rassa show that 4.4% or 18 of the total 413 families live below the poverty line. Families with no children have the highest poverty rate of 4.4%, comprising of 18 families. On the other hand, families with no children have the lowest poverty rate of 4.4%, which includes 18 families.
| Children | Above Poverty | Below Poverty |
| No Children | 395 (95.6%) | 18 (4.4%) |
| 1 or 2 Children | 0 (0.0%) | 0 (0.0%) |
| 3 or 4 Children | 0 (0.0%) | 0 (0.0%) |
| 5 or more Children | 0 (0.0%) | 0 (0.0%) |
| Total | 395 (95.6%) | 18 (4.4%) |
Income Below Poverty Among Single-Parent Households in Punta Rassa
| Children | Single Father | Single Mother |
| No Children | 0 (0.0%) | 0 (0.0%) |
| 1 or 2 Children | 0 (0.0%) | 0 (0.0%) |
| 3 or 4 Children | 0 (0.0%) | 0 (0.0%) |
| 5 or more Children | 0 (0.0%) | 0 (0.0%) |
| Total | 0 (0.0%) | 0 (0.0%) |
Income Below Poverty Among Married-Couple vs Single-Parent Households in Punta Rassa
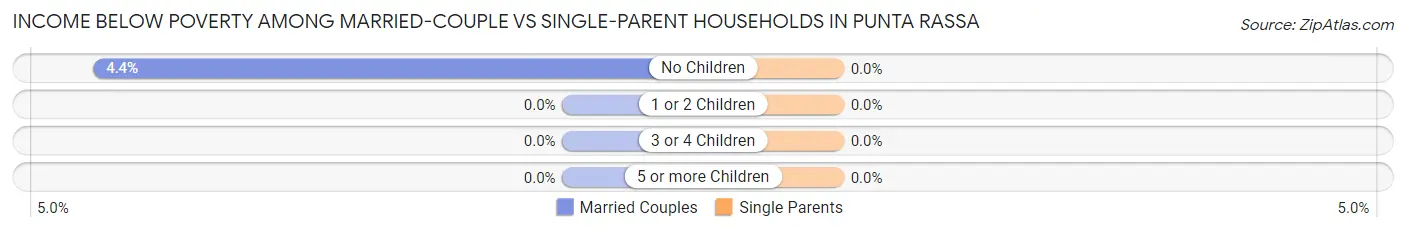
| Children | Married-Couple Families | Single-Parent Households |
| No Children | 18 (4.4%) | 0 (0.0%) |
| 1 or 2 Children | 0 (0.0%) | 0 (0.0%) |
| 3 or 4 Children | 0 (0.0%) | 0 (0.0%) |
| 5 or more Children | 0 (0.0%) | 0 (0.0%) |
| Total | 18 (4.4%) | 0 (0.0%) |
Race in Punta Rassa
The most populous races in Punta Rassa are White / Caucasian (1,342 | 98.0%), Asian (15 | 1.1%), and Hispanic or Latino (11 | 0.8%).
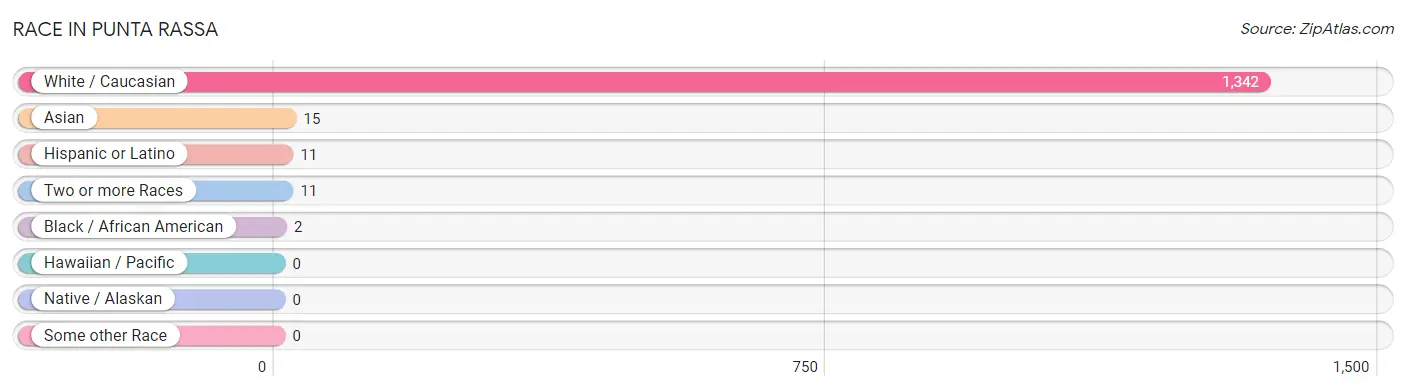
| Race | # Population | % Population |
| Asian | 15 | 1.1% |
| Black / African American | 2 | 0.2% |
| Hawaiian / Pacific | 0 | 0.0% |
| Hispanic or Latino | 11 | 0.8% |
| Native / Alaskan | 0 | 0.0% |
| White / Caucasian | 1,342 | 98.0% |
| Two or more Races | 11 | 0.8% |
| Some other Race | 0 | 0.0% |
| Total | 1,370 | 100.0% |
Ancestry in Punta Rassa
The most populous ancestries reported in Punta Rassa are English (388 | 28.3%), American (218 | 15.9%), German (167 | 12.2%), Irish (123 | 9.0%), and Romanian (66 | 4.8%), together accounting for 70.2% of all Punta Rassa residents.
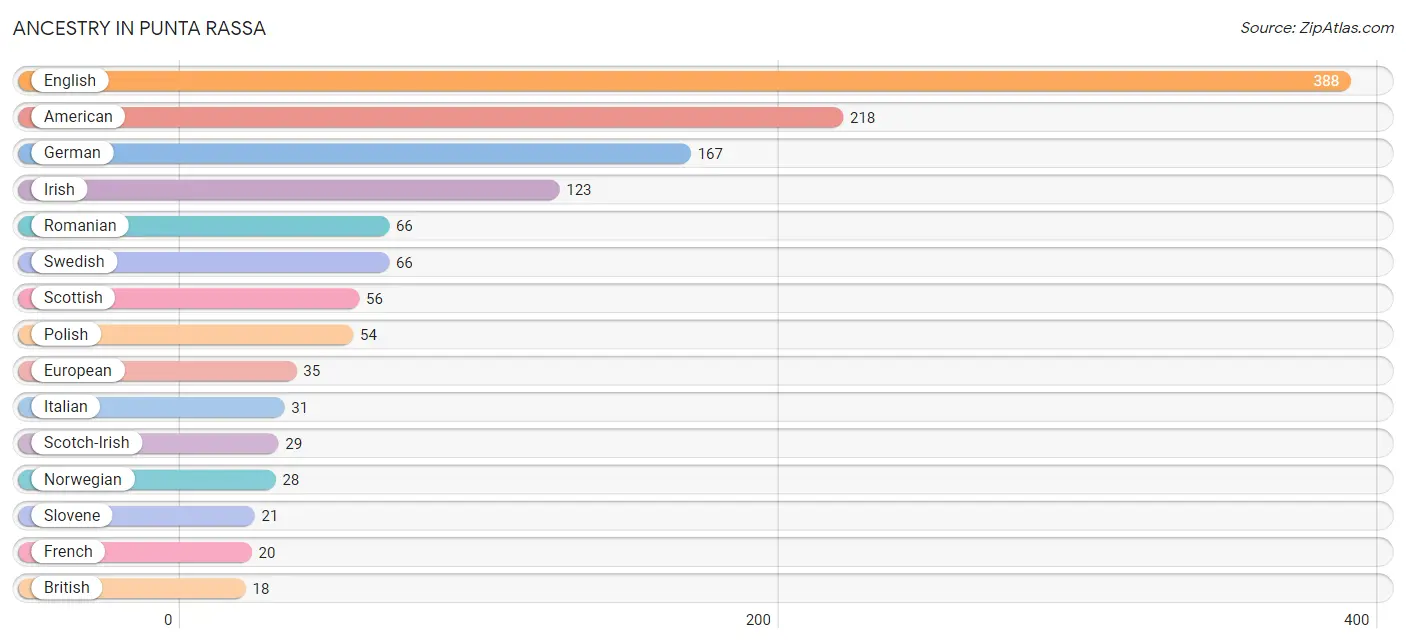
| Ancestry | # Population | % Population |
| American | 218 | 15.9% |
| British | 18 | 1.3% |
| Canadian | 8 | 0.6% |
| Cuban | 2 | 0.2% |
| Czech | 8 | 0.6% |
| Danish | 15 | 1.1% |
| Dutch | 14 | 1.0% |
| English | 388 | 28.3% |
| European | 35 | 2.5% |
| Finnish | 8 | 0.6% |
| French | 20 | 1.5% |
| German | 167 | 12.2% |
| Hungarian | 2 | 0.2% |
| Irish | 123 | 9.0% |
| Italian | 31 | 2.3% |
| Norwegian | 28 | 2.0% |
| Polish | 54 | 3.9% |
| Puerto Rican | 9 | 0.7% |
| Romanian | 66 | 4.8% |
| Scandinavian | 7 | 0.5% |
| Scotch-Irish | 29 | 2.1% |
| Scottish | 56 | 4.1% |
| Slovak | 15 | 1.1% |
| Slovene | 21 | 1.5% |
| Swedish | 66 | 4.8% |
| Swiss | 9 | 0.7% |
| Thai | 8 | 0.6% |
| Ukrainian | 18 | 1.3% |
| Welsh | 15 | 1.1% |
| Yugoslavian | 11 | 0.8% | View All 30 Rows |
Immigrants in Punta Rassa
The most numerous immigrant groups reported in Punta Rassa came from Europe (71 | 5.2%), Northern Europe (49 | 3.6%), Asia (15 | 1.1%), South Central Asia (15 | 1.1%), and Eastern Europe (11 | 0.8%), together accounting for 11.7% of all Punta Rassa residents.
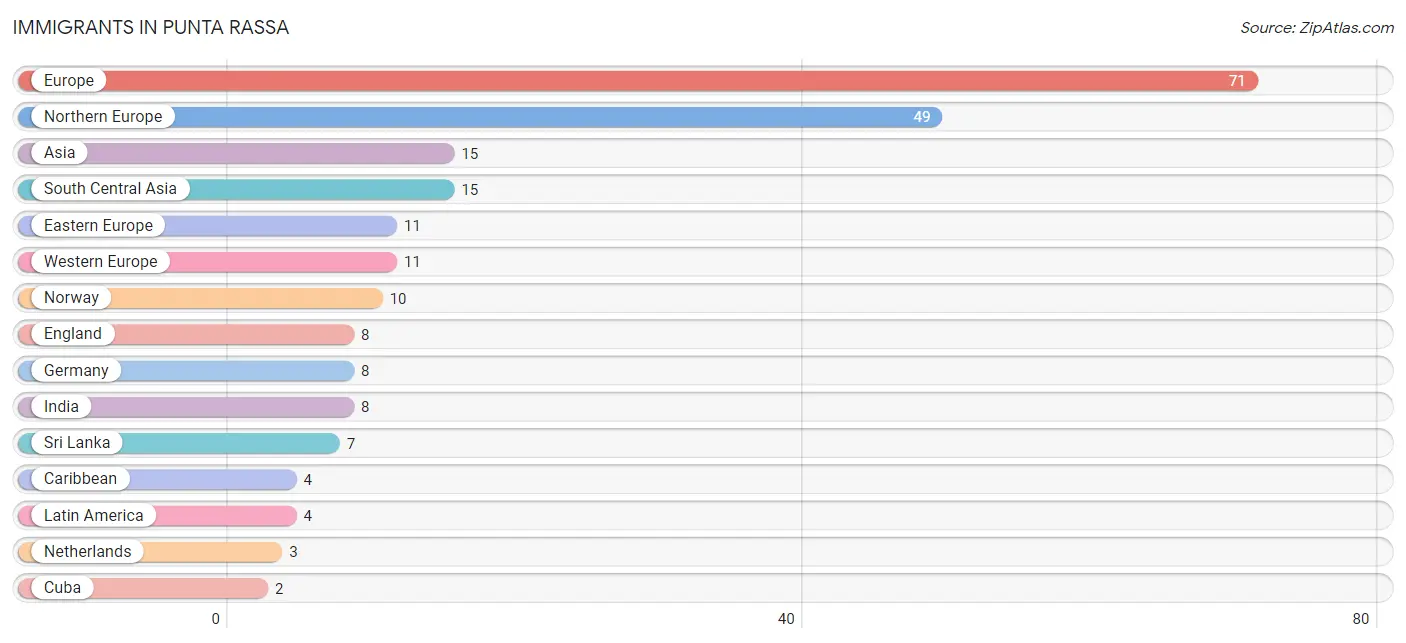
| Immigration Origin | # Population | % Population |
| Asia | 15 | 1.1% |
| Caribbean | 4 | 0.3% |
| Cuba | 2 | 0.2% |
| Eastern Europe | 11 | 0.8% |
| England | 8 | 0.6% |
| Europe | 71 | 5.2% |
| Germany | 8 | 0.6% |
| Haiti | 2 | 0.2% |
| India | 8 | 0.6% |
| Latin America | 4 | 0.3% |
| Netherlands | 3 | 0.2% |
| Northern Europe | 49 | 3.6% |
| Norway | 10 | 0.7% |
| South Central Asia | 15 | 1.1% |
| Sri Lanka | 7 | 0.5% |
| Western Europe | 11 | 0.8% | View All 16 Rows |
Sex and Age in Punta Rassa
Sex and Age in Punta Rassa
The most populous age groups in Punta Rassa are 80 to 84 Years (187 | 32.2%) for men and 80 to 84 Years (224 | 28.3%) for women.
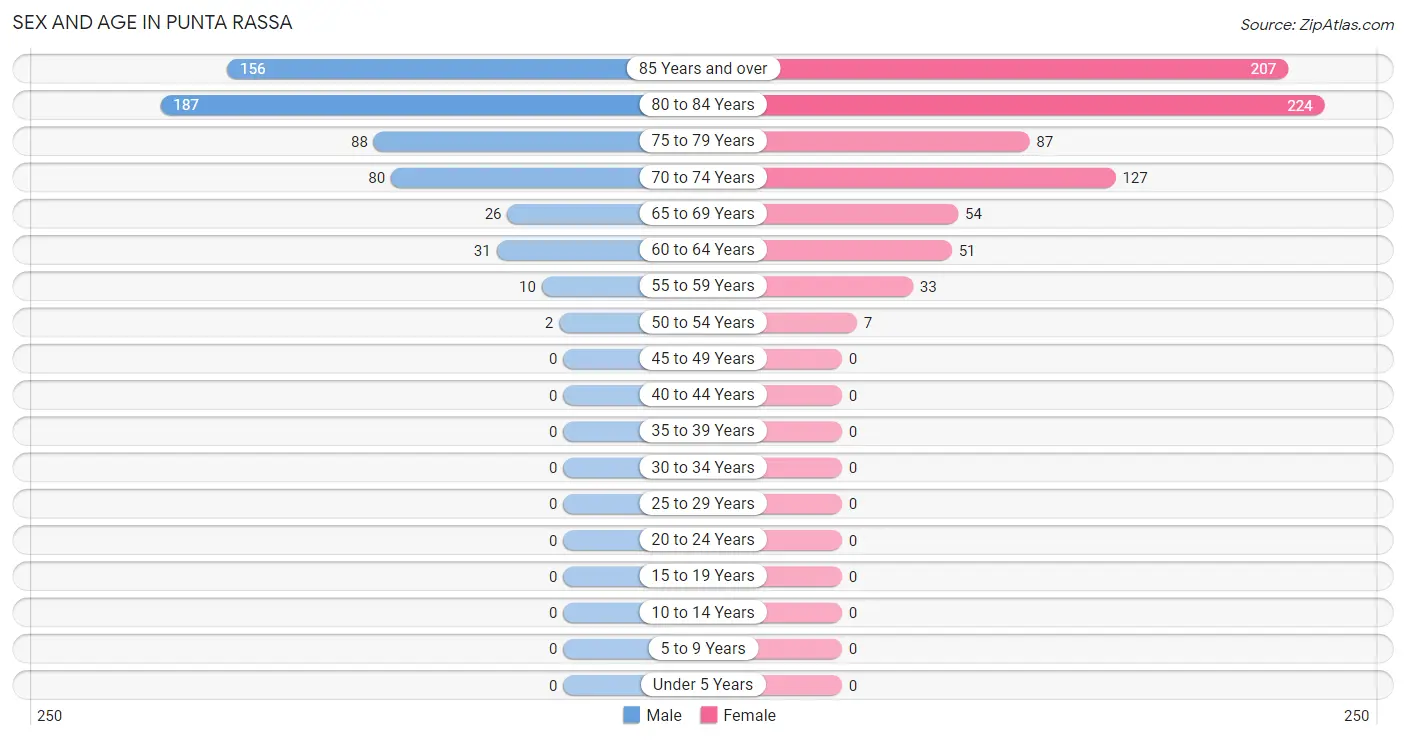
| Age Bracket | Male | Female |
| Under 5 Years | 0 (0.0%) | 0 (0.0%) |
| 5 to 9 Years | 0 (0.0%) | 0 (0.0%) |
| 10 to 14 Years | 0 (0.0%) | 0 (0.0%) |
| 15 to 19 Years | 0 (0.0%) | 0 (0.0%) |
| 20 to 24 Years | 0 (0.0%) | 0 (0.0%) |
| 25 to 29 Years | 0 (0.0%) | 0 (0.0%) |
| 30 to 34 Years | 0 (0.0%) | 0 (0.0%) |
| 35 to 39 Years | 0 (0.0%) | 0 (0.0%) |
| 40 to 44 Years | 0 (0.0%) | 0 (0.0%) |
| 45 to 49 Years | 0 (0.0%) | 0 (0.0%) |
| 50 to 54 Years | 2 (0.3%) | 7 (0.9%) |
| 55 to 59 Years | 10 (1.7%) | 33 (4.2%) |
| 60 to 64 Years | 31 (5.3%) | 51 (6.5%) |
| 65 to 69 Years | 26 (4.5%) | 54 (6.8%) |
| 70 to 74 Years | 80 (13.8%) | 127 (16.1%) |
| 75 to 79 Years | 88 (15.2%) | 87 (11.0%) |
| 80 to 84 Years | 187 (32.2%) | 224 (28.3%) |
| 85 Years and over | 156 (26.9%) | 207 (26.2%) |
| Total | 580 (100.0%) | 790 (100.0%) |
Families and Households in Punta Rassa
Median Family Size in Punta Rassa
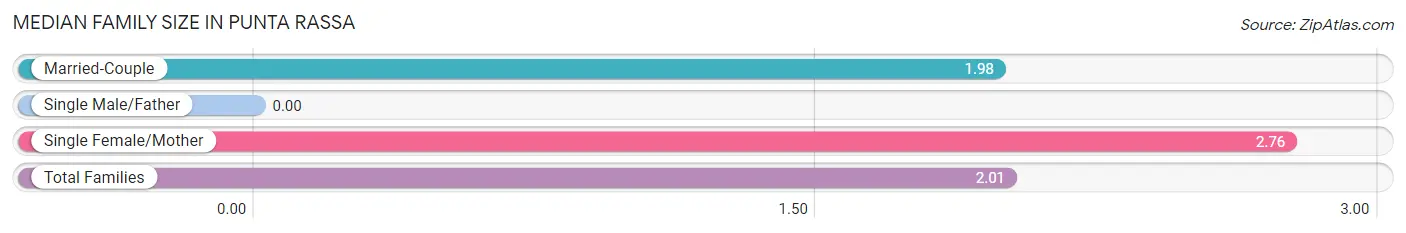
| Family Type | # Families | Family Size |
| Married-Couple | 413 (95.2%) | 1.98 |
| Single Male/Father | 0 (0.0%) | - |
| Single Female/Mother | 21 (4.8%) | 2.76 |
| Total Families | 434 (100.0%) | 2.01 |
Median Household Size in Punta Rassa
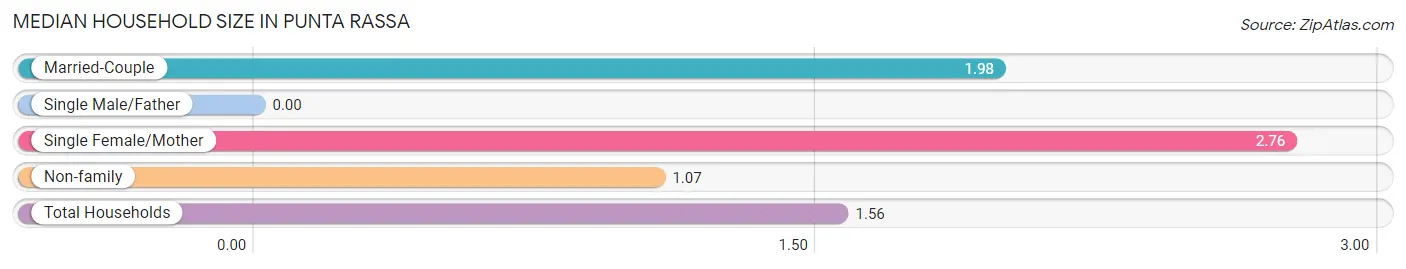
| Household Type | # Households | Household Size |
| Married-Couple | 413 (49.5%) | 1.98 |
| Single Male/Father | 0 (0.0%) | - |
| Single Female/Mother | 21 (2.5%) | 2.76 |
| Non-family | 400 (48.0%) | 1.07 |
| Total Households | 834 (100.0%) | 1.56 |
Household Size by Marriage Status in Punta Rassa
Out of a total of 834 households in Punta Rassa, 434 (52.0%) are family households, while 400 (48.0%) are nonfamily households. The most numerous type of family households are 2-person households, comprising 434, and the most common type of nonfamily households are 1-person households, comprising 382.
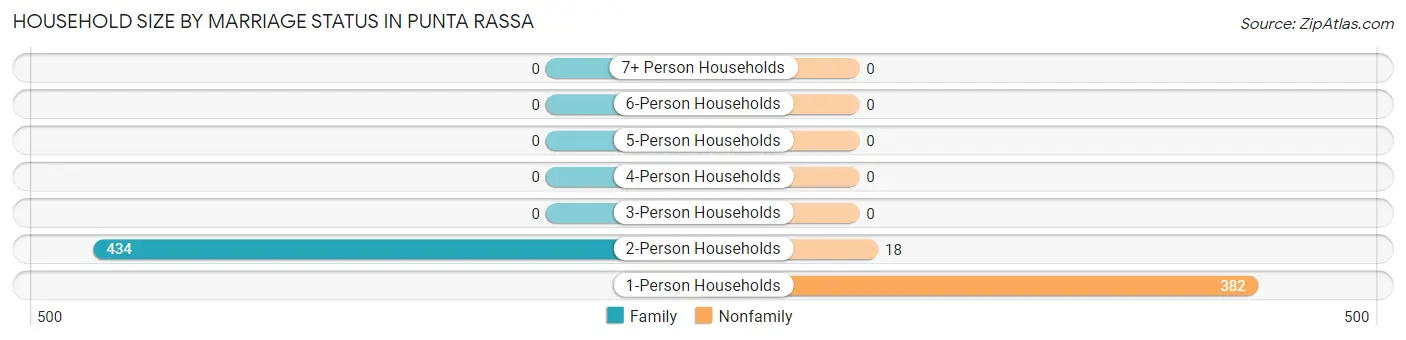
| Household Size | Family Households | Nonfamily Households |
| 1-Person Households | - | 382 (45.8%) |
| 2-Person Households | 434 (52.0%) | 18 (2.2%) |
| 3-Person Households | 0 (0.0%) | 0 (0.0%) |
| 4-Person Households | 0 (0.0%) | 0 (0.0%) |
| 5-Person Households | 0 (0.0%) | 0 (0.0%) |
| 6-Person Households | 0 (0.0%) | 0 (0.0%) |
| 7+ Person Households | 0 (0.0%) | 0 (0.0%) |
| Total | 434 (52.0%) | 400 (48.0%) |
Female Fertility in Punta Rassa
Fertility by Age in Punta Rassa
| Age Bracket | Women with Births | Births / 1,000 Women |
| 15 to 19 years | 0 (0.0%) | 0.0 |
| 20 to 34 years | 0 (0.0%) | 0.0 |
| 35 to 50 years | 0 (0.0%) | 0.0 |
| Total | 0 (0.0%) | 0.0 |
Fertility by Age by Marriage Status in Punta Rassa
| Age Bracket | Married | Unmarried |
| 15 to 19 years | 0 (0.0%) | 0 (0.0%) |
| 20 to 34 years | 0 (0.0%) | 0 (0.0%) |
| 35 to 50 years | 0 (0.0%) | 0 (0.0%) |
| Total | 0 (0.0%) | 0 (0.0%) |
Fertility by Education in Punta Rassa
| Educational Attainment | Women with Births | Births / 1,000 Women |
| Less than High School | 0 (0.0%) | 0.0 |
| High School Diploma | 0 (0.0%) | 0.0 |
| College or Associate's Degree | 0 (0.0%) | 0.0 |
| Bachelor's Degree | 0 (0.0%) | 0.0 |
| Graduate Degree | 0 (0.0%) | 0.0 |
| Total | 0 (0.0%) | 0.0 |
Fertility by Education by Marriage Status in Punta Rassa
| Educational Attainment | Married | Unmarried |
| Less than High School | 0 (0.0%) | 0 (0.0%) |
| High School Diploma | 0 (0.0%) | 0 (0.0%) |
| College or Associate's Degree | 0 (0.0%) | 0 (0.0%) |
| Bachelor's Degree | 0 (0.0%) | 0 (0.0%) |
| Graduate Degree | 0 (0.0%) | 0 (0.0%) |
| Total | 0 (0.0%) | 0 (0.0%) |
Employment Characteristics in Punta Rassa
Employment by Class of Employer in Punta Rassa
Among the 89 employed individuals in Punta Rassa, not-for-profit organizations (42 | 47.2%), private company employees (32 | 36.0%), and self-employed (not incorporated) (8 | 9.0%) make up the most common classes of employment.
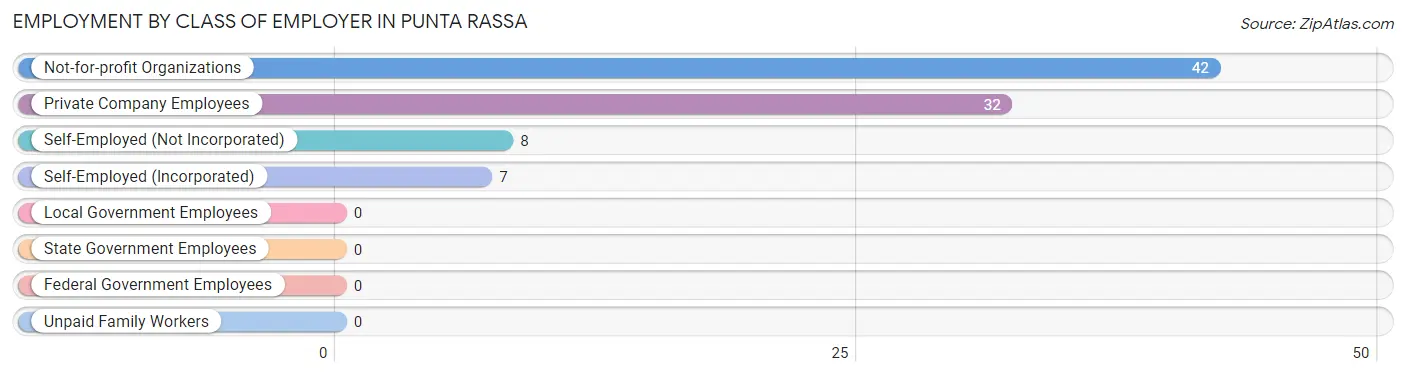
| Employer Class | # Employees | % Employees |
| Private Company Employees | 32 | 36.0% |
| Self-Employed (Incorporated) | 7 | 7.9% |
| Self-Employed (Not Incorporated) | 8 | 9.0% |
| Not-for-profit Organizations | 42 | 47.2% |
| Local Government Employees | 0 | 0.0% |
| State Government Employees | 0 | 0.0% |
| Federal Government Employees | 0 | 0.0% |
| Unpaid Family Workers | 0 | 0.0% |
| Total | 89 | 100.0% |
Employment Status by Age in Punta Rassa
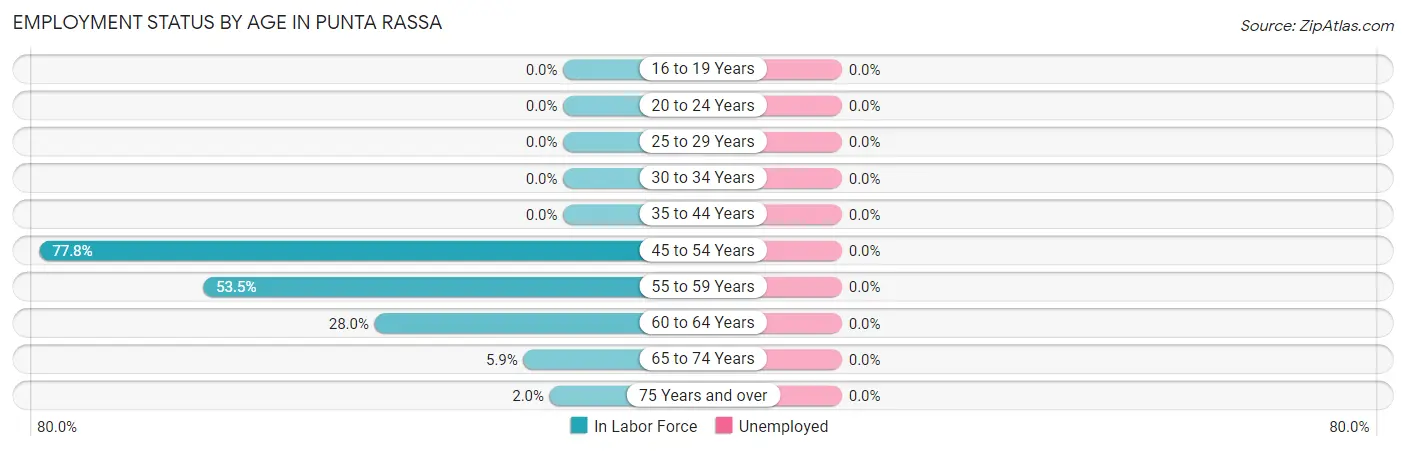
| Age Bracket | In Labor Force | Unemployed |
| 16 to 19 Years | 0 (0.0%) | 0 (0.0%) |
| 20 to 24 Years | 0 (0.0%) | 0 (0.0%) |
| 25 to 29 Years | 0 (0.0%) | 0 (0.0%) |
| 30 to 34 Years | 0 (0.0%) | 0 (0.0%) |
| 35 to 44 Years | 0 (0.0%) | 0 (0.0%) |
| 45 to 54 Years | 7 (77.8%) | 0 (0.0%) |
| 55 to 59 Years | 23 (53.5%) | 0 (0.0%) |
| 60 to 64 Years | 23 (28.0%) | 0 (0.0%) |
| 65 to 74 Years | 17 (5.9%) | 0 (0.0%) |
| 75 Years and over | 19 (2.0%) | 0 (0.0%) |
| Total | 89 (6.5%) | 0 (0.0%) |
Employment Status by Educational Attainment in Punta Rassa
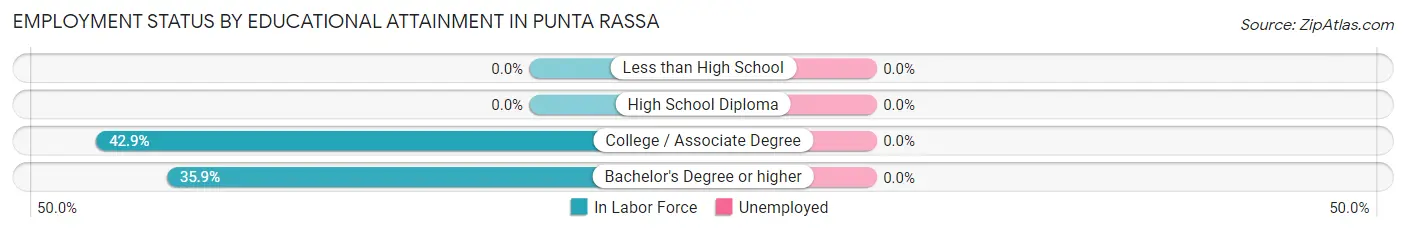
| Educational Attainment | In Labor Force | Unemployed |
| Less than High School | 0 (0.0%) | 0 (0.0%) |
| High School Diploma | 0 (0.0%) | 0 (0.0%) |
| College / Associate Degree | 30 (42.9%) | 0 (0.0%) |
| Bachelor's Degree or higher | 23 (35.9%) | 0 (0.0%) |
| Total | 53 (39.6%) | 0 (0.0%) |
Employment Occupations by Sex in Punta Rassa
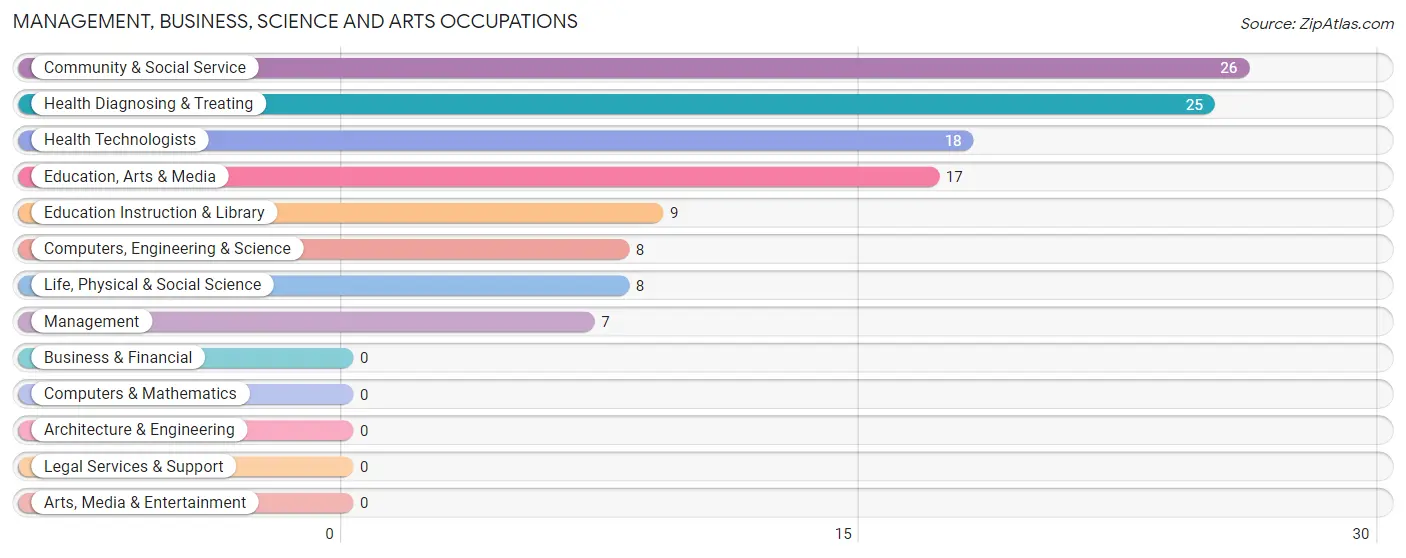
Management, Business, Science and Arts Occupations
The most common Management, Business, Science and Arts occupations in Punta Rassa are Community & Social Service (26 | 29.2%), Health Diagnosing & Treating (25 | 28.1%), Health Technologists (18 | 20.2%), Education, Arts & Media (17 | 19.1%), and Education Instruction & Library (9 | 10.1%).
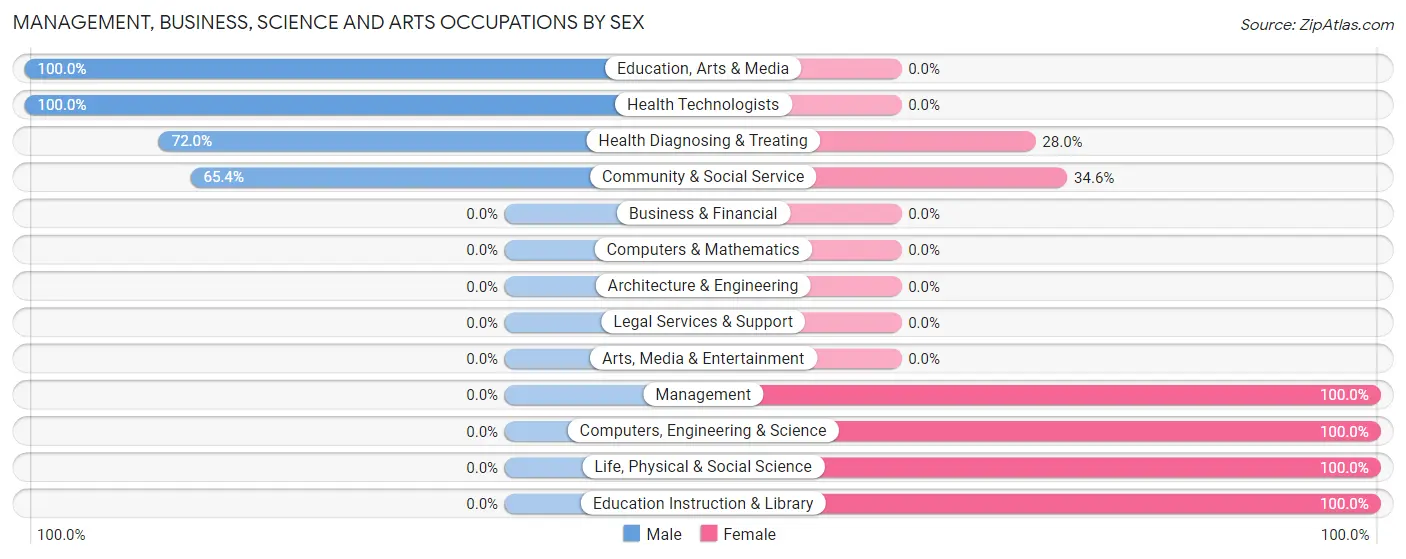
Management, Business, Science and Arts Occupations by Sex
Within the Management, Business, Science and Arts occupations in Punta Rassa, the most male-oriented occupations are Education, Arts & Media (100.0%), Health Technologists (100.0%), and Health Diagnosing & Treating (72.0%), while the most female-oriented occupations are Management (100.0%), Computers, Engineering & Science (100.0%), and Life, Physical & Social Science (100.0%).
| Occupation | Male | Female |
| Management | 0 (0.0%) | 7 (100.0%) |
| Business & Financial | 0 (0.0%) | 0 (0.0%) |
| Computers, Engineering & Science | 0 (0.0%) | 8 (100.0%) |
| Computers & Mathematics | 0 (0.0%) | 0 (0.0%) |
| Architecture & Engineering | 0 (0.0%) | 0 (0.0%) |
| Life, Physical & Social Science | 0 (0.0%) | 8 (100.0%) |
| Community & Social Service | 17 (65.4%) | 9 (34.6%) |
| Education, Arts & Media | 17 (100.0%) | 0 (0.0%) |
| Legal Services & Support | 0 (0.0%) | 0 (0.0%) |
| Education Instruction & Library | 0 (0.0%) | 9 (100.0%) |
| Arts, Media & Entertainment | 0 (0.0%) | 0 (0.0%) |
| Health Diagnosing & Treating | 18 (72.0%) | 7 (28.0%) |
| Health Technologists | 18 (100.0%) | 0 (0.0%) |
| Total (Category) | 35 (53.0%) | 31 (47.0%) |
| Total (Overall) | 35 (39.3%) | 54 (60.7%) |
Services Occupations
Services Occupations by Sex
| Occupation | Male | Female |
| Healthcare Support | 0 (0.0%) | 0 (0.0%) |
| Security & Protection | 0 (0.0%) | 0 (0.0%) |
| Firefighting & Prevention | 0 (0.0%) | 0 (0.0%) |
| Law Enforcement | 0 (0.0%) | 0 (0.0%) |
| Food Preparation & Serving | 0 (0.0%) | 0 (0.0%) |
| Cleaning & Maintenance | 0 (0.0%) | 0 (0.0%) |
| Personal Care & Service | 0 (0.0%) | 0 (0.0%) |
| Total (Category) | 0 (0.0%) | 0 (0.0%) |
| Total (Overall) | 35 (39.3%) | 54 (60.7%) |
Sales and Office Occupations
The most common Sales and Office occupations in Punta Rassa are Sales & Related (15 | 16.9%), and Office & Administration (8 | 9.0%).
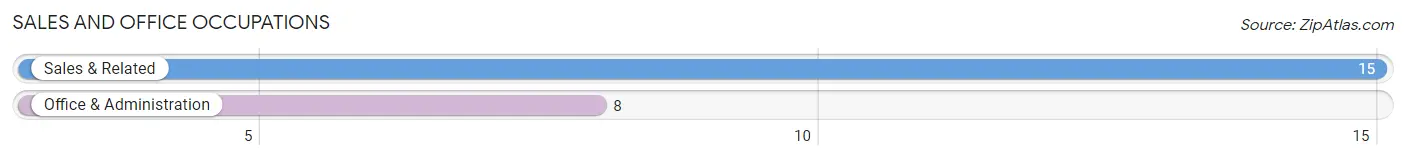
Sales and Office Occupations by Sex
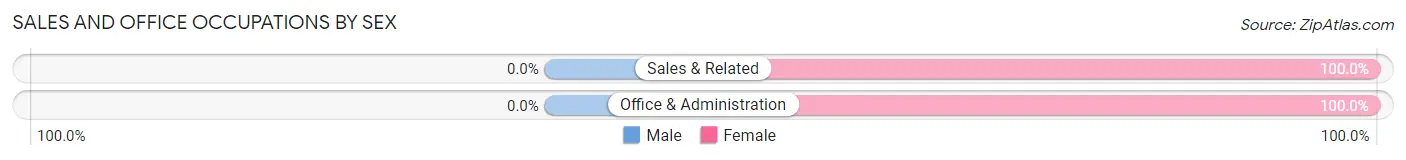
| Occupation | Male | Female |
| Sales & Related | 0 (0.0%) | 15 (100.0%) |
| Office & Administration | 0 (0.0%) | 8 (100.0%) |
| Total (Category) | 0 (0.0%) | 23 (100.0%) |
| Total (Overall) | 35 (39.3%) | 54 (60.7%) |
Natural Resources, Construction and Maintenance Occupations
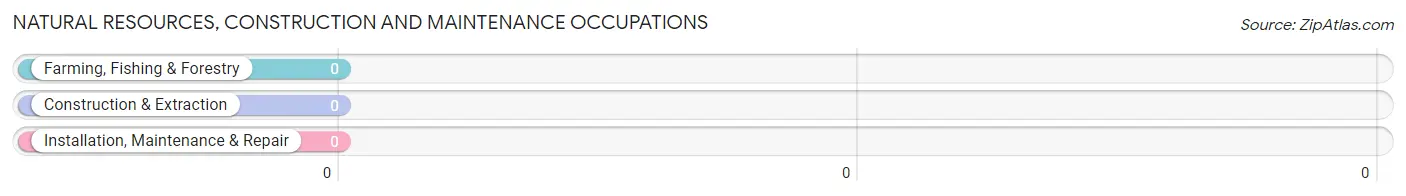
Natural Resources, Construction and Maintenance Occupations by Sex
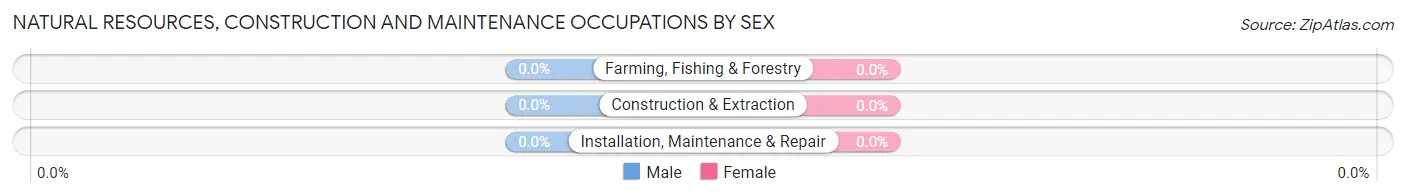
| Occupation | Male | Female |
| Farming, Fishing & Forestry | 0 (0.0%) | 0 (0.0%) |
| Construction & Extraction | 0 (0.0%) | 0 (0.0%) |
| Installation, Maintenance & Repair | 0 (0.0%) | 0 (0.0%) |
| Total (Category) | 0 (0.0%) | 0 (0.0%) |
| Total (Overall) | 35 (39.3%) | 54 (60.7%) |
Production, Transportation and Moving Occupations
Production, Transportation and Moving Occupations by Sex
| Occupation | Male | Female |
| Production | 0 (0.0%) | 0 (0.0%) |
| Transportation | 0 (0.0%) | 0 (0.0%) |
| Material Moving | 0 (0.0%) | 0 (0.0%) |
| Total (Category) | 0 (0.0%) | 0 (0.0%) |
| Total (Overall) | 35 (39.3%) | 54 (60.7%) |
Employment Industries by Sex in Punta Rassa
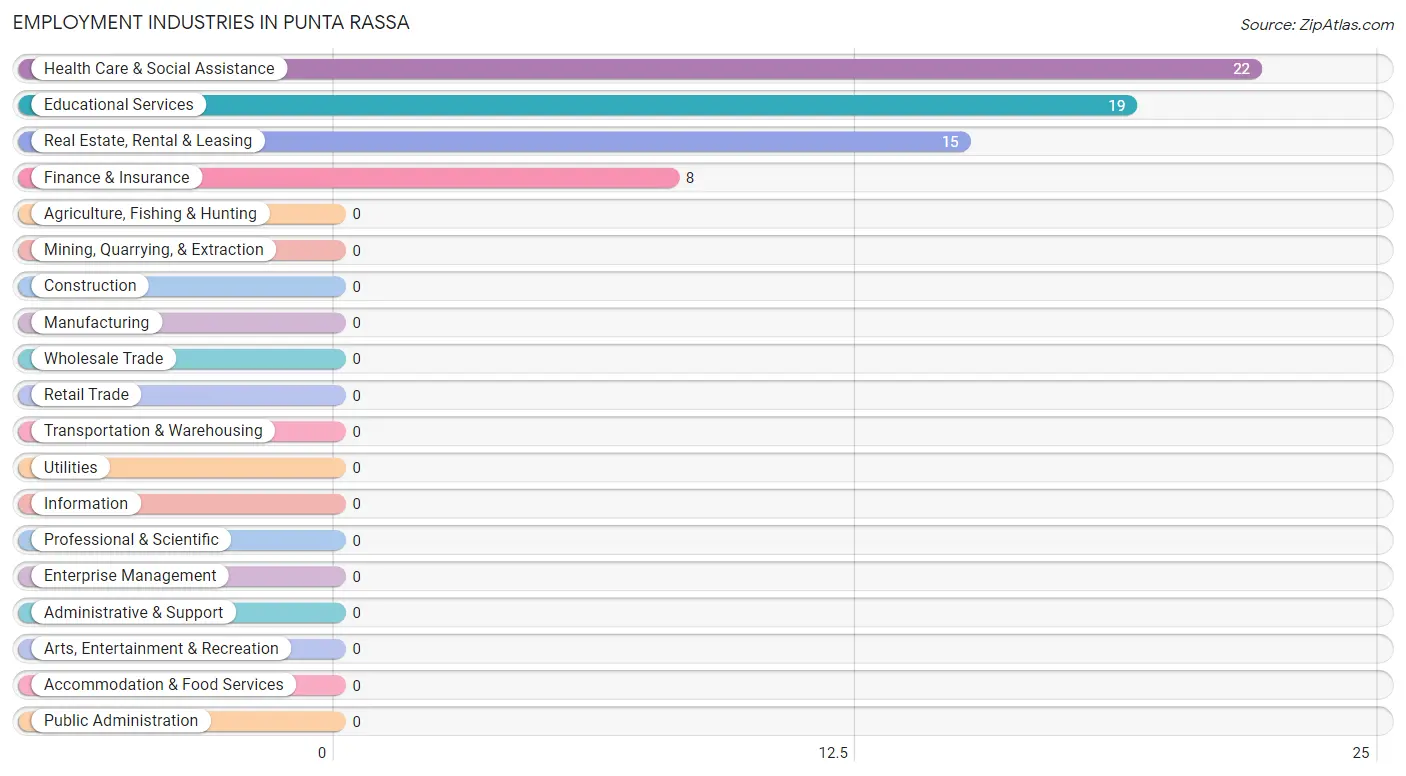
Employment Industries in Punta Rassa
The major employment industries in Punta Rassa include Health Care & Social Assistance (22 | 24.7%), Educational Services (19 | 21.3%), Real Estate, Rental & Leasing (15 | 16.9%), and Finance & Insurance (8 | 9.0%).
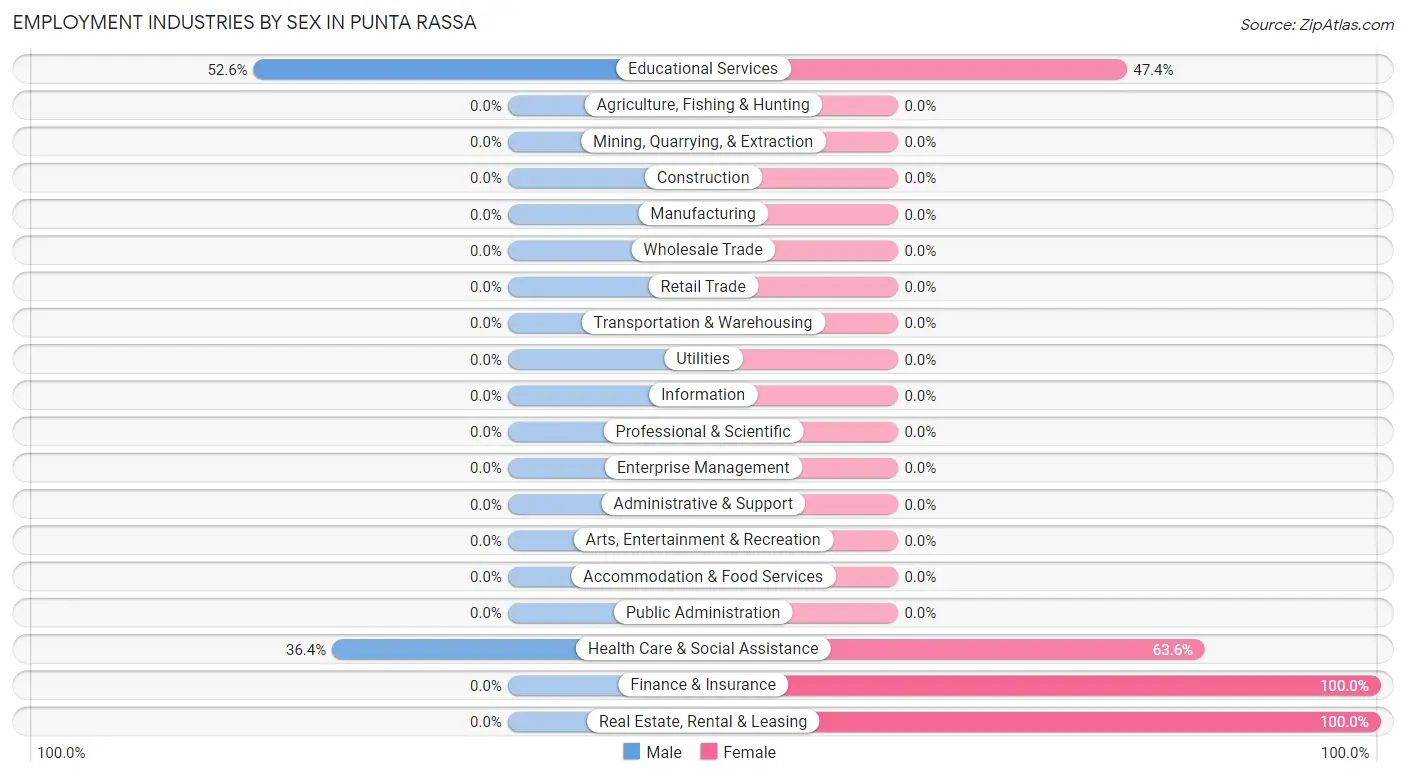
Employment Industries by Sex in Punta Rassa
The Punta Rassa industries that see more men than women are Educational Services (52.6%), and Health Care & Social Assistance (36.4%), whereas the industries that tend to have a higher number of women are Finance & Insurance (100.0%), Real Estate, Rental & Leasing (100.0%), and Health Care & Social Assistance (63.6%).
| Industry | Male | Female |
| Agriculture, Fishing & Hunting | 0 (0.0%) | 0 (0.0%) |
| Mining, Quarrying, & Extraction | 0 (0.0%) | 0 (0.0%) |
| Construction | 0 (0.0%) | 0 (0.0%) |
| Manufacturing | 0 (0.0%) | 0 (0.0%) |
| Wholesale Trade | 0 (0.0%) | 0 (0.0%) |
| Retail Trade | 0 (0.0%) | 0 (0.0%) |
| Transportation & Warehousing | 0 (0.0%) | 0 (0.0%) |
| Utilities | 0 (0.0%) | 0 (0.0%) |
| Information | 0 (0.0%) | 0 (0.0%) |
| Finance & Insurance | 0 (0.0%) | 8 (100.0%) |
| Real Estate, Rental & Leasing | 0 (0.0%) | 15 (100.0%) |
| Professional & Scientific | 0 (0.0%) | 0 (0.0%) |
| Enterprise Management | 0 (0.0%) | 0 (0.0%) |
| Administrative & Support | 0 (0.0%) | 0 (0.0%) |
| Educational Services | 10 (52.6%) | 9 (47.4%) |
| Health Care & Social Assistance | 8 (36.4%) | 14 (63.6%) |
| Arts, Entertainment & Recreation | 0 (0.0%) | 0 (0.0%) |
| Accommodation & Food Services | 0 (0.0%) | 0 (0.0%) |
| Public Administration | 0 (0.0%) | 0 (0.0%) |
| Total | 35 (39.3%) | 54 (60.7%) |
Education in Punta Rassa
School Enrollment in Punta Rassa
The most common levels of schooling among the 41 students in Punta Rassa are college / undergraduate (30 | 73.2%), and graduate / professional (11 | 26.8%).
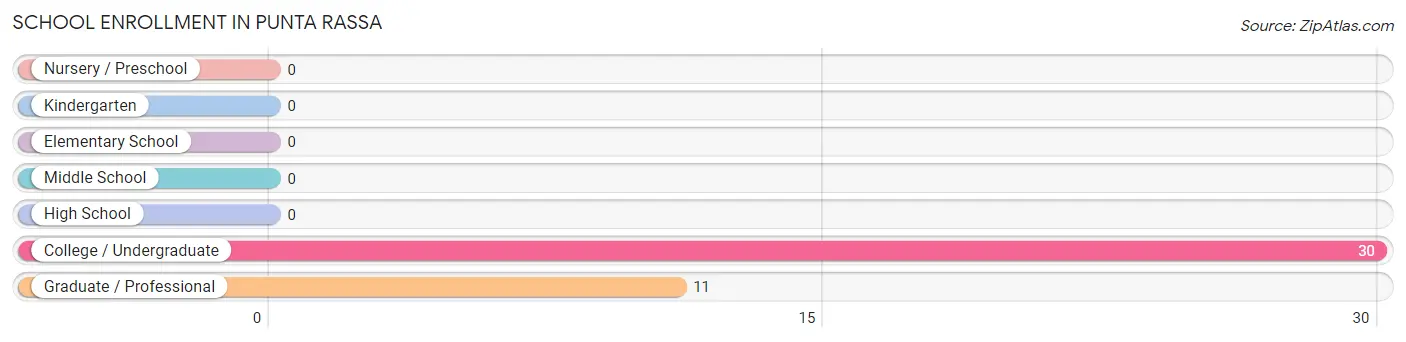
| School Level | # Students | % Students |
| Nursery / Preschool | 0 | 0.0% |
| Kindergarten | 0 | 0.0% |
| Elementary School | 0 | 0.0% |
| Middle School | 0 | 0.0% |
| High School | 0 | 0.0% |
| College / Undergraduate | 30 | 73.2% |
| Graduate / Professional | 11 | 26.8% |
| Total | 41 | 100.0% |
School Enrollment by Age by Funding Source in Punta Rassa
Out of a total of 41 students who are enrolled in schools in Punta Rassa, 31 (75.6%) attend a private institution, while the remaining 10 (24.4%) are enrolled in public schools. The age group of 35 years and over has the highest likelihood of being enrolled in private schools, with 31 (75.6% in the age bracket) enrolled. Conversely, the age group of 35 years and over has the lowest likelihood of being enrolled in a private school, with 10 (24.4% in the age bracket) attending a public institution.
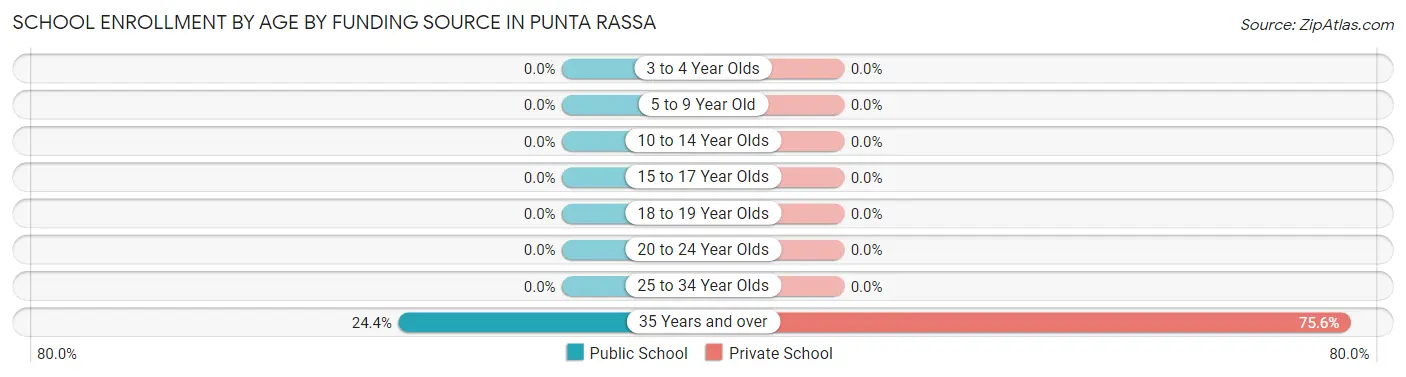
| Age Bracket | Public School | Private School |
| 3 to 4 Year Olds | 0 (0.0%) | 0 (0.0%) |
| 5 to 9 Year Old | 0 (0.0%) | 0 (0.0%) |
| 10 to 14 Year Olds | 0 (0.0%) | 0 (0.0%) |
| 15 to 17 Year Olds | 0 (0.0%) | 0 (0.0%) |
| 18 to 19 Year Olds | 0 (0.0%) | 0 (0.0%) |
| 20 to 24 Year Olds | 0 (0.0%) | 0 (0.0%) |
| 25 to 34 Year Olds | 0 (0.0%) | 0 (0.0%) |
| 35 Years and over | 10 (24.4%) | 31 (75.6%) |
| Total | 10 (24.4%) | 31 (75.6%) |
Educational Attainment by Field of Study in Punta Rassa
Liberal arts & history (136 | 15.4%), education (132 | 14.9%), science & technology (104 | 11.7%), business (89 | 10.1%), and engineering (81 | 9.1%) are the most common fields of study among 885 individuals in Punta Rassa who have obtained a bachelor's degree or higher.
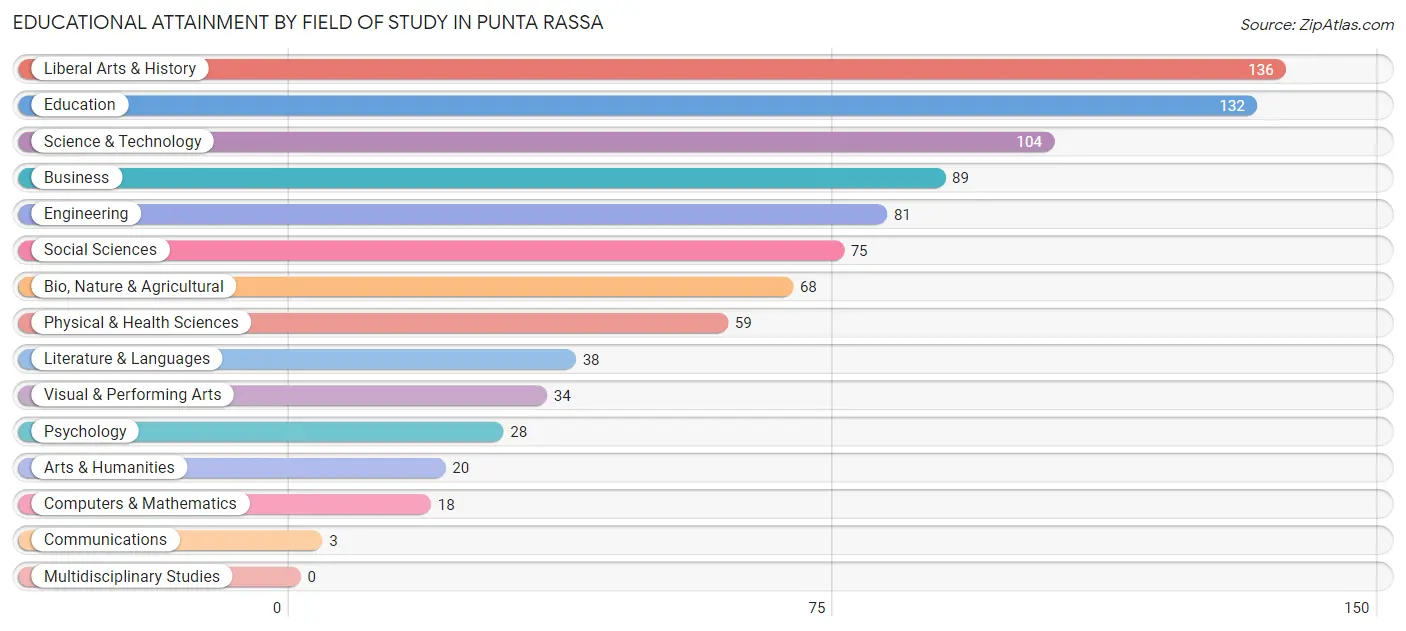
| Field of Study | # Graduates | % Graduates |
| Computers & Mathematics | 18 | 2.0% |
| Bio, Nature & Agricultural | 68 | 7.7% |
| Physical & Health Sciences | 59 | 6.7% |
| Psychology | 28 | 3.2% |
| Social Sciences | 75 | 8.5% |
| Engineering | 81 | 9.1% |
| Multidisciplinary Studies | 0 | 0.0% |
| Science & Technology | 104 | 11.7% |
| Business | 89 | 10.1% |
| Education | 132 | 14.9% |
| Literature & Languages | 38 | 4.3% |
| Liberal Arts & History | 136 | 15.4% |
| Visual & Performing Arts | 34 | 3.8% |
| Communications | 3 | 0.3% |
| Arts & Humanities | 20 | 2.3% |
| Total | 885 | 100.0% |
Transportation & Commute in Punta Rassa
Vehicle Availability by Sex in Punta Rassa
The most prevalent vehicle ownership categories in Punta Rassa are males with 1 vehicle (27, accounting for 77.1%) and females with 1 vehicle (24, making up 50.0%).
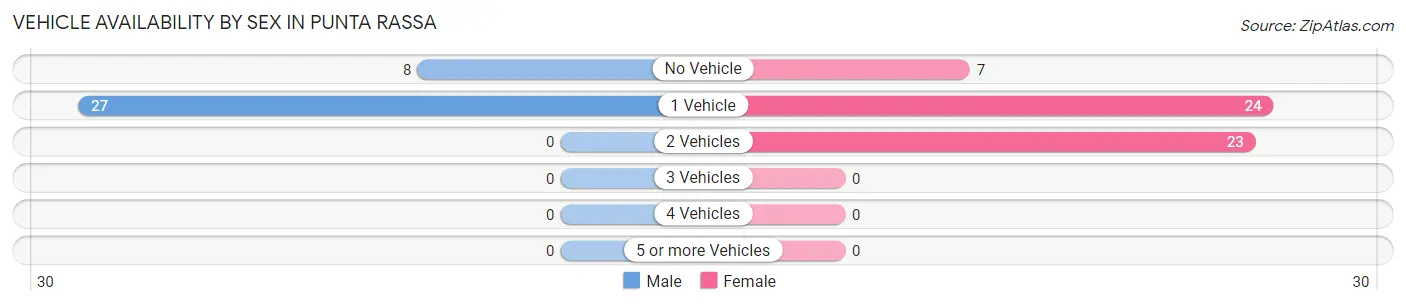
| Vehicles Available | Male | Female |
| No Vehicle | 8 (22.9%) | 7 (13.0%) |
| 1 Vehicle | 27 (77.1%) | 24 (44.4%) |
| 2 Vehicles | 0 (0.0%) | 23 (42.6%) |
| 3 Vehicles | 0 (0.0%) | 0 (0.0%) |
| 4 Vehicles | 0 (0.0%) | 0 (0.0%) |
| 5 or more Vehicles | 0 (0.0%) | 0 (0.0%) |
| Total | 35 (100.0%) | 54 (100.0%) |
Commute Time in Punta Rassa
The most frequently occuring commute durations in Punta Rassa are 15 to 19 minutes (15 commuters, 24.2%), 30 to 34 minutes (15 commuters, 24.2%), and 5 to 9 minutes (9 commuters, 14.5%).
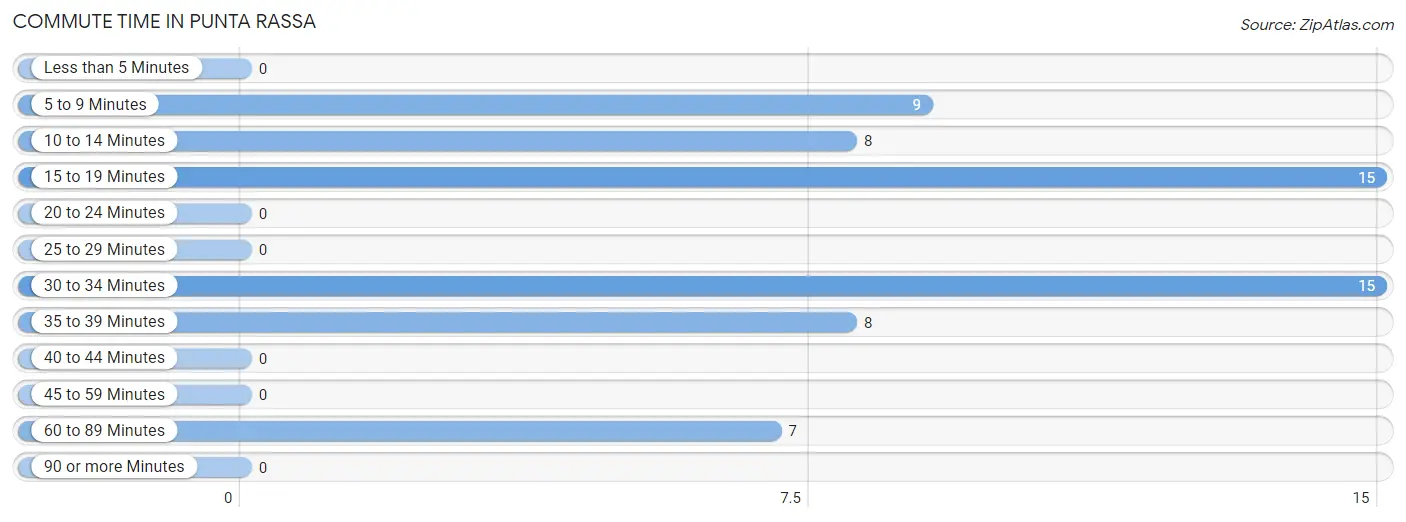
| Commute Time | # Commuters | % Commuters |
| Less than 5 Minutes | 0 | 0.0% |
| 5 to 9 Minutes | 9 | 14.5% |
| 10 to 14 Minutes | 8 | 12.9% |
| 15 to 19 Minutes | 15 | 24.2% |
| 20 to 24 Minutes | 0 | 0.0% |
| 25 to 29 Minutes | 0 | 0.0% |
| 30 to 34 Minutes | 15 | 24.2% |
| 35 to 39 Minutes | 8 | 12.9% |
| 40 to 44 Minutes | 0 | 0.0% |
| 45 to 59 Minutes | 0 | 0.0% |
| 60 to 89 Minutes | 7 | 11.3% |
| 90 or more Minutes | 0 | 0.0% |
Commute Time by Sex in Punta Rassa
The most common commute times in Punta Rassa are 5 to 9 minutes (9 commuters, 36.0%) for males and 15 to 19 minutes (15 commuters, 40.5%) for females.
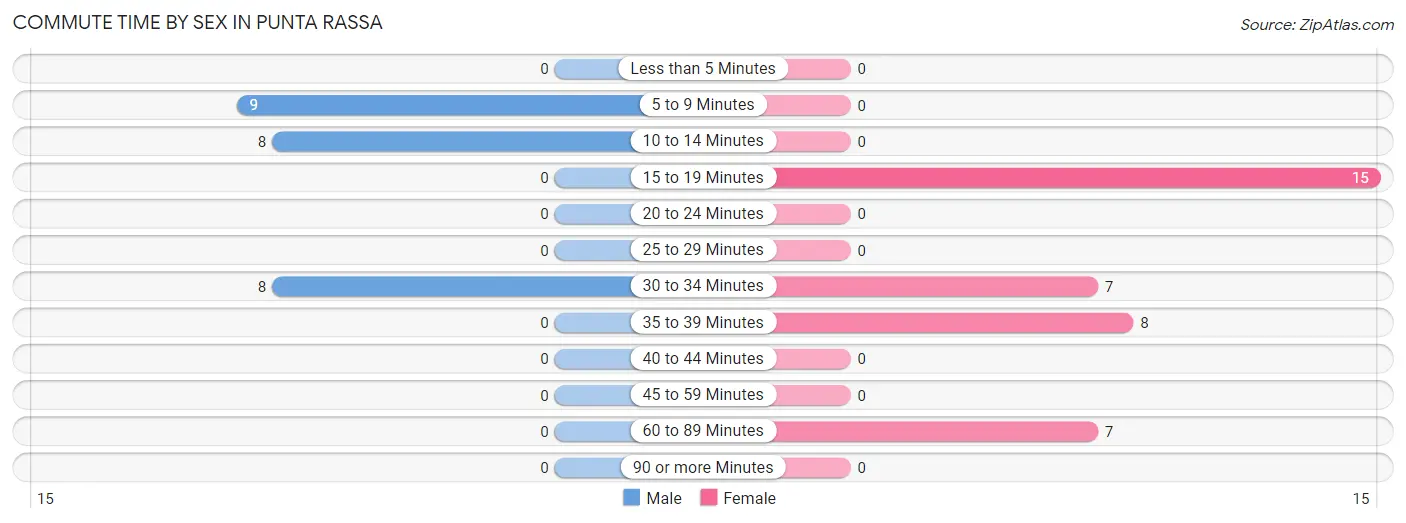
| Commute Time | Male | Female |
| Less than 5 Minutes | 0 (0.0%) | 0 (0.0%) |
| 5 to 9 Minutes | 9 (36.0%) | 0 (0.0%) |
| 10 to 14 Minutes | 8 (32.0%) | 0 (0.0%) |
| 15 to 19 Minutes | 0 (0.0%) | 15 (40.5%) |
| 20 to 24 Minutes | 0 (0.0%) | 0 (0.0%) |
| 25 to 29 Minutes | 0 (0.0%) | 0 (0.0%) |
| 30 to 34 Minutes | 8 (32.0%) | 7 (18.9%) |
| 35 to 39 Minutes | 0 (0.0%) | 8 (21.6%) |
| 40 to 44 Minutes | 0 (0.0%) | 0 (0.0%) |
| 45 to 59 Minutes | 0 (0.0%) | 0 (0.0%) |
| 60 to 89 Minutes | 0 (0.0%) | 7 (18.9%) |
| 90 or more Minutes | 0 (0.0%) | 0 (0.0%) |
Time of Departure to Work by Sex in Punta Rassa
The most frequent times of departure to work in Punta Rassa are 8:00 AM to 8:29 AM (17, 68.0%) for males and 7:00 AM to 7:29 AM (15, 40.5%) for females.
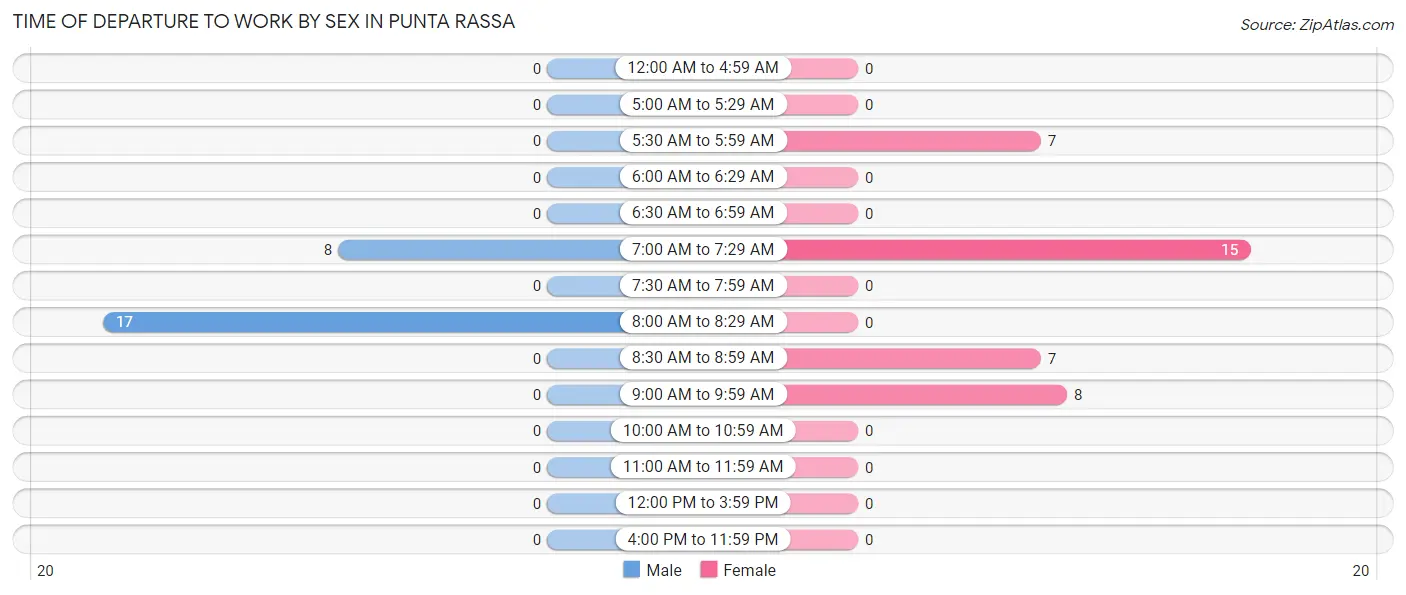
| Time of Departure | Male | Female |
| 12:00 AM to 4:59 AM | 0 (0.0%) | 0 (0.0%) |
| 5:00 AM to 5:29 AM | 0 (0.0%) | 0 (0.0%) |
| 5:30 AM to 5:59 AM | 0 (0.0%) | 7 (18.9%) |
| 6:00 AM to 6:29 AM | 0 (0.0%) | 0 (0.0%) |
| 6:30 AM to 6:59 AM | 0 (0.0%) | 0 (0.0%) |
| 7:00 AM to 7:29 AM | 8 (32.0%) | 15 (40.5%) |
| 7:30 AM to 7:59 AM | 0 (0.0%) | 0 (0.0%) |
| 8:00 AM to 8:29 AM | 17 (68.0%) | 0 (0.0%) |
| 8:30 AM to 8:59 AM | 0 (0.0%) | 7 (18.9%) |
| 9:00 AM to 9:59 AM | 0 (0.0%) | 8 (21.6%) |
| 10:00 AM to 10:59 AM | 0 (0.0%) | 0 (0.0%) |
| 11:00 AM to 11:59 AM | 0 (0.0%) | 0 (0.0%) |
| 12:00 PM to 3:59 PM | 0 (0.0%) | 0 (0.0%) |
| 4:00 PM to 11:59 PM | 0 (0.0%) | 0 (0.0%) |
| Total | 25 (100.0%) | 37 (100.0%) |
Housing Occupancy in Punta Rassa
Occupancy by Ownership in Punta Rassa
Of the total 834 dwellings in Punta Rassa, owner-occupied units account for 304 (36.4%), while renter-occupied units make up 530 (63.5%).
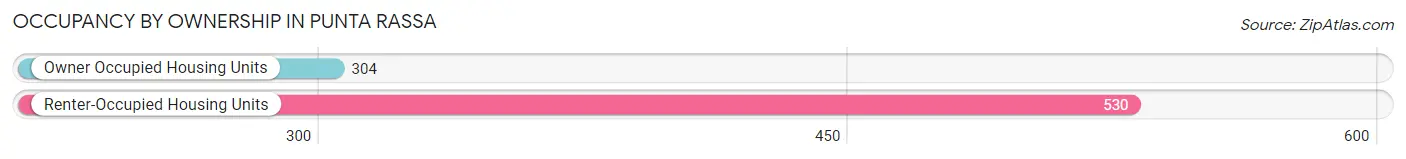
| Occupancy | # Housing Units | % Housing Units |
| Owner Occupied Housing Units | 304 | 36.4% |
| Renter-Occupied Housing Units | 530 | 63.5% |
| Total Occupied Housing Units | 834 | 100.0% |
Occupancy by Household Size in Punta Rassa
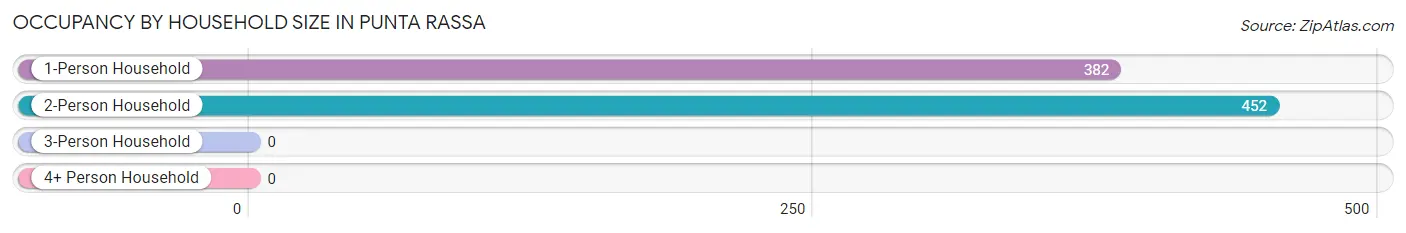
| Household Size | # Housing Units | % Housing Units |
| 1-Person Household | 382 | 45.8% |
| 2-Person Household | 452 | 54.2% |
| 3-Person Household | 0 | 0.0% |
| 4+ Person Household | 0 | 0.0% |
| Total Housing Units | 834 | 100.0% |
Occupancy by Ownership by Household Size in Punta Rassa
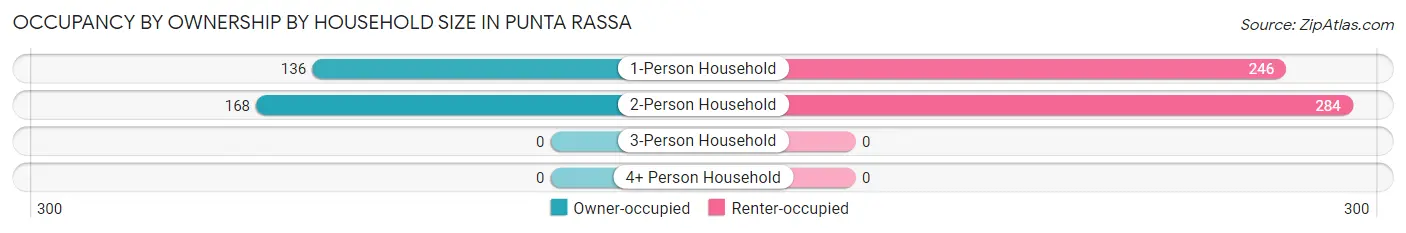
| Household Size | Owner-occupied | Renter-occupied |
| 1-Person Household | 136 (35.6%) | 246 (64.4%) |
| 2-Person Household | 168 (37.2%) | 284 (62.8%) |
| 3-Person Household | 0 (0.0%) | 0 (0.0%) |
| 4+ Person Household | 0 (0.0%) | 0 (0.0%) |
| Total Housing Units | 304 (36.4%) | 530 (63.5%) |
Occupancy by Educational Attainment in Punta Rassa
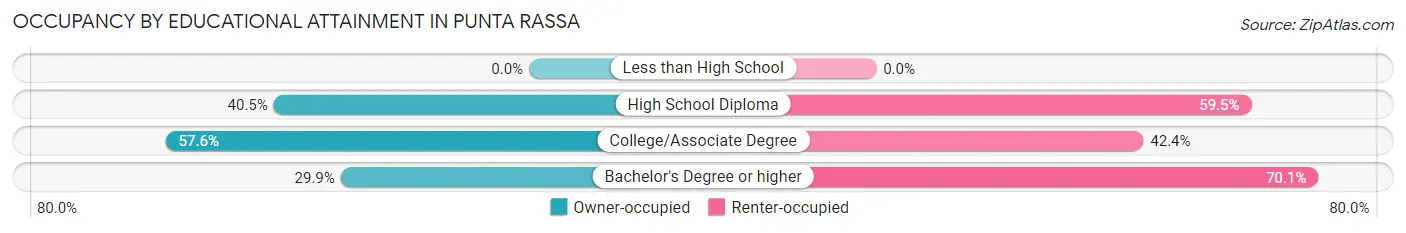
| Household Size | Owner-occupied | Renter-occupied |
| Less than High School | 0 (0.0%) | 0 (0.0%) |
| High School Diploma | 49 (40.5%) | 72 (59.5%) |
| College/Associate Degree | 87 (57.6%) | 64 (42.4%) |
| Bachelor's Degree or higher | 168 (29.9%) | 394 (70.1%) |
Occupancy by Age of Householder in Punta Rassa
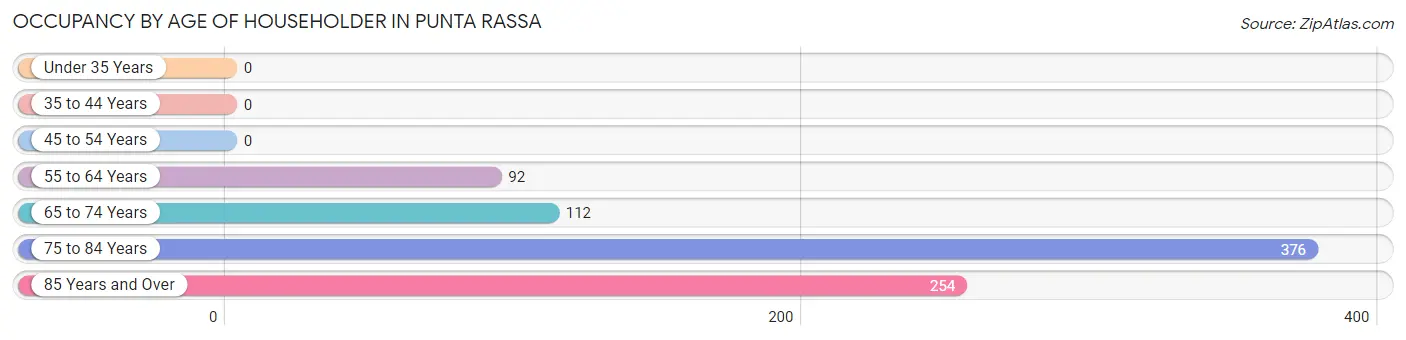
| Age Bracket | # Households | % Households |
| Under 35 Years | 0 | 0.0% |
| 35 to 44 Years | 0 | 0.0% |
| 45 to 54 Years | 0 | 0.0% |
| 55 to 64 Years | 92 | 11.0% |
| 65 to 74 Years | 112 | 13.4% |
| 75 to 84 Years | 376 | 45.1% |
| 85 Years and Over | 254 | 30.5% |
| Total | 834 | 100.0% |
Housing Finances in Punta Rassa
Median Income by Occupancy in Punta Rassa
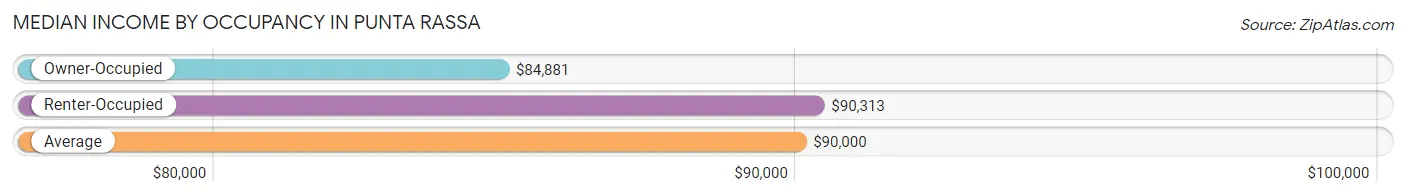
| Occupancy Type | # Households | Median Income |
| Owner-Occupied | 304 (36.4%) | $84,881 |
| Renter-Occupied | 530 (63.5%) | $90,313 |
| Average | 834 (100.0%) | $90,000 |
Occupancy by Householder Income Bracket in Punta Rassa
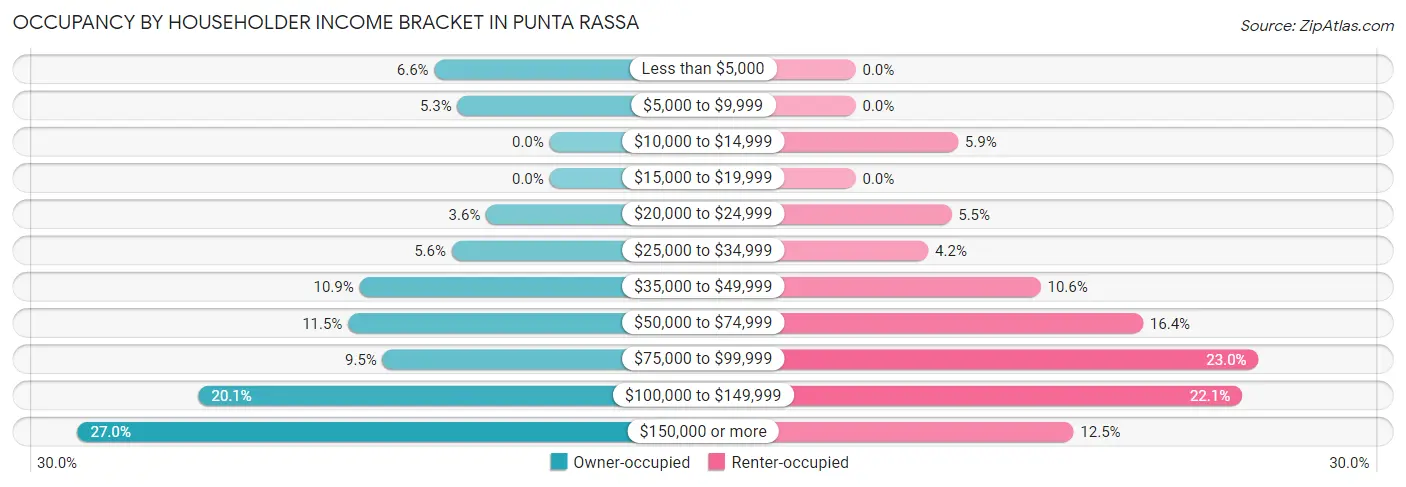
| Income Bracket | Owner-occupied | Renter-occupied |
| Less than $5,000 | 20 (6.6%) | 0 (0.0%) |
| $5,000 to $9,999 | 16 (5.3%) | 0 (0.0%) |
| $10,000 to $14,999 | 0 (0.0%) | 31 (5.9%) |
| $15,000 to $19,999 | 0 (0.0%) | 0 (0.0%) |
| $20,000 to $24,999 | 11 (3.6%) | 29 (5.5%) |
| $25,000 to $34,999 | 17 (5.6%) | 22 (4.2%) |
| $35,000 to $49,999 | 33 (10.9%) | 56 (10.6%) |
| $50,000 to $74,999 | 35 (11.5%) | 87 (16.4%) |
| $75,000 to $99,999 | 29 (9.5%) | 122 (23.0%) |
| $100,000 to $149,999 | 61 (20.1%) | 117 (22.1%) |
| $150,000 or more | 82 (27.0%) | 66 (12.4%) |
| Total | 304 (100.0%) | 530 (100.0%) |
Monthly Housing Cost Tiers in Punta Rassa
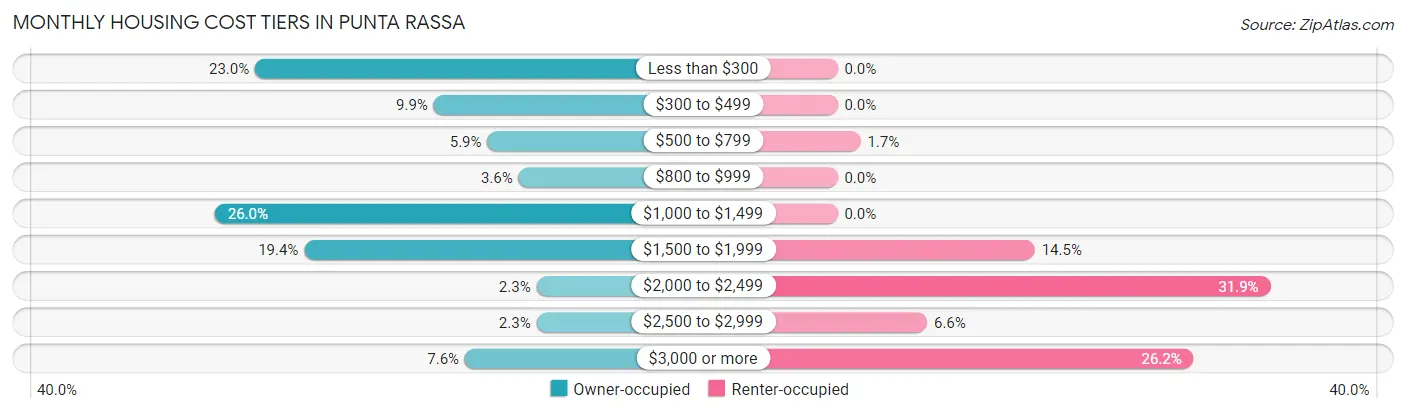
| Monthly Cost | Owner-occupied | Renter-occupied |
| Less than $300 | 70 (23.0%) | 0 (0.0%) |
| $300 to $499 | 30 (9.9%) | 0 (0.0%) |
| $500 to $799 | 18 (5.9%) | 9 (1.7%) |
| $800 to $999 | 11 (3.6%) | 0 (0.0%) |
| $1,000 to $1,499 | 79 (26.0%) | 0 (0.0%) |
| $1,500 to $1,999 | 59 (19.4%) | 77 (14.5%) |
| $2,000 to $2,499 | 7 (2.3%) | 169 (31.9%) |
| $2,500 to $2,999 | 7 (2.3%) | 35 (6.6%) |
| $3,000 or more | 23 (7.6%) | 139 (26.2%) |
| Total | 304 (100.0%) | 530 (100.0%) |
Physical Housing Characteristics in Punta Rassa
Housing Structures in Punta Rassa
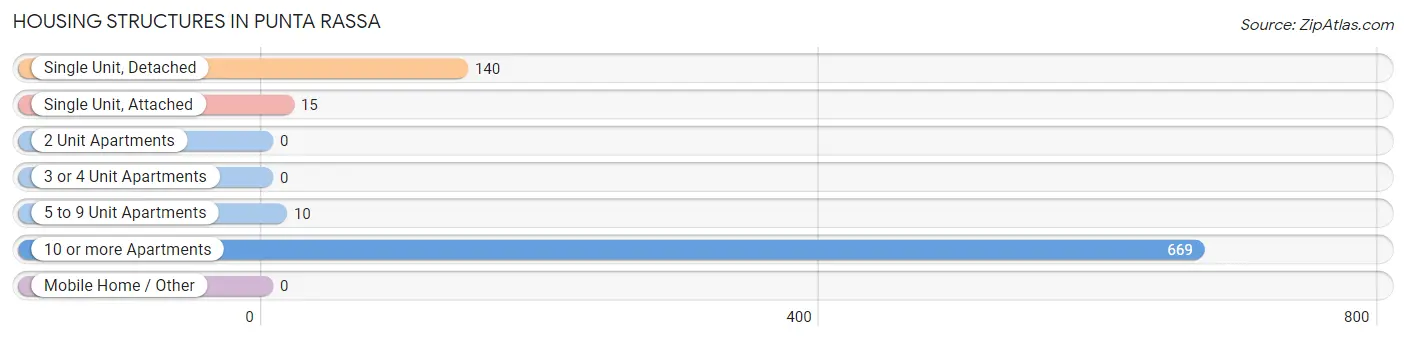
| Structure Type | # Housing Units | % Housing Units |
| Single Unit, Detached | 140 | 16.8% |
| Single Unit, Attached | 15 | 1.8% |
| 2 Unit Apartments | 0 | 0.0% |
| 3 or 4 Unit Apartments | 0 | 0.0% |
| 5 to 9 Unit Apartments | 10 | 1.2% |
| 10 or more Apartments | 669 | 80.2% |
| Mobile Home / Other | 0 | 0.0% |
| Total | 834 | 100.0% |
Housing Structures by Occupancy in Punta Rassa
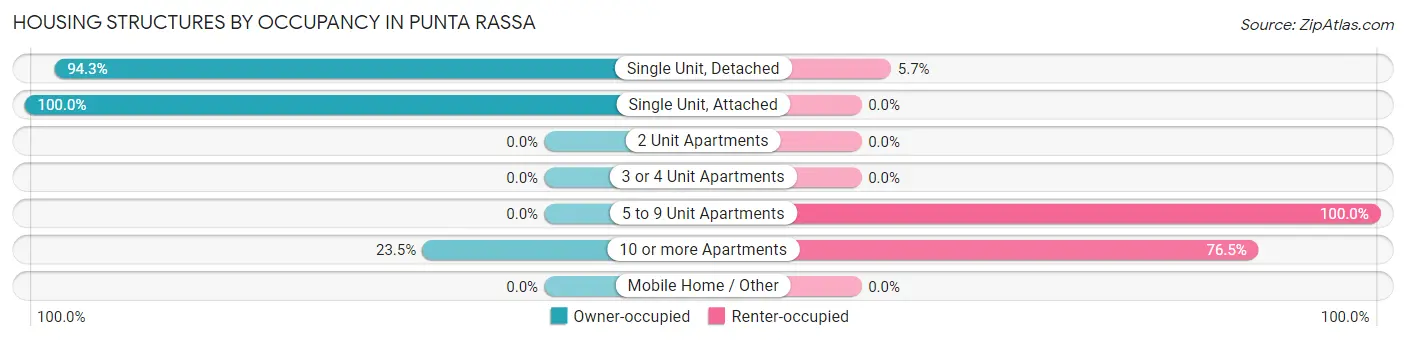
| Structure Type | Owner-occupied | Renter-occupied |
| Single Unit, Detached | 132 (94.3%) | 8 (5.7%) |
| Single Unit, Attached | 15 (100.0%) | 0 (0.0%) |
| 2 Unit Apartments | 0 (0.0%) | 0 (0.0%) |
| 3 or 4 Unit Apartments | 0 (0.0%) | 0 (0.0%) |
| 5 to 9 Unit Apartments | 0 (0.0%) | 10 (100.0%) |
| 10 or more Apartments | 157 (23.5%) | 512 (76.5%) |
| Mobile Home / Other | 0 (0.0%) | 0 (0.0%) |
| Total | 304 (36.4%) | 530 (63.5%) |
Housing Structures by Number of Rooms in Punta Rassa
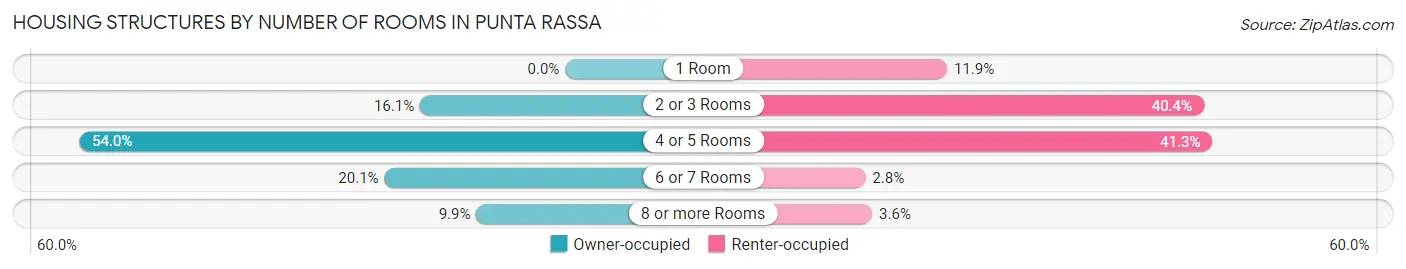
| Number of Rooms | Owner-occupied | Renter-occupied |
| 1 Room | 0 (0.0%) | 63 (11.9%) |
| 2 or 3 Rooms | 49 (16.1%) | 214 (40.4%) |
| 4 or 5 Rooms | 164 (53.9%) | 219 (41.3%) |
| 6 or 7 Rooms | 61 (20.1%) | 15 (2.8%) |
| 8 or more Rooms | 30 (9.9%) | 19 (3.6%) |
| Total | 304 (100.0%) | 530 (100.0%) |
Housing Structure by Heating Type in Punta Rassa
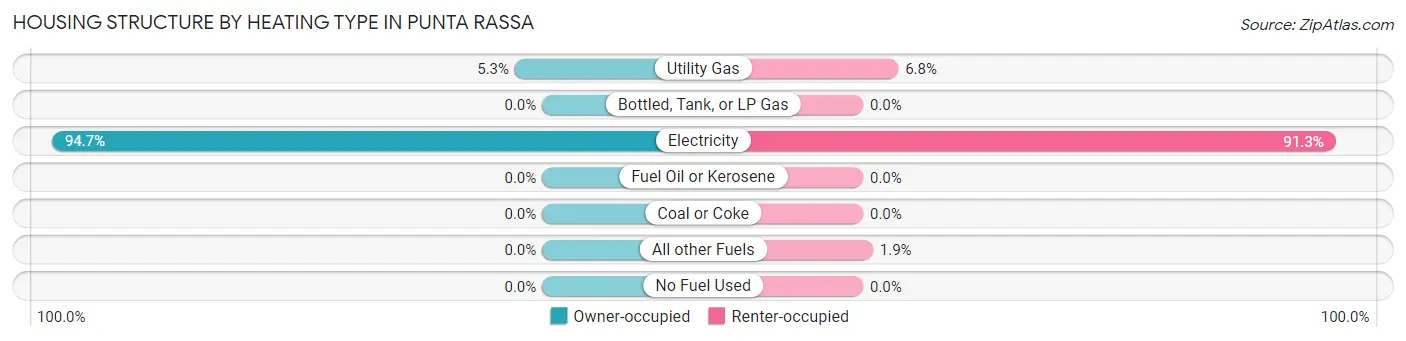
| Heating Type | Owner-occupied | Renter-occupied |
| Utility Gas | 16 (5.3%) | 36 (6.8%) |
| Bottled, Tank, or LP Gas | 0 (0.0%) | 0 (0.0%) |
| Electricity | 288 (94.7%) | 484 (91.3%) |
| Fuel Oil or Kerosene | 0 (0.0%) | 0 (0.0%) |
| Coal or Coke | 0 (0.0%) | 0 (0.0%) |
| All other Fuels | 0 (0.0%) | 10 (1.9%) |
| No Fuel Used | 0 (0.0%) | 0 (0.0%) |
| Total | 304 (100.0%) | 530 (100.0%) |
Household Vehicle Usage in Punta Rassa
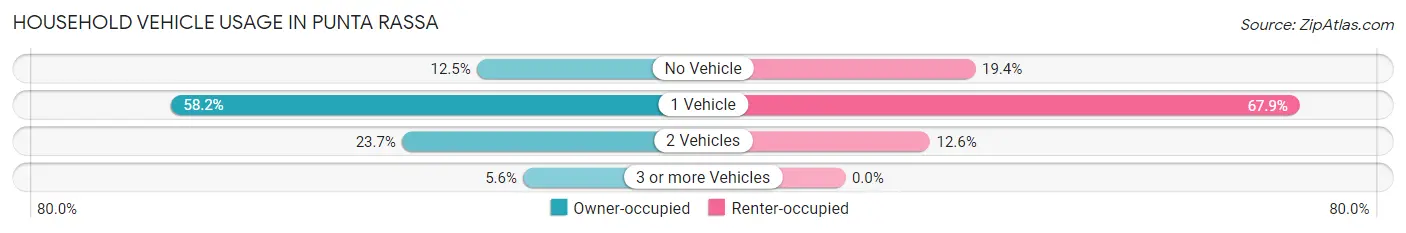
| Vehicles per Household | Owner-occupied | Renter-occupied |
| No Vehicle | 38 (12.5%) | 103 (19.4%) |
| 1 Vehicle | 177 (58.2%) | 360 (67.9%) |
| 2 Vehicles | 72 (23.7%) | 67 (12.6%) |
| 3 or more Vehicles | 17 (5.6%) | 0 (0.0%) |
| Total | 304 (100.0%) | 530 (100.0%) |
Real Estate & Mortgages in Punta Rassa
Real Estate and Mortgage Overview in Punta Rassa
| Characteristic | Without Mortgage | With Mortgage |
| Housing Units | 258 | 46 |
| Median Property Value | $537,500 | $814,500 |
| Median Household Income | $83,929 | $16 |
| Monthly Housing Costs | $1,000 | $23 |
| Real Estate Taxes | - | - |
Property Value by Mortgage Status in Punta Rassa
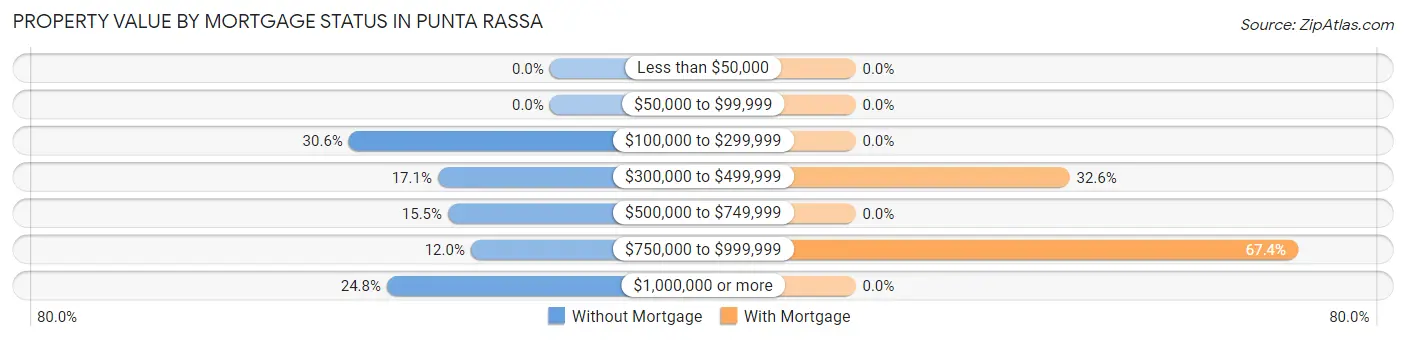
| Property Value | Without Mortgage | With Mortgage |
| Less than $50,000 | 0 (0.0%) | 0 (0.0%) |
| $50,000 to $99,999 | 0 (0.0%) | 0 (0.0%) |
| $100,000 to $299,999 | 79 (30.6%) | 0 (0.0%) |
| $300,000 to $499,999 | 44 (17.1%) | 15 (32.6%) |
| $500,000 to $749,999 | 40 (15.5%) | 0 (0.0%) |
| $750,000 to $999,999 | 31 (12.0%) | 31 (67.4%) |
| $1,000,000 or more | 64 (24.8%) | 0 (0.0%) |
| Total | 258 (100.0%) | 46 (100.0%) |
Household Income by Mortgage Status in Punta Rassa
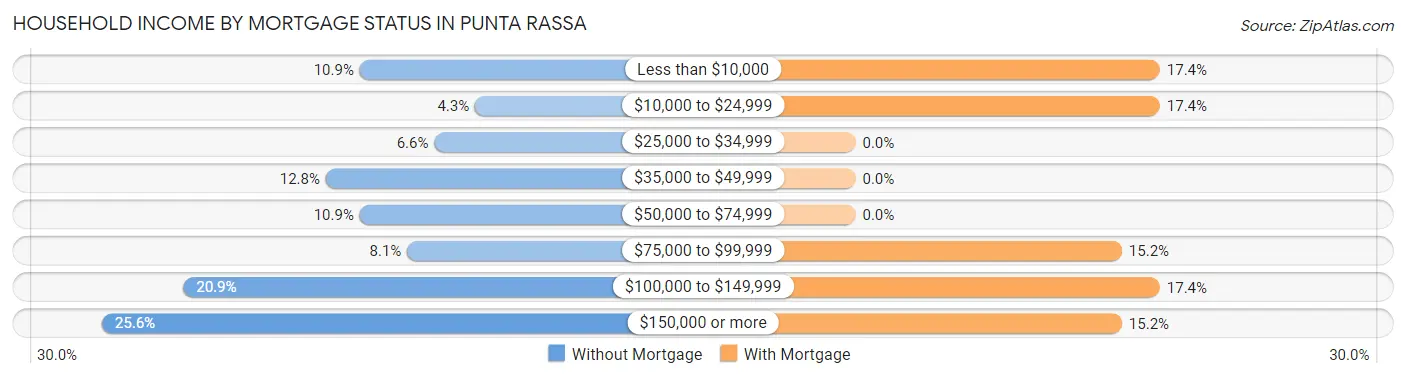
| Household Income | Without Mortgage | With Mortgage |
| Less than $10,000 | 28 (10.8%) | 8 (17.4%) |
| $10,000 to $24,999 | 11 (4.3%) | 8 (17.4%) |
| $25,000 to $34,999 | 17 (6.6%) | 0 (0.0%) |
| $35,000 to $49,999 | 33 (12.8%) | 0 (0.0%) |
| $50,000 to $74,999 | 28 (10.8%) | 0 (0.0%) |
| $75,000 to $99,999 | 21 (8.1%) | 7 (15.2%) |
| $100,000 to $149,999 | 54 (20.9%) | 8 (17.4%) |
| $150,000 or more | 66 (25.6%) | 7 (15.2%) |
| Total | 258 (100.0%) | 46 (100.0%) |
Property Value to Household Income Ratio in Punta Rassa
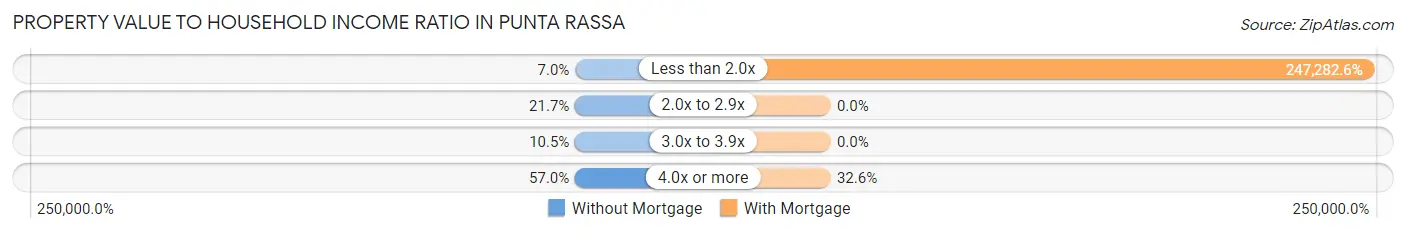
| Value-to-Income Ratio | Without Mortgage | With Mortgage |
| Less than 2.0x | 18 (7.0%) | 113,750 (247,282.6%) |
| 2.0x to 2.9x | 56 (21.7%) | 0 (0.0%) |
| 3.0x to 3.9x | 27 (10.5%) | 0 (0.0%) |
| 4.0x or more | 147 (57.0%) | 15 (32.6%) |
| Total | 258 (100.0%) | 46 (100.0%) |
Real Estate Taxes by Mortgage Status in Punta Rassa
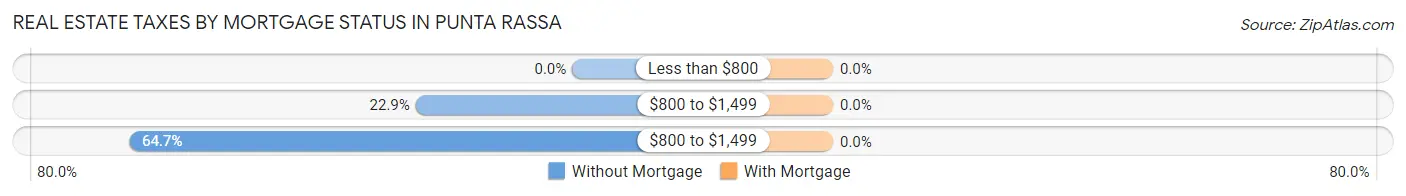
| Property Taxes | Without Mortgage | With Mortgage |
| Less than $800 | 0 (0.0%) | 0 (0.0%) |
| $800 to $1,499 | 59 (22.9%) | 0 (0.0%) |
| $800 to $1,499 | 167 (64.7%) | 0 (0.0%) |
| Total | 258 (100.0%) | 46 (100.0%) |
Health & Disability in Punta Rassa
Health Insurance Coverage by Age in Punta Rassa
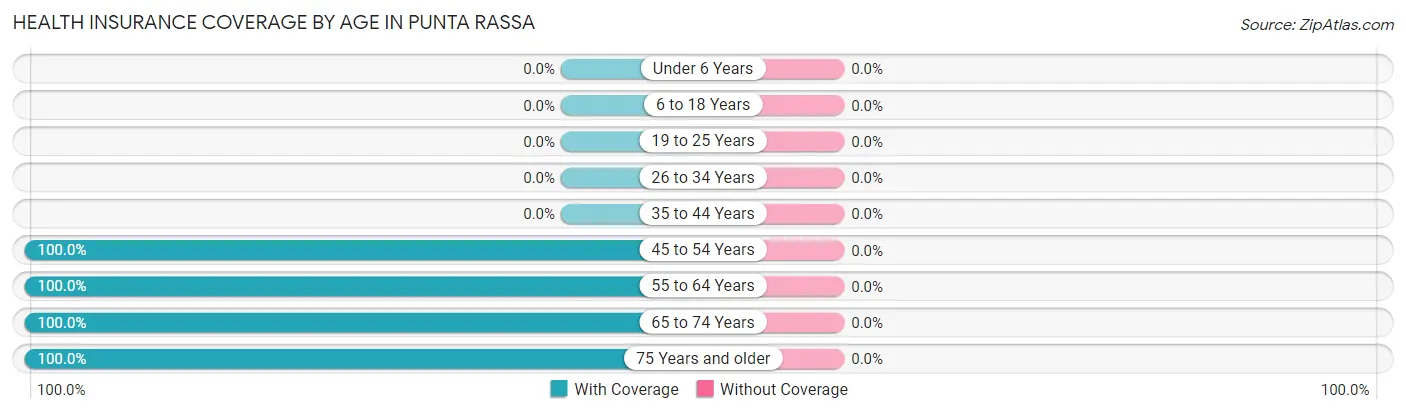
| Age Bracket | With Coverage | Without Coverage |
| Under 6 Years | 0 (0.0%) | 0 (0.0%) |
| 6 to 18 Years | 0 (0.0%) | 0 (0.0%) |
| 19 to 25 Years | 0 (0.0%) | 0 (0.0%) |
| 26 to 34 Years | 0 (0.0%) | 0 (0.0%) |
| 35 to 44 Years | 0 (0.0%) | 0 (0.0%) |
| 45 to 54 Years | 7 (100.0%) | 0 (0.0%) |
| 55 to 64 Years | 125 (100.0%) | 0 (0.0%) |
| 65 to 74 Years | 283 (100.0%) | 0 (0.0%) |
| 75 Years and older | 885 (100.0%) | 0 (0.0%) |
| Total | 1,300 (100.0%) | 0 (0.0%) |
Health Insurance Coverage by Citizenship Status in Punta Rassa
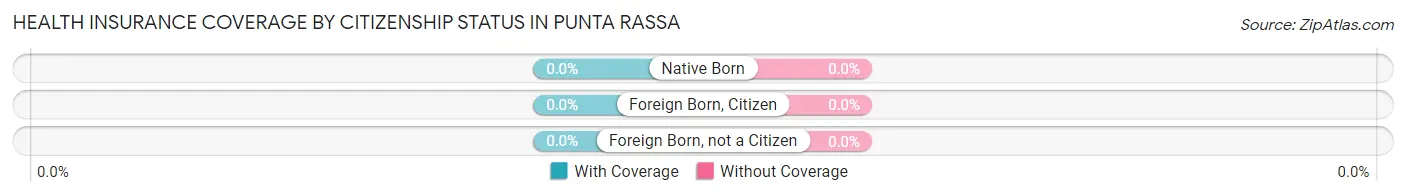
| Citizenship Status | With Coverage | Without Coverage |
| Native Born | 0 (0.0%) | 0 (0.0%) |
| Foreign Born, Citizen | 0 (0.0%) | 0 (0.0%) |
| Foreign Born, not a Citizen | 0 (0.0%) | 0 (0.0%) |
Health Insurance Coverage by Household Income in Punta Rassa
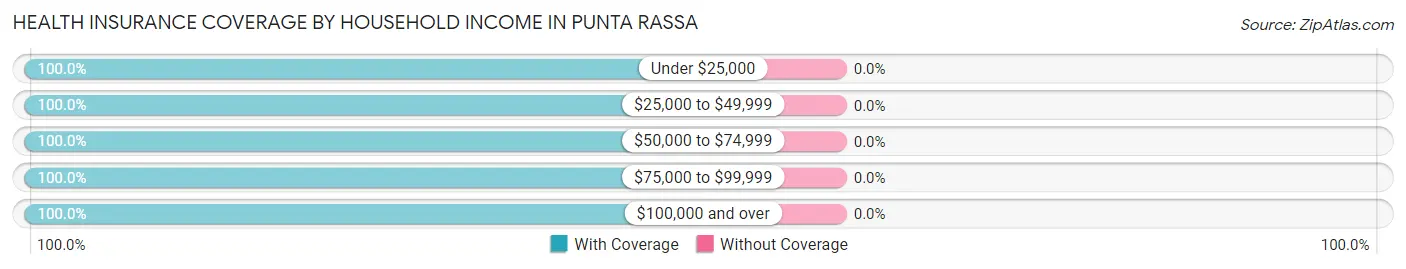
| Household Income | With Coverage | Without Coverage |
| Under $25,000 | 125 (100.0%) | 0 (0.0%) |
| $25,000 to $49,999 | 156 (100.0%) | 0 (0.0%) |
| $50,000 to $74,999 | 172 (100.0%) | 0 (0.0%) |
| $75,000 to $99,999 | 276 (100.0%) | 0 (0.0%) |
| $100,000 and over | 571 (100.0%) | 0 (0.0%) |
Public vs Private Health Insurance Coverage by Age in Punta Rassa
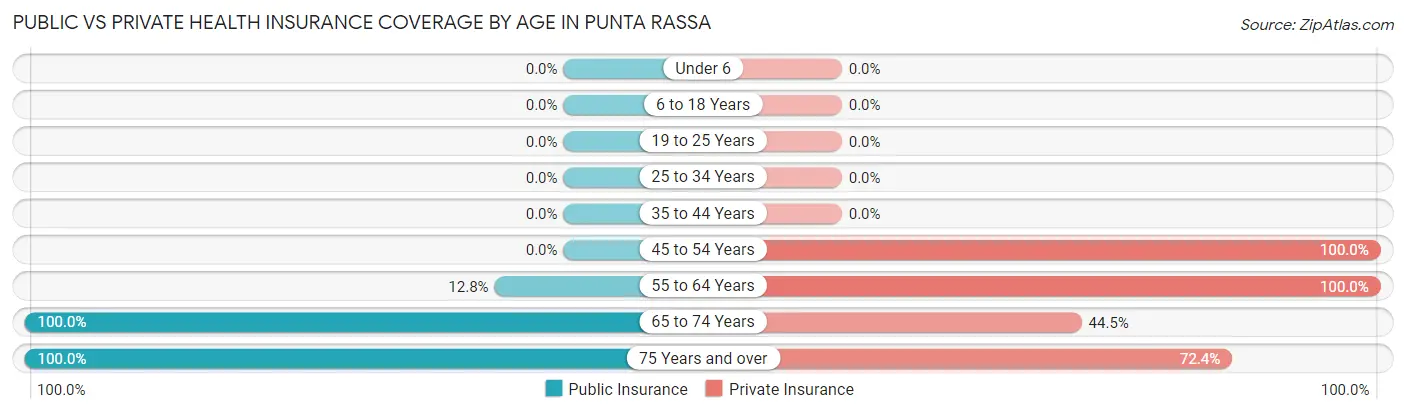
| Age Bracket | Public Insurance | Private Insurance |
| Under 6 | 0 (0.0%) | 0 (0.0%) |
| 6 to 18 Years | 0 (0.0%) | 0 (0.0%) |
| 19 to 25 Years | 0 (0.0%) | 0 (0.0%) |
| 25 to 34 Years | 0 (0.0%) | 0 (0.0%) |
| 35 to 44 Years | 0 (0.0%) | 0 (0.0%) |
| 45 to 54 Years | 0 (0.0%) | 7 (100.0%) |
| 55 to 64 Years | 16 (12.8%) | 125 (100.0%) |
| 65 to 74 Years | 283 (100.0%) | 126 (44.5%) |
| 75 Years and over | 885 (100.0%) | 641 (72.4%) |
| Total | 1,184 (91.1%) | 899 (69.2%) |
Disability Status by Sex by Age in Punta Rassa
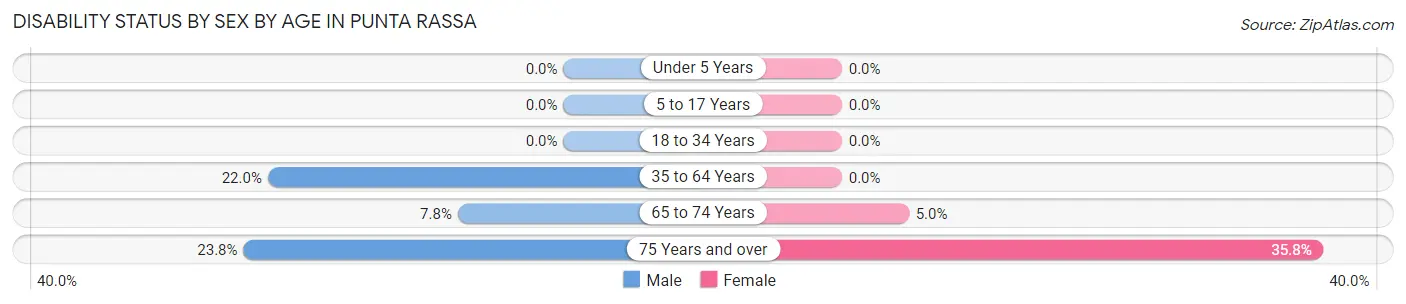
| Age Bracket | Male | Female |
| Under 5 Years | 0 (0.0%) | 0 (0.0%) |
| 5 to 17 Years | 0 (0.0%) | 0 (0.0%) |
| 18 to 34 Years | 0 (0.0%) | 0 (0.0%) |
| 35 to 64 Years | 9 (22.0%) | 0 (0.0%) |
| 65 to 74 Years | 8 (7.8%) | 9 (5.0%) |
| 75 Years and over | 96 (23.8%) | 172 (35.8%) |
Disability Class by Sex by Age in Punta Rassa
Disability Class: Hearing Difficulty
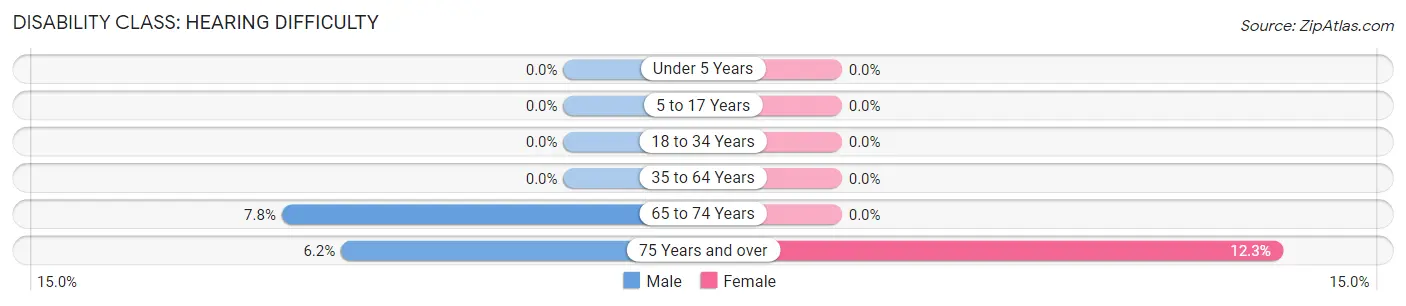
| Age Bracket | Male | Female |
| Under 5 Years | 0 (0.0%) | 0 (0.0%) |
| 5 to 17 Years | 0 (0.0%) | 0 (0.0%) |
| 18 to 34 Years | 0 (0.0%) | 0 (0.0%) |
| 35 to 64 Years | 0 (0.0%) | 0 (0.0%) |
| 65 to 74 Years | 8 (7.8%) | 0 (0.0%) |
| 75 Years and over | 25 (6.2%) | 59 (12.3%) |
Disability Class: Vision Difficulty
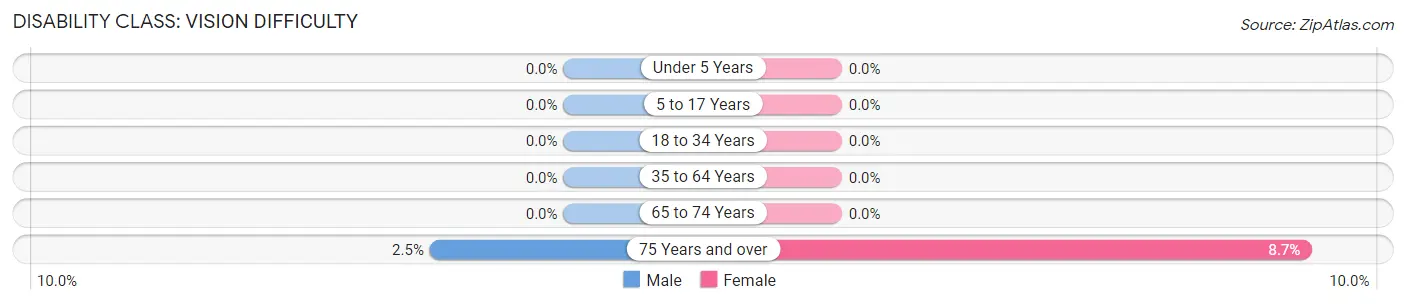
| Age Bracket | Male | Female |
| Under 5 Years | 0 (0.0%) | 0 (0.0%) |
| 5 to 17 Years | 0 (0.0%) | 0 (0.0%) |
| 18 to 34 Years | 0 (0.0%) | 0 (0.0%) |
| 35 to 64 Years | 0 (0.0%) | 0 (0.0%) |
| 65 to 74 Years | 0 (0.0%) | 0 (0.0%) |
| 75 Years and over | 10 (2.5%) | 42 (8.7%) |
Disability Class: Cognitive Difficulty
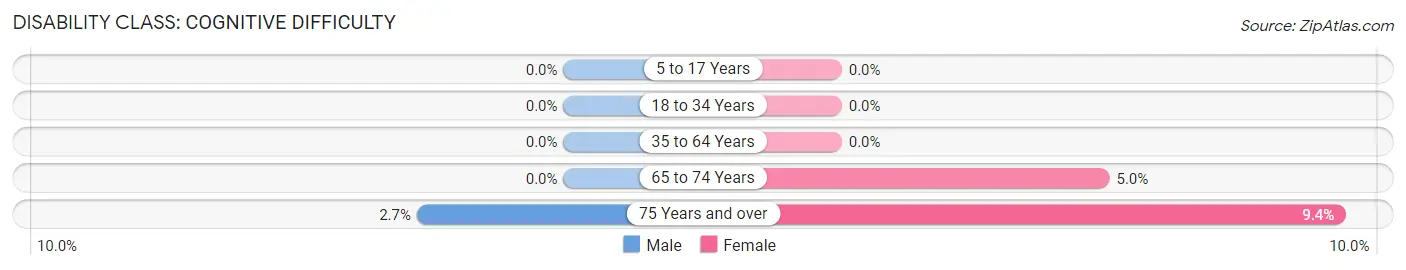
| Age Bracket | Male | Female |
| 5 to 17 Years | 0 (0.0%) | 0 (0.0%) |
| 18 to 34 Years | 0 (0.0%) | 0 (0.0%) |
| 35 to 64 Years | 0 (0.0%) | 0 (0.0%) |
| 65 to 74 Years | 0 (0.0%) | 9 (5.0%) |
| 75 Years and over | 11 (2.7%) | 45 (9.4%) |
Disability Class: Ambulatory Difficulty
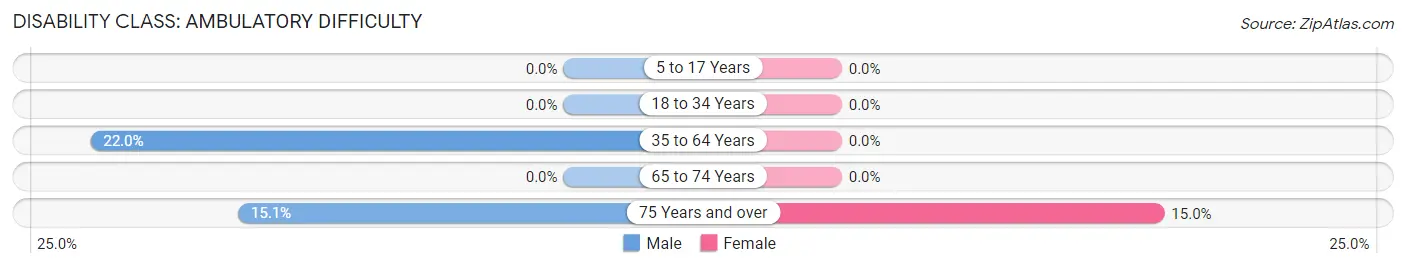
| Age Bracket | Male | Female |
| 5 to 17 Years | 0 (0.0%) | 0 (0.0%) |
| 18 to 34 Years | 0 (0.0%) | 0 (0.0%) |
| 35 to 64 Years | 9 (22.0%) | 0 (0.0%) |
| 65 to 74 Years | 0 (0.0%) | 0 (0.0%) |
| 75 Years and over | 61 (15.1%) | 72 (15.0%) |
Disability Class: Self-Care Difficulty
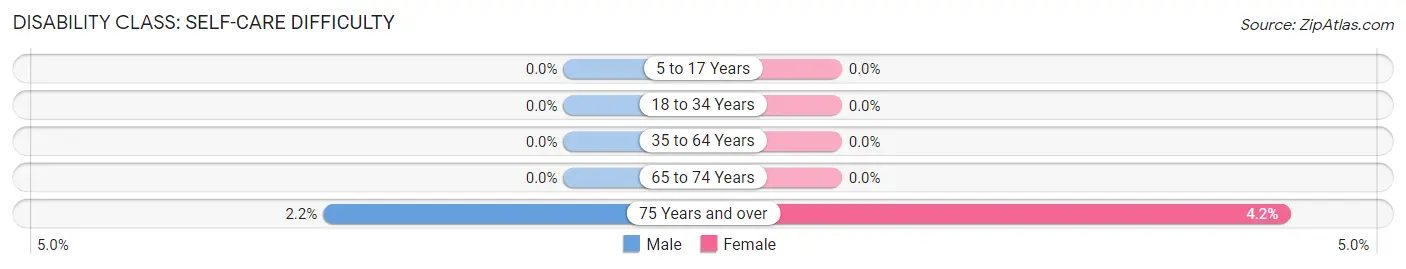
| Age Bracket | Male | Female |
| 5 to 17 Years | 0 (0.0%) | 0 (0.0%) |
| 18 to 34 Years | 0 (0.0%) | 0 (0.0%) |
| 35 to 64 Years | 0 (0.0%) | 0 (0.0%) |
| 65 to 74 Years | 0 (0.0%) | 0 (0.0%) |
| 75 Years and over | 9 (2.2%) | 20 (4.2%) |
Technology Access in Punta Rassa
Computing Device Access in Punta Rassa
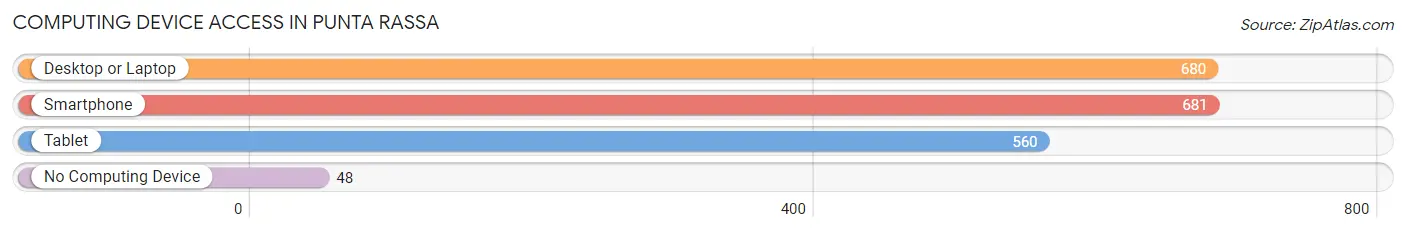
| Device Type | # Households | % Households |
| Desktop or Laptop | 680 | 81.5% |
| Smartphone | 681 | 81.7% |
| Tablet | 560 | 67.1% |
| No Computing Device | 48 | 5.8% |
| Total | 834 | 100.0% |
Internet Access in Punta Rassa
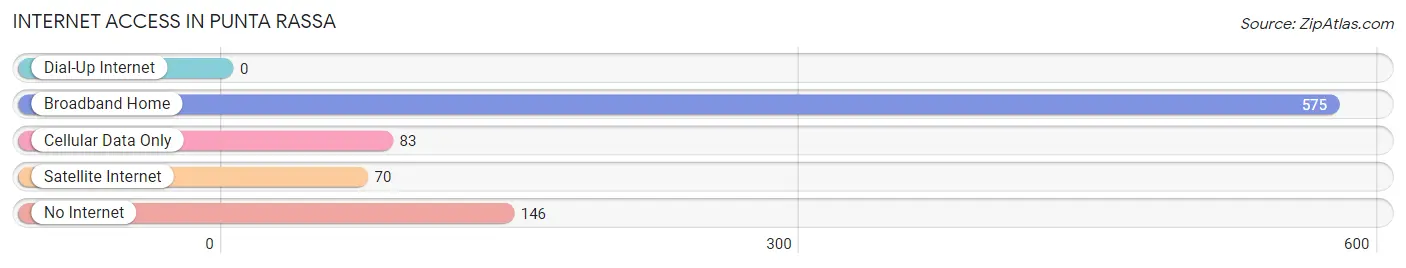
| Internet Type | # Households | % Households |
| Dial-Up Internet | 0 | 0.0% |
| Broadband Home | 575 | 68.9% |
| Cellular Data Only | 83 | 10.0% |
| Satellite Internet | 70 | 8.4% |
| No Internet | 146 | 17.5% |
| Total | 834 | 100.0% |
Punta Rassa Summary
Punta Rassa is a small unincorporated community located in Lee County, Florida, United States. It is situated on the western shore of the Caloosahatchee River, just south of Fort Myers. The area is known for its fishing and boating activities, and is home to a variety of wildlife.
History
Punta Rassa has a long and varied history. The area was first inhabited by the Calusa Indians, who lived in the area for centuries before the arrival of Europeans. The Calusa were a powerful tribe that controlled much of the area, and their influence can still be seen in the area today.
In 1513, Spanish explorer Ponce de Leon arrived in the area and named it Punta Rassa, which translates to “point of the sand” in Spanish. The area was used as a trading post for the Spanish, and it was also used as a base for their exploration of the area.
In the late 1800s, the area was settled by fishermen and farmers. The area was also used as a base for the Union Navy during the Civil War.
In the early 1900s, the area was developed as a resort community. The area was popular with wealthy northerners who wanted to escape the cold winters of the north. The area was also popular with fishermen, and the area was known for its excellent fishing.
In the 1950s, the area was developed as a residential community. The area was popular with retirees, and the area was known for its peaceful atmosphere.
Geography
Punta Rassa is located on the western shore of the Caloosahatchee River, just south of Fort Myers. The area is known for its beautiful beaches and its excellent fishing. The area is also home to a variety of wildlife, including manatees, dolphins, and a variety of birds.
The area is also home to a variety of plants and trees, including palm trees, mangroves, and sea grapes. The area is also home to a variety of wildlife, including alligators, snakes, and a variety of birds.
Economy
The economy of Punta Rassa is largely based on tourism and fishing. The area is known for its excellent fishing, and the area is home to a variety of charter fishing companies. The area is also home to a variety of restaurants and bars, as well as a variety of shops and stores.
The area is also home to a variety of businesses, including boat repair shops, marinas, and boat rental companies. The area is also home to a variety of real estate companies, as well as a variety of other businesses.
Demographics
As of the 2010 census, the population of Punta Rassa was 1,845. The population is largely made up of retirees, as well as a variety of other people who are drawn to the area for its peaceful atmosphere and excellent fishing. The area is also home to a variety of immigrants, including people from Mexico, Cuba, and other Latin American countries.
The area is also home to a variety of religious organizations, including churches, synagogues, and mosques. The area is also home to a variety of cultural organizations, including the Calusa Indian Cultural Center and the Punta Rassa Historical Society.
Conclusion
Punta Rassa is a small unincorporated community located in Lee County, Florida, United States. It is situated on the western shore of the Caloosahatchee River, just south of Fort Myers. The area is known for its fishing and boating activities, and is home to a variety of wildlife. The area is also home to a variety of businesses, including boat repair shops, marinas, and boat rental companies. The population of Punta Rassa is largely made up of retirees, as well as a variety of other people who are drawn to the area for its peaceful atmosphere and excellent fishing. The area is also home to a variety of religious organizations, including churches, synagogues, and mosques. The area is also home to a variety of cultural organizations, including the Calusa Indian Cultural Center and the Punta Rassa Historical Society.
Common Questions
What is Per Capita Income in Punta Rassa?
Per Capita income in Punta Rassa is $78,793.
What is the Median Family Income in Punta Rassa?
Median Family Income in Punta Rassa is $105,000.
What is the Median Household income in Punta Rassa?
Median Household Income in Punta Rassa is $90,000.
What is Inequality or Gini Index in Punta Rassa?
Inequality or Gini Index in Punta Rassa is 0.51.
What is the Total Population of Punta Rassa?
Total Population of Punta Rassa is 1,370.
What is the Total Male Population of Punta Rassa?
Total Male Population of Punta Rassa is 580.
What is the Total Female Population of Punta Rassa?
Total Female Population of Punta Rassa is 790.
What is the Ratio of Males per 100 Females in Punta Rassa?
There are 73.42 Males per 100 Females in Punta Rassa.
What is the Ratio of Females per 100 Males in Punta Rassa?
There are 136.21 Females per 100 Males in Punta Rassa.
What is the Median Population Age in Punta Rassa?
Median Population Age in Punta Rassa is 81.1 Years.
What is the Average Family Size in Punta Rassa
Average Family Size in Punta Rassa is 2.0 People.
What is the Average Household Size in Punta Rassa
Average Household Size in Punta Rassa is 1.6 People.
How Large is the Labor Force in Punta Rassa?
There are 89 People in the Labor Forcein in Punta Rassa.
What is the Percentage of People in the Labor Force in Punta Rassa?
6.5% of People are in the Labor Force in Punta Rassa.