Pine Level, FL Map & Demographics
Pine Level Map
Pine Level Overview
$21,826
PER CAPITA INCOME
$62,857
AVG FAMILY INCOME
0.34
INEQUALITY / GINI INDEX
151
TOTAL POPULATION
72
MALE POPULATION
79
FEMALE POPULATION
91.14
MALES / 100 FEMALES
109.72
FEMALES / 100 MALES
49.5
MEDIAN AGE
2.5
AVG FAMILY SIZE
2.2
AVG HOUSEHOLD SIZE
58
LABOR FORCE [ PEOPLE ]
44.6%
PERCENT IN LABOR FORCE
Income in Pine Level
Income Overview in Pine Level
| Characteristic | Number | Measure |
| Per Capita Income | 151 | $21,826 |
| Median Family Income | 58 | $62,857 |
| Mean Family Income | 58 | $58,967 |
| Median Household Income | 67 | $0 |
| Mean Household Income | 67 | $52,754 |
| Income Deficit | 58 | $0 |
| Wage / Income Gap (%) | 151 | 0.00% |
| Wage / Income Gap ($) | 151 | 100.00¢ per $1 |
| Gini / Inequality Index | 151 | 0.34 |
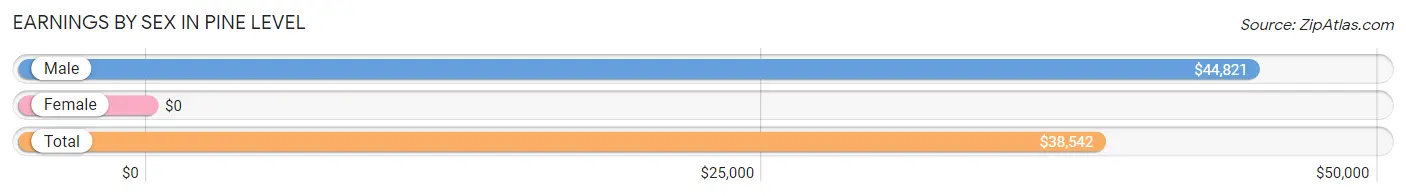
Earnings by Sex in Pine Level
| Sex | Number | Average Earnings |
| Male | 31 (53.4%) | $44,821 |
| Female | 27 (46.6%) | $0 |
| Total | 58 (100.0%) | $38,542 |
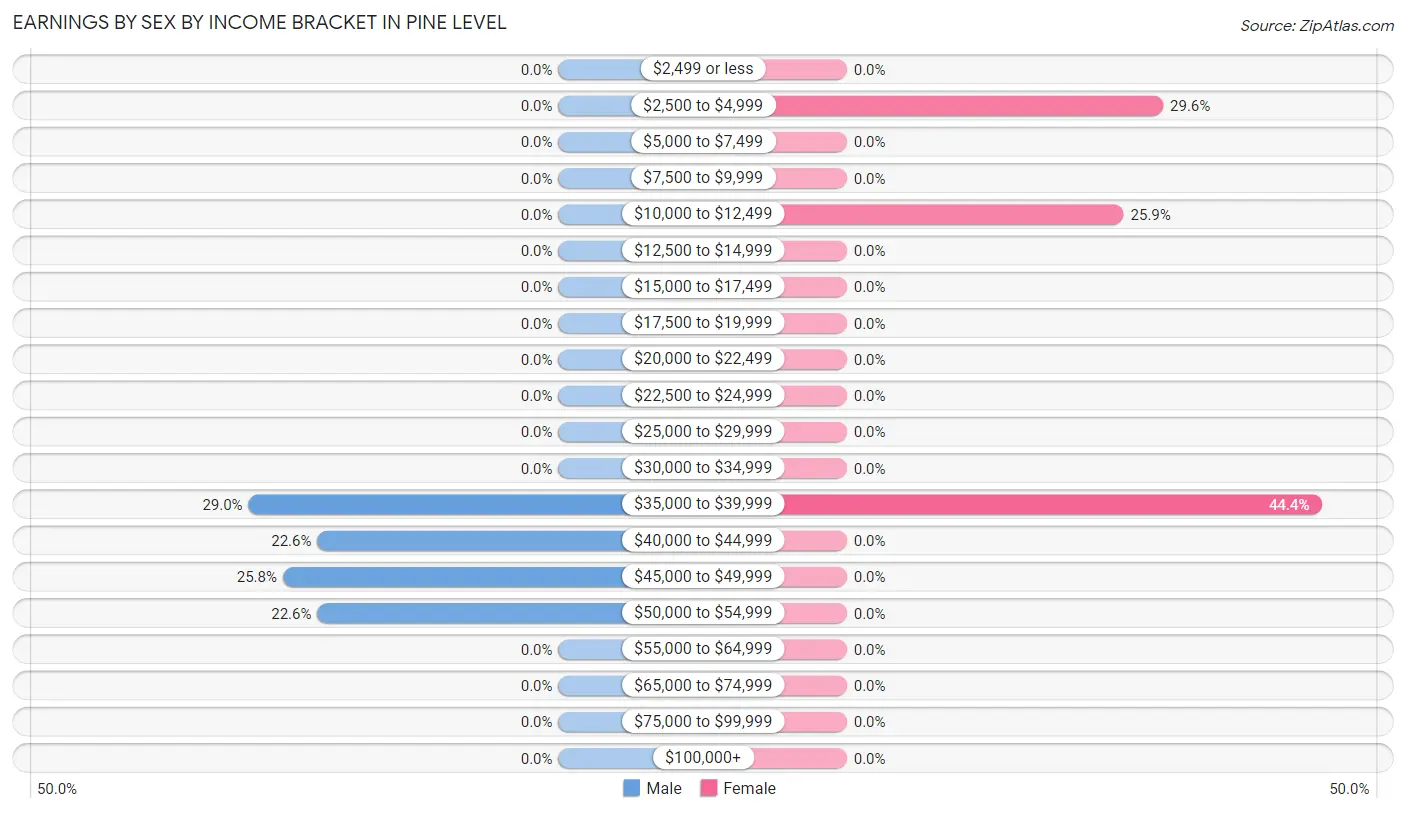
Earnings by Sex by Income Bracket in Pine Level
The most common earnings brackets in Pine Level are $35,000 to $39,999 for men (9 | 29.0%) and $35,000 to $39,999 for women (12 | 44.4%).
| Income | Male | Female |
| $2,499 or less | 0 (0.0%) | 0 (0.0%) |
| $2,500 to $4,999 | 0 (0.0%) | 8 (29.6%) |
| $5,000 to $7,499 | 0 (0.0%) | 0 (0.0%) |
| $7,500 to $9,999 | 0 (0.0%) | 0 (0.0%) |
| $10,000 to $12,499 | 0 (0.0%) | 7 (25.9%) |
| $12,500 to $14,999 | 0 (0.0%) | 0 (0.0%) |
| $15,000 to $17,499 | 0 (0.0%) | 0 (0.0%) |
| $17,500 to $19,999 | 0 (0.0%) | 0 (0.0%) |
| $20,000 to $22,499 | 0 (0.0%) | 0 (0.0%) |
| $22,500 to $24,999 | 0 (0.0%) | 0 (0.0%) |
| $25,000 to $29,999 | 0 (0.0%) | 0 (0.0%) |
| $30,000 to $34,999 | 0 (0.0%) | 0 (0.0%) |
| $35,000 to $39,999 | 9 (29.0%) | 12 (44.4%) |
| $40,000 to $44,999 | 7 (22.6%) | 0 (0.0%) |
| $45,000 to $49,999 | 8 (25.8%) | 0 (0.0%) |
| $50,000 to $54,999 | 7 (22.6%) | 0 (0.0%) |
| $55,000 to $64,999 | 0 (0.0%) | 0 (0.0%) |
| $65,000 to $74,999 | 0 (0.0%) | 0 (0.0%) |
| $75,000 to $99,999 | 0 (0.0%) | 0 (0.0%) |
| $100,000+ | 0 (0.0%) | 0 (0.0%) |
| Total | 31 (100.0%) | 27 (100.0%) |
Earnings by Sex by Educational Attainment in Pine Level
| Educational Attainment | Male Income | Female Income |
| Less than High School | - | - |
| High School Diploma | - | - |
| College or Associate's Degree | - | - |
| Bachelor's Degree | - | - |
| Graduate Degree | - | - |
| Total | $44,821 | $0 |
Family Income in Pine Level
Family Income Brackets in Pine Level
According to the Pine Level family income data, there are 23 families falling into the $75,000 to $99,999 income range, which is the most common income bracket and makes up 39.7% of all families.
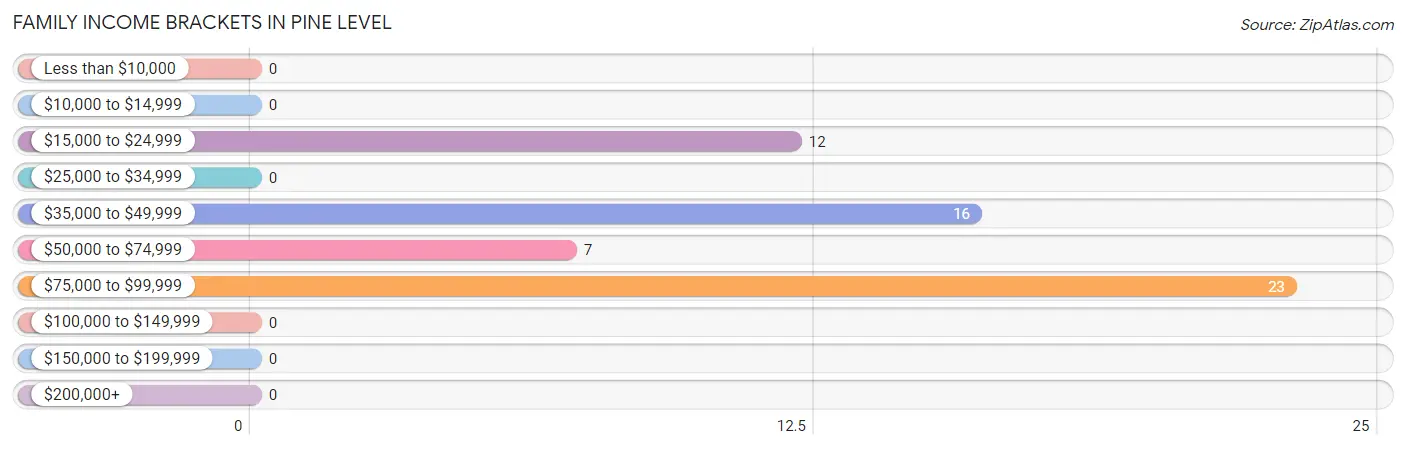
| Income Bracket | # Families | % Families |
| Less than $10,000 | 0 | 0.0% |
| $10,000 to $14,999 | 0 | 0.0% |
| $15,000 to $24,999 | 12 | 20.7% |
| $25,000 to $34,999 | 0 | 0.0% |
| $35,000 to $49,999 | 16 | 27.6% |
| $50,000 to $74,999 | 7 | 12.1% |
| $75,000 to $99,999 | 23 | 39.7% |
| $100,000 to $149,999 | 0 | 0.0% |
| $150,000 to $199,999 | 0 | 0.0% |
| $200,000+ | 0 | 0.0% |
Family Income by Famaliy Size in Pine Level
3-person families (23 | 39.7%) account for the highest median family income in Pine Level with $43,393 per family, while 3-person families (23 | 39.7%) have the highest median income of $14,464 per family member.
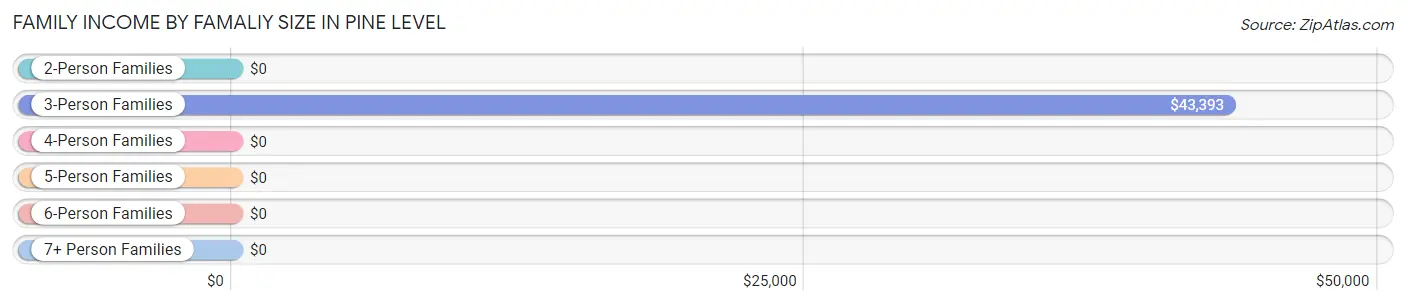
| Income Bracket | # Families | Median Income |
| 2-Person Families | 23 (39.7%) | $0 |
| 3-Person Families | 23 (39.7%) | $43,393 |
| 4-Person Families | 12 (20.7%) | $0 |
| 5-Person Families | 0 (0.0%) | $0 |
| 6-Person Families | 0 (0.0%) | $0 |
| 7+ Person Families | 0 (0.0%) | $0 |
| Total | 58 (100.0%) | $62,857 |
Family Income by Number of Earners in Pine Level
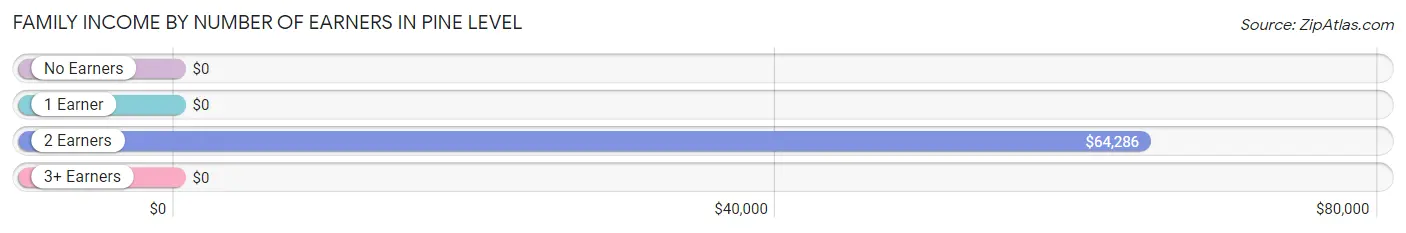
| Number of Earners | # Families | Median Income |
| No Earners | 23 (39.7%) | $0 |
| 1 Earner | 7 (12.1%) | $0 |
| 2 Earners | 28 (48.3%) | $64,286 |
| 3+ Earners | 0 (0.0%) | $0 |
| Total | 58 (100.0%) | $62,857 |
Household Income in Pine Level
Household Income Brackets in Pine Level
With 23 households falling in the category, the $75,000 to $99,999 income range is the most frequent in Pine Level, accounting for 34.3% of all households.
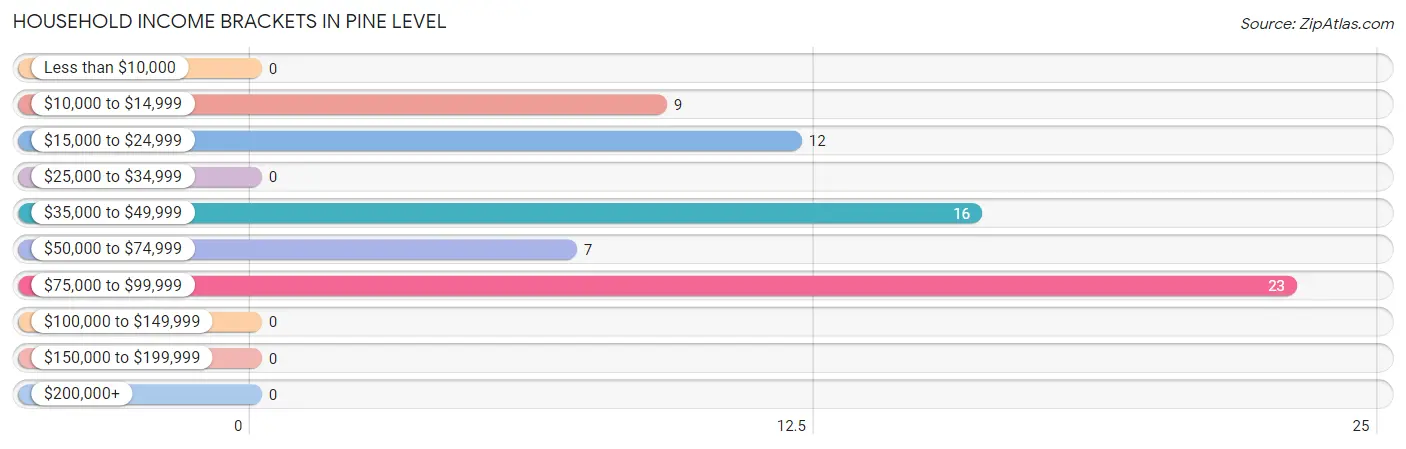
| Income Bracket | # Households | % Households |
| Less than $10,000 | 0 | 0.0% |
| $10,000 to $14,999 | 9 | 13.4% |
| $15,000 to $24,999 | 12 | 17.9% |
| $25,000 to $34,999 | 0 | 0.0% |
| $35,000 to $49,999 | 16 | 23.9% |
| $50,000 to $74,999 | 7 | 10.4% |
| $75,000 to $99,999 | 23 | 34.3% |
| $100,000 to $149,999 | 0 | 0.0% |
| $150,000 to $199,999 | 0 | 0.0% |
| $200,000+ | 0 | 0.0% |
Household Income by Householder Age in Pine Level
| Income Bracket | # Households | Median Income |
| 15 to 24 Years | 0 (0.0%) | $0 |
| 25 to 44 Years | 21 (31.3%) | $0 |
| 45 to 64 Years | 14 (20.9%) | $0 |
| 65+ Years | 32 (47.8%) | $0 |
| Total | 67 (100.0%) | $0 |
Poverty in Pine Level
Income Below Poverty by Sex and Age in Pine Level
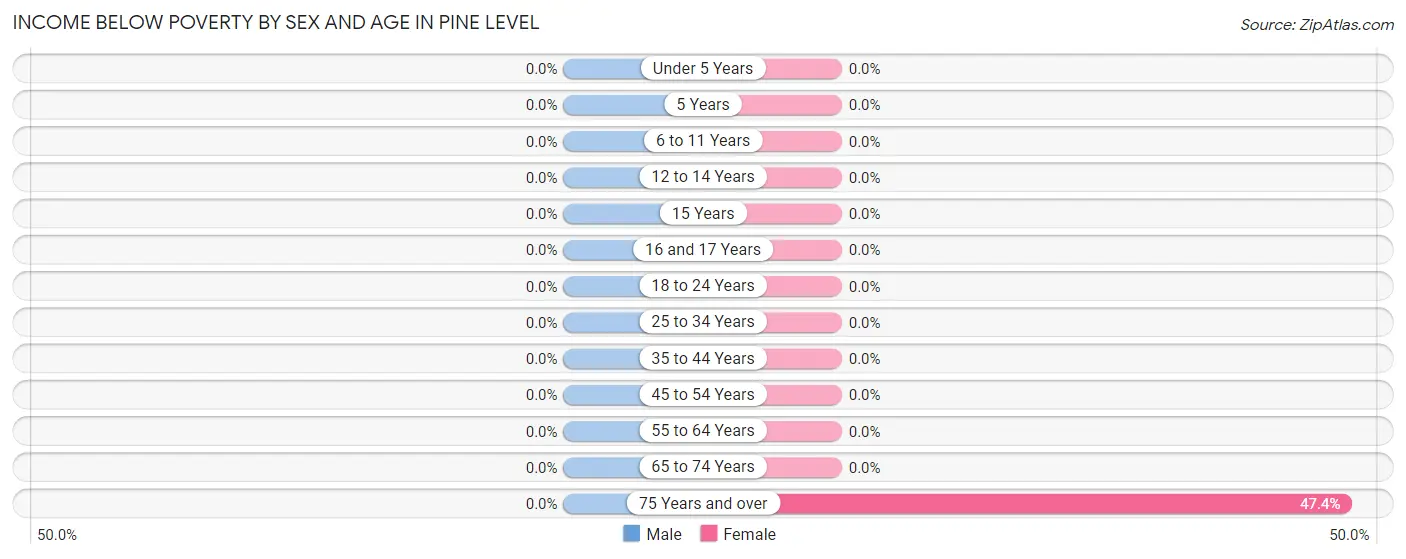
| Age Bracket | Male | Female |
| Under 5 Years | 0 (0.0%) | 0 (0.0%) |
| 5 Years | 0 (0.0%) | 0 (0.0%) |
| 6 to 11 Years | 0 (0.0%) | 0 (0.0%) |
| 12 to 14 Years | 0 (0.0%) | 0 (0.0%) |
| 15 Years | 0 (0.0%) | 0 (0.0%) |
| 16 and 17 Years | 0 (0.0%) | 0 (0.0%) |
| 18 to 24 Years | 0 (0.0%) | 0 (0.0%) |
| 25 to 34 Years | 0 (0.0%) | 0 (0.0%) |
| 35 to 44 Years | 0 (0.0%) | 0 (0.0%) |
| 45 to 54 Years | 0 (0.0%) | 0 (0.0%) |
| 55 to 64 Years | 0 (0.0%) | 0 (0.0%) |
| 65 to 74 Years | 0 (0.0%) | 0 (0.0%) |
| 75 Years and over | 0 (0.0%) | 9 (47.4%) |
| Total | 0 (0.0%) | 9 (11.4%) |
Income Above Poverty by Sex and Age in Pine Level
According to the poverty statistics in Pine Level, males aged under 5 years and females aged under 5 years are the age groups that are most secure financially, with 100.0% of males and 100.0% of females in these age groups living above the poverty line.
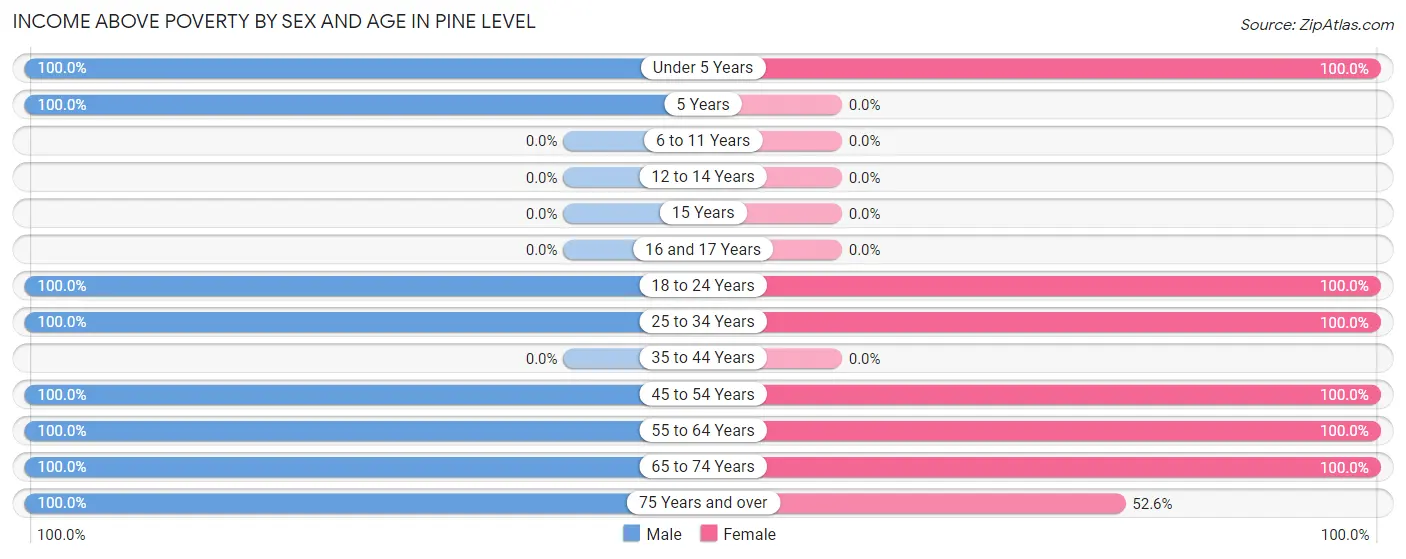
| Age Bracket | Male | Female |
| Under 5 Years | 5 (100.0%) | 8 (100.0%) |
| 5 Years | 8 (100.0%) | 0 (0.0%) |
| 6 to 11 Years | 0 (0.0%) | 0 (0.0%) |
| 12 to 14 Years | 0 (0.0%) | 0 (0.0%) |
| 15 Years | 0 (0.0%) | 0 (0.0%) |
| 16 and 17 Years | 0 (0.0%) | 0 (0.0%) |
| 18 to 24 Years | 6 (100.0%) | 8 (100.0%) |
| 25 to 34 Years | 17 (100.0%) | 20 (100.0%) |
| 35 to 44 Years | 0 (0.0%) | 0 (0.0%) |
| 45 to 54 Years | 7 (100.0%) | 7 (100.0%) |
| 55 to 64 Years | 7 (100.0%) | 5 (100.0%) |
| 65 to 74 Years | 11 (100.0%) | 12 (100.0%) |
| 75 Years and over | 11 (100.0%) | 10 (52.6%) |
| Total | 72 (100.0%) | 70 (88.6%) |
Income Below Poverty Among Married-Couple Families in Pine Level
| Children | Above Poverty | Below Poverty |
| No Children | 37 (100.0%) | 0 (0.0%) |
| 1 or 2 Children | 21 (100.0%) | 0 (0.0%) |
| 3 or 4 Children | 0 (0.0%) | 0 (0.0%) |
| 5 or more Children | 0 (0.0%) | 0 (0.0%) |
| Total | 58 (100.0%) | 0 (0.0%) |
Income Below Poverty Among Single-Parent Households in Pine Level
| Children | Single Father | Single Mother |
| No Children | 0 (0.0%) | 0 (0.0%) |
| 1 or 2 Children | 0 (0.0%) | 0 (0.0%) |
| 3 or 4 Children | 0 (0.0%) | 0 (0.0%) |
| 5 or more Children | 0 (0.0%) | 0 (0.0%) |
| Total | 0 (0.0%) | 0 (0.0%) |
Income Below Poverty Among Married-Couple vs Single-Parent Households in Pine Level
| Children | Married-Couple Families | Single-Parent Households |
| No Children | 0 (0.0%) | 0 (0.0%) |
| 1 or 2 Children | 0 (0.0%) | 0 (0.0%) |
| 3 or 4 Children | 0 (0.0%) | 0 (0.0%) |
| 5 or more Children | 0 (0.0%) | 0 (0.0%) |
| Total | 0 (0.0%) | 0 (0.0%) |
Race in Pine Level
The most populous races in Pine Level are White / Caucasian (126 | 83.4%), and Two or more Races (25 | 16.6%).
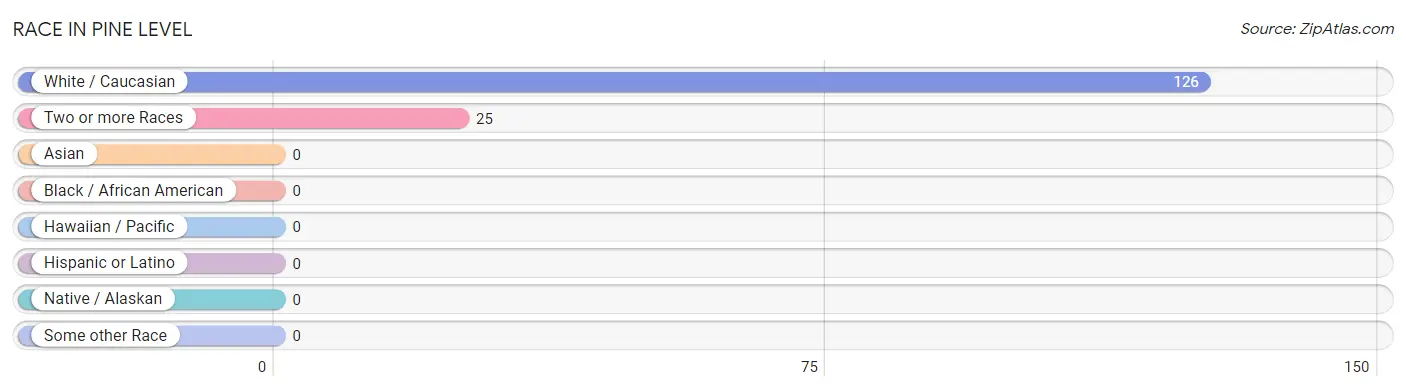
| Race | # Population | % Population |
| Asian | 0 | 0.0% |
| Black / African American | 0 | 0.0% |
| Hawaiian / Pacific | 0 | 0.0% |
| Hispanic or Latino | 0 | 0.0% |
| Native / Alaskan | 0 | 0.0% |
| White / Caucasian | 126 | 83.4% |
| Two or more Races | 25 | 16.6% |
| Some other Race | 0 | 0.0% |
| Total | 151 | 100.0% |
Ancestry in Pine Level
The most populous ancestries reported in Pine Level are American (29 | 19.2%), Irish (24 | 15.9%), French (23 | 15.2%), and English (21 | 13.9%), together accounting for 64.2% of all Pine Level residents.
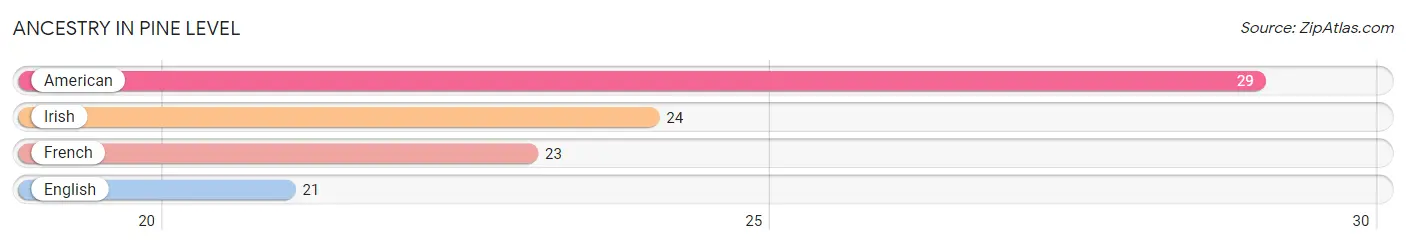
| Ancestry | # Population | % Population |
| American | 29 | 19.2% |
| English | 21 | 13.9% |
| French | 23 | 15.2% |
| Irish | 24 | 15.9% | View All 4 Rows |
Immigrants in Pine Level
The most numerous immigrant groups reported in Pine Level came from , and Canada (5 | 3.3%), together accounting for 3.3% of all Pine Level residents.

| Immigration Origin | # Population | % Population |
| Canada | 5 | 3.3% | View All 1 Rows |
Sex and Age in Pine Level
Sex and Age in Pine Level
The most populous age groups in Pine Level are 25 to 29 Years (17 | 23.6%) for men and 25 to 29 Years (12 | 15.2%) for women.
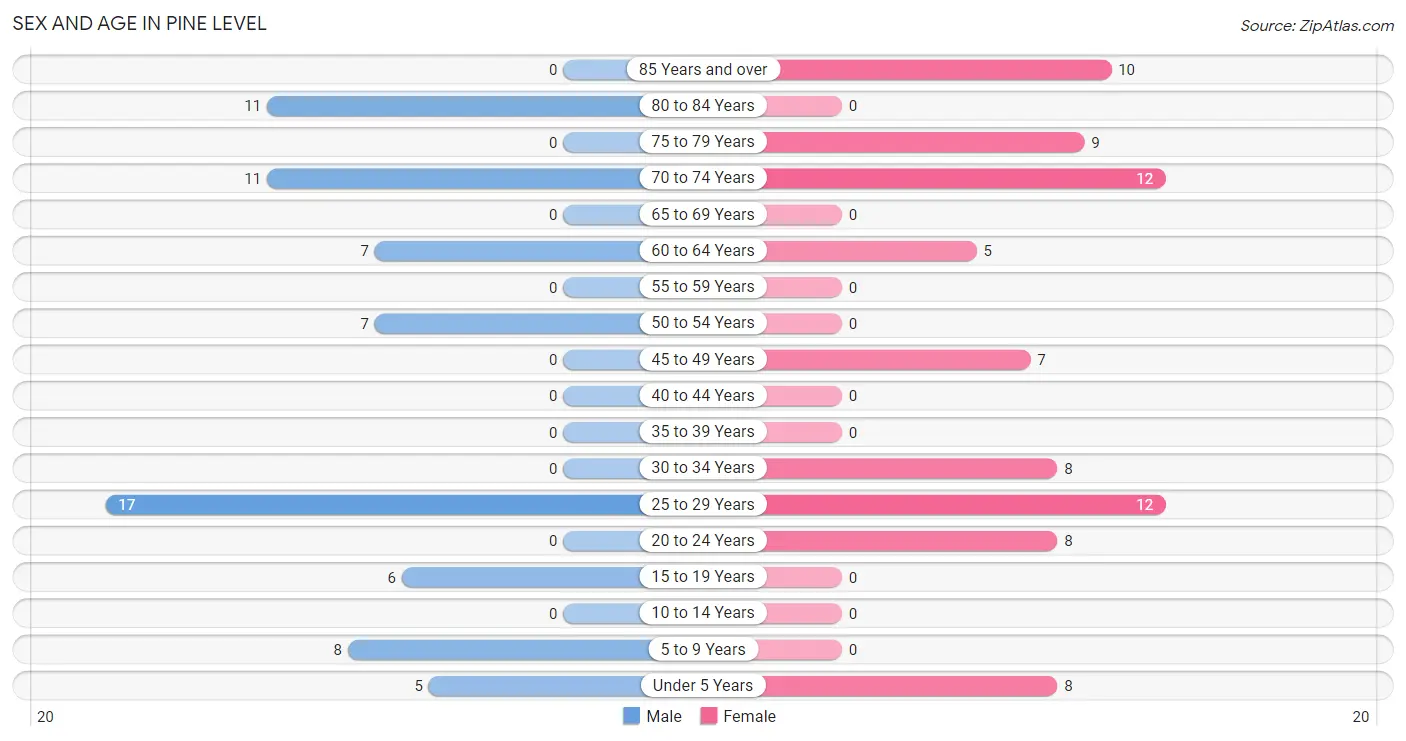
| Age Bracket | Male | Female |
| Under 5 Years | 5 (6.9%) | 8 (10.1%) |
| 5 to 9 Years | 8 (11.1%) | 0 (0.0%) |
| 10 to 14 Years | 0 (0.0%) | 0 (0.0%) |
| 15 to 19 Years | 6 (8.3%) | 0 (0.0%) |
| 20 to 24 Years | 0 (0.0%) | 8 (10.1%) |
| 25 to 29 Years | 17 (23.6%) | 12 (15.2%) |
| 30 to 34 Years | 0 (0.0%) | 8 (10.1%) |
| 35 to 39 Years | 0 (0.0%) | 0 (0.0%) |
| 40 to 44 Years | 0 (0.0%) | 0 (0.0%) |
| 45 to 49 Years | 0 (0.0%) | 7 (8.9%) |
| 50 to 54 Years | 7 (9.7%) | 0 (0.0%) |
| 55 to 59 Years | 0 (0.0%) | 0 (0.0%) |
| 60 to 64 Years | 7 (9.7%) | 5 (6.3%) |
| 65 to 69 Years | 0 (0.0%) | 0 (0.0%) |
| 70 to 74 Years | 11 (15.3%) | 12 (15.2%) |
| 75 to 79 Years | 0 (0.0%) | 9 (11.4%) |
| 80 to 84 Years | 11 (15.3%) | 0 (0.0%) |
| 85 Years and over | 0 (0.0%) | 10 (12.7%) |
| Total | 72 (100.0%) | 79 (100.0%) |
Families and Households in Pine Level
Median Family Size in Pine Level
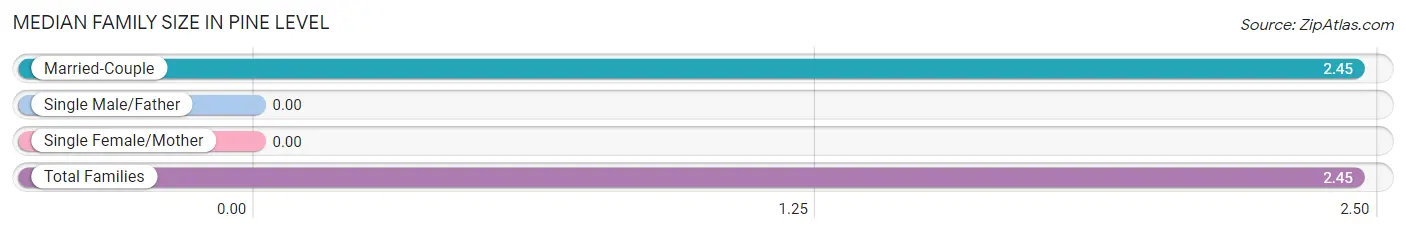
| Family Type | # Families | Family Size |
| Married-Couple | 58 (100.0%) | 2.45 |
| Single Male/Father | 0 (0.0%) | - |
| Single Female/Mother | 0 (0.0%) | - |
| Total Families | 58 (100.0%) | 2.45 |
Median Household Size in Pine Level
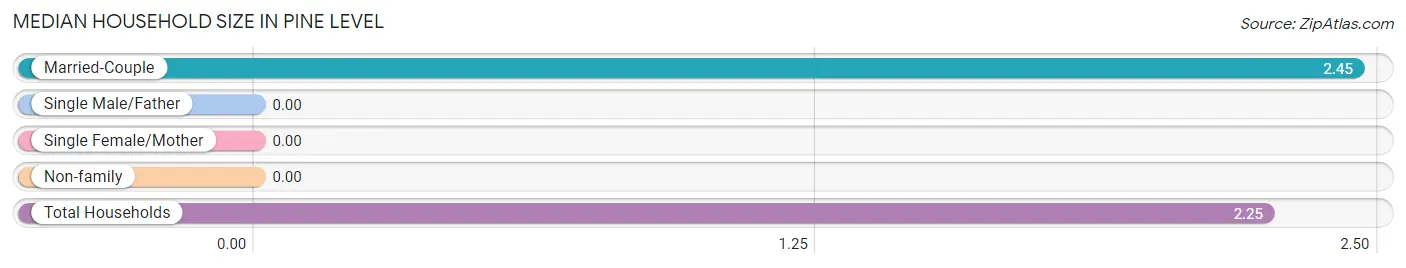
| Household Type | # Households | Household Size |
| Married-Couple | 58 (86.6%) | 2.45 |
| Single Male/Father | 0 (0.0%) | - |
| Single Female/Mother | 0 (0.0%) | - |
| Non-family | 9 (13.4%) | - |
| Total Households | 67 (100.0%) | 2.25 |
Household Size by Marriage Status in Pine Level
Out of a total of 67 households in Pine Level, 58 (86.6%) are family households, while 9 (13.4%) are nonfamily households. The most numerous type of family households are 2-person households, comprising 23, and the most common type of nonfamily households are 1-person households, comprising 9.
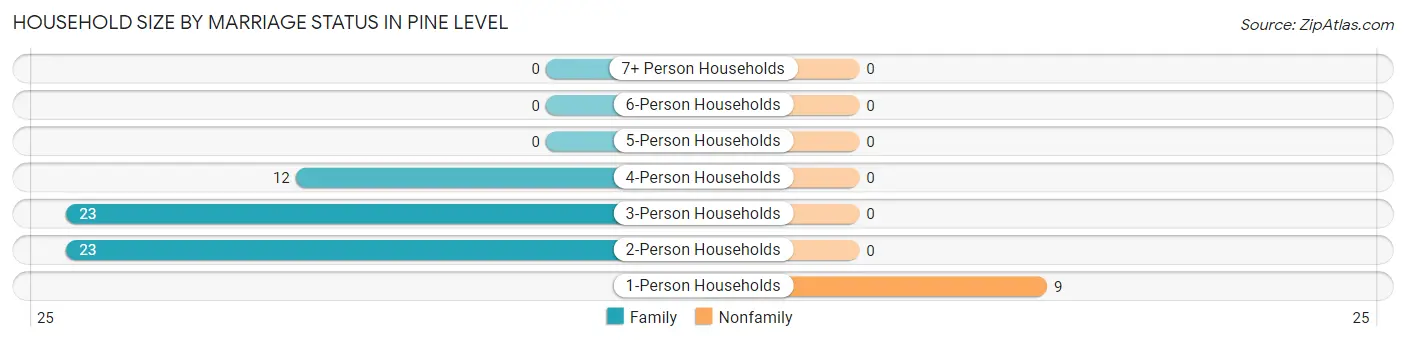
| Household Size | Family Households | Nonfamily Households |
| 1-Person Households | - | 9 (13.4%) |
| 2-Person Households | 23 (34.3%) | 0 (0.0%) |
| 3-Person Households | 23 (34.3%) | 0 (0.0%) |
| 4-Person Households | 12 (17.9%) | 0 (0.0%) |
| 5-Person Households | 0 (0.0%) | 0 (0.0%) |
| 6-Person Households | 0 (0.0%) | 0 (0.0%) |
| 7+ Person Households | 0 (0.0%) | 0 (0.0%) |
| Total | 58 (86.6%) | 9 (13.4%) |
Female Fertility in Pine Level
Fertility by Age in Pine Level
| Age Bracket | Women with Births | Births / 1,000 Women |
| 15 to 19 years | 0 (0.0%) | 0.0 |
| 20 to 34 years | 0 (0.0%) | 0.0 |
| 35 to 50 years | 0 (0.0%) | 0.0 |
| Total | 0 (0.0%) | 0.0 |
Fertility by Age by Marriage Status in Pine Level
| Age Bracket | Married | Unmarried |
| 15 to 19 years | 0 (0.0%) | 0 (0.0%) |
| 20 to 34 years | 0 (0.0%) | 0 (0.0%) |
| 35 to 50 years | 0 (0.0%) | 0 (0.0%) |
| Total | 0 (0.0%) | 0 (0.0%) |
Fertility by Education in Pine Level
| Educational Attainment | Women with Births | Births / 1,000 Women |
| Less than High School | 0 (0.0%) | 0.0 |
| High School Diploma | 0 (0.0%) | 0.0 |
| College or Associate's Degree | 0 (0.0%) | 0.0 |
| Bachelor's Degree | 0 (0.0%) | 0.0 |
| Graduate Degree | 0 (0.0%) | 0.0 |
| Total | 0 (0.0%) | 0.0 |
Fertility by Education by Marriage Status in Pine Level
| Educational Attainment | Married | Unmarried |
| Less than High School | 0 (0.0%) | 0 (0.0%) |
| High School Diploma | 0 (0.0%) | 0 (0.0%) |
| College or Associate's Degree | 0 (0.0%) | 0 (0.0%) |
| Bachelor's Degree | 0 (0.0%) | 0 (0.0%) |
| Graduate Degree | 0 (0.0%) | 0 (0.0%) |
| Total | 0 (0.0%) | 0 (0.0%) |
Employment Characteristics in Pine Level
Employment by Class of Employer in Pine Level
Among the 51 employed individuals in Pine Level, private company employees (25 | 49.0%), local government employees (19 | 37.2%), and self-employed (incorporated) (7 | 13.7%) make up the most common classes of employment.
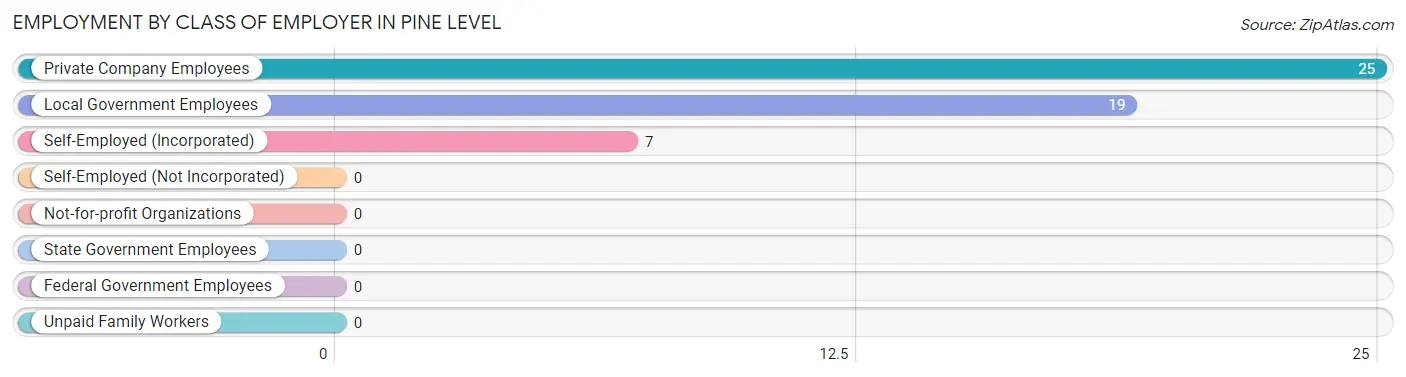
| Employer Class | # Employees | % Employees |
| Private Company Employees | 25 | 49.0% |
| Self-Employed (Incorporated) | 7 | 13.7% |
| Self-Employed (Not Incorporated) | 0 | 0.0% |
| Not-for-profit Organizations | 0 | 0.0% |
| Local Government Employees | 19 | 37.2% |
| State Government Employees | 0 | 0.0% |
| Federal Government Employees | 0 | 0.0% |
| Unpaid Family Workers | 0 | 0.0% |
| Total | 51 | 100.0% |
Employment Status by Age in Pine Level
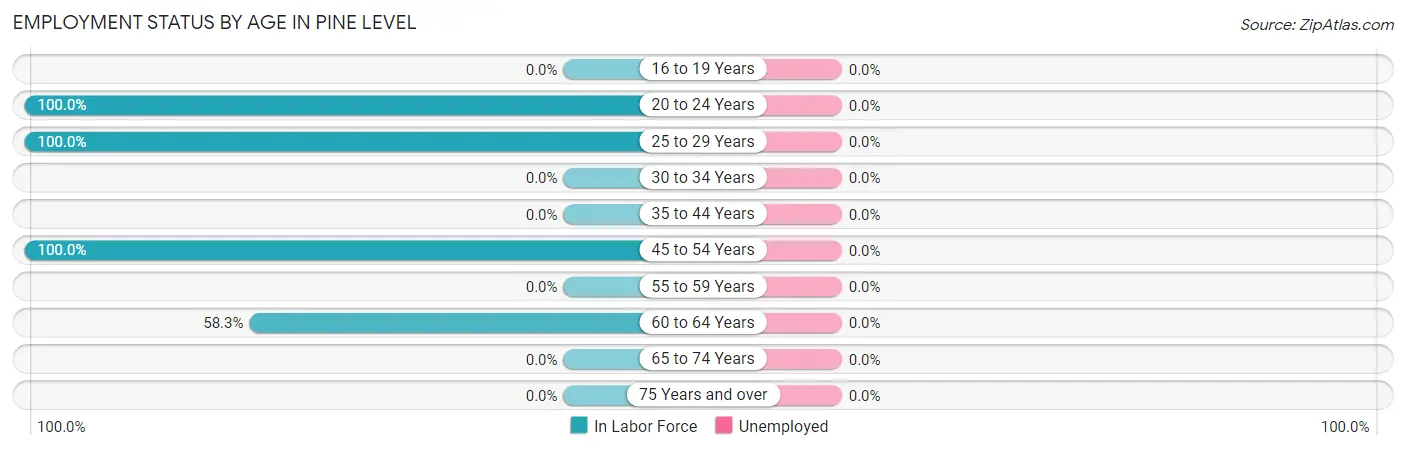
| Age Bracket | In Labor Force | Unemployed |
| 16 to 19 Years | 0 (0.0%) | 0 (0.0%) |
| 20 to 24 Years | 8 (100.0%) | 0 (0.0%) |
| 25 to 29 Years | 29 (100.0%) | 0 (0.0%) |
| 30 to 34 Years | 0 (0.0%) | 0 (0.0%) |
| 35 to 44 Years | 0 (0.0%) | 0 (0.0%) |
| 45 to 54 Years | 14 (100.0%) | 0 (0.0%) |
| 55 to 59 Years | 0 (0.0%) | 0 (0.0%) |
| 60 to 64 Years | 7 (58.3%) | 0 (0.0%) |
| 65 to 74 Years | 0 (0.0%) | 0 (0.0%) |
| 75 Years and over | 0 (0.0%) | 0 (0.0%) |
| Total | 58 (44.6%) | 0 (0.0%) |
Employment Status by Educational Attainment in Pine Level
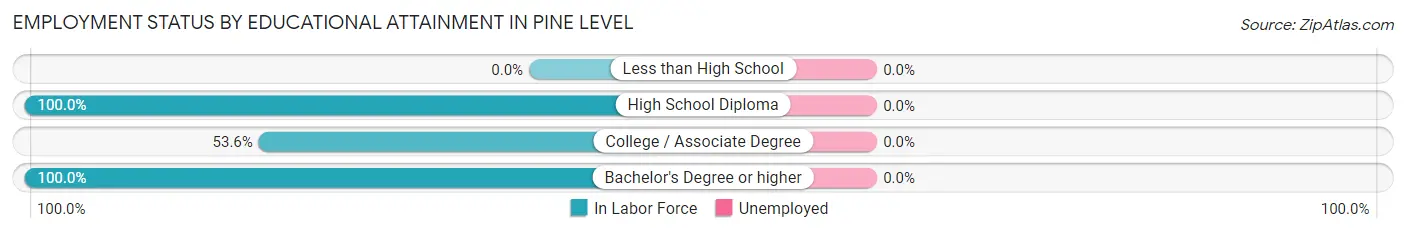
| Educational Attainment | In Labor Force | Unemployed |
| Less than High School | 0 (0.0%) | 0 (0.0%) |
| High School Diploma | 23 (100.0%) | 0 (0.0%) |
| College / Associate Degree | 15 (53.6%) | 0 (0.0%) |
| Bachelor's Degree or higher | 12 (100.0%) | 0 (0.0%) |
| Total | 50 (79.4%) | 0 (0.0%) |
Employment Occupations by Sex in Pine Level
Management, Business, Science and Arts Occupations
The most common Management, Business, Science and Arts occupations in Pine Level are Community & Social Service (19 | 32.8%), Education Instruction & Library (19 | 32.8%), and Management (15 | 25.9%).
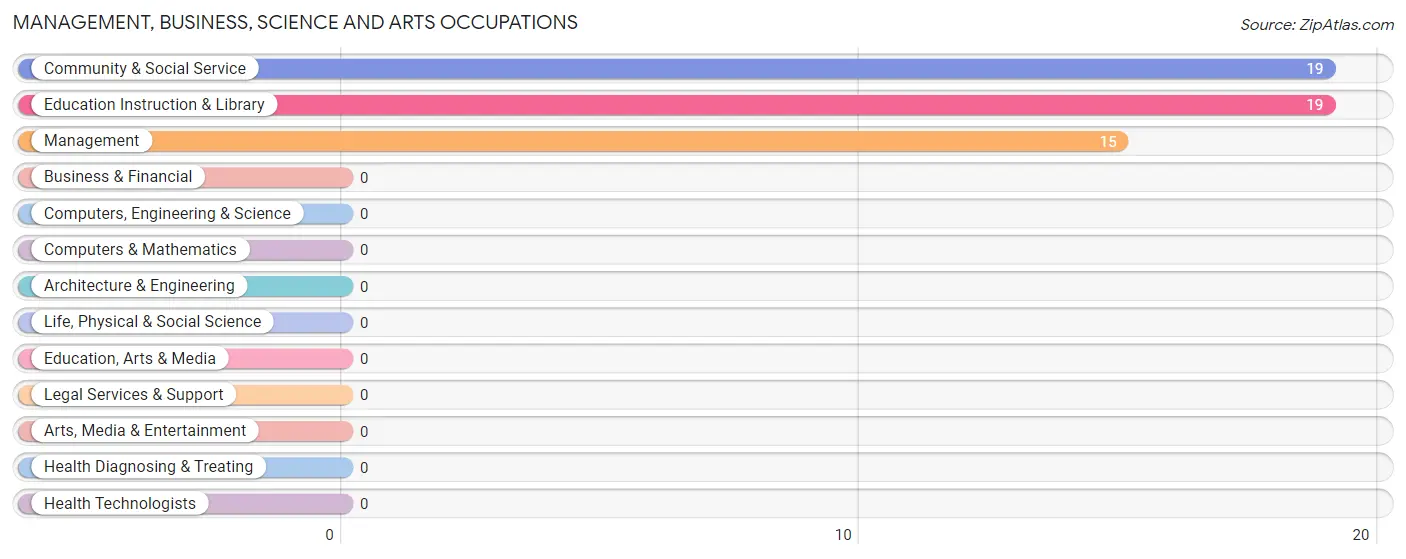
Management, Business, Science and Arts Occupations by Sex
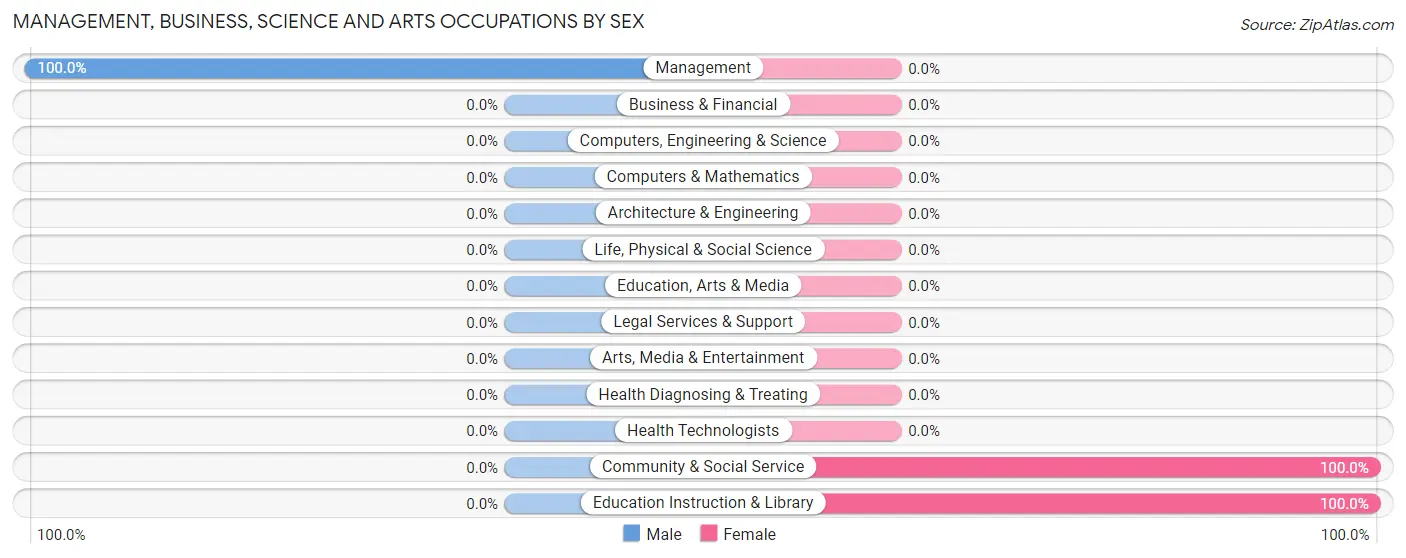
| Occupation | Male | Female |
| Management | 15 (100.0%) | 0 (0.0%) |
| Business & Financial | 0 (0.0%) | 0 (0.0%) |
| Computers, Engineering & Science | 0 (0.0%) | 0 (0.0%) |
| Computers & Mathematics | 0 (0.0%) | 0 (0.0%) |
| Architecture & Engineering | 0 (0.0%) | 0 (0.0%) |
| Life, Physical & Social Science | 0 (0.0%) | 0 (0.0%) |
| Community & Social Service | 0 (0.0%) | 19 (100.0%) |
| Education, Arts & Media | 0 (0.0%) | 0 (0.0%) |
| Legal Services & Support | 0 (0.0%) | 0 (0.0%) |
| Education Instruction & Library | 0 (0.0%) | 19 (100.0%) |
| Arts, Media & Entertainment | 0 (0.0%) | 0 (0.0%) |
| Health Diagnosing & Treating | 0 (0.0%) | 0 (0.0%) |
| Health Technologists | 0 (0.0%) | 0 (0.0%) |
| Total (Category) | 15 (44.1%) | 19 (55.9%) |
| Total (Overall) | 31 (53.4%) | 27 (46.6%) |
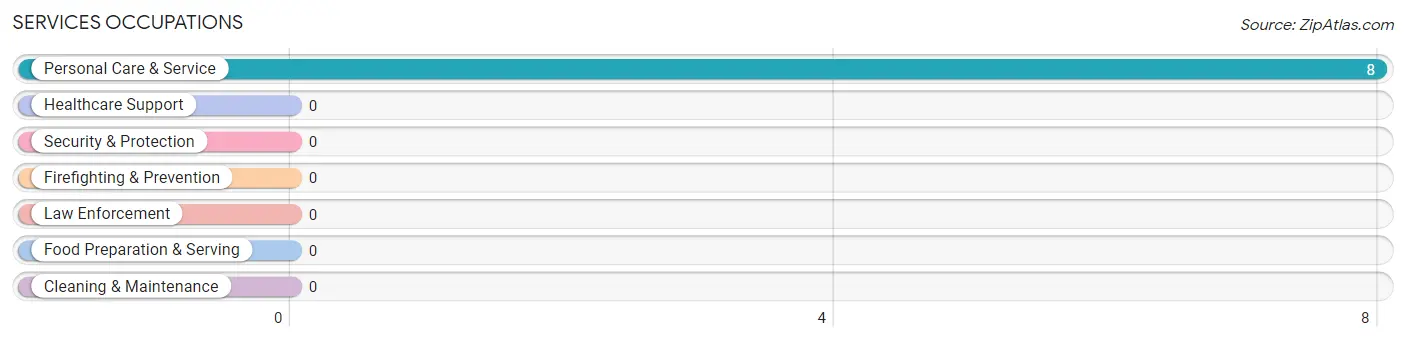
Services Occupations
The most common Services occupations in Pine Level are , and Personal Care & Service (8 | 13.8%).
Services Occupations by Sex
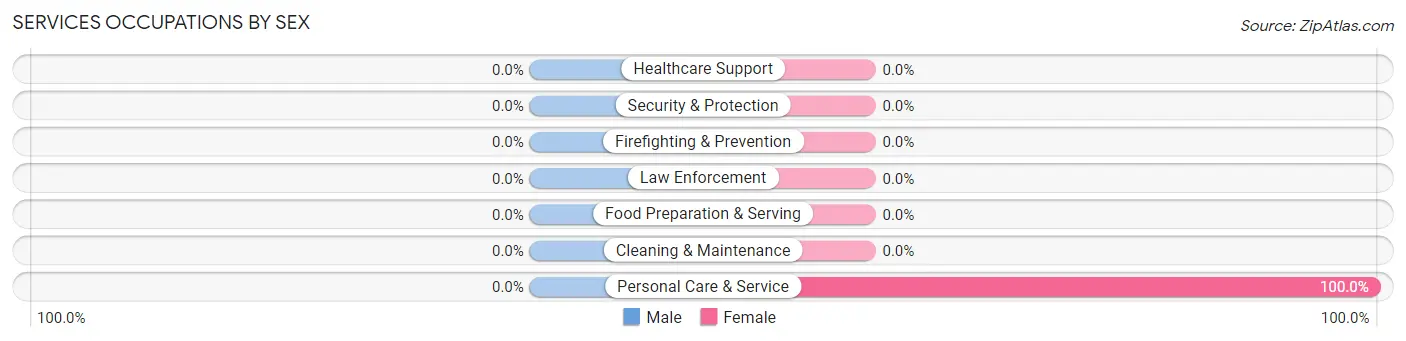
| Occupation | Male | Female |
| Healthcare Support | 0 (0.0%) | 0 (0.0%) |
| Security & Protection | 0 (0.0%) | 0 (0.0%) |
| Firefighting & Prevention | 0 (0.0%) | 0 (0.0%) |
| Law Enforcement | 0 (0.0%) | 0 (0.0%) |
| Food Preparation & Serving | 0 (0.0%) | 0 (0.0%) |
| Cleaning & Maintenance | 0 (0.0%) | 0 (0.0%) |
| Personal Care & Service | 0 (0.0%) | 8 (100.0%) |
| Total (Category) | 0 (0.0%) | 8 (100.0%) |
| Total (Overall) | 31 (53.4%) | 27 (46.6%) |
Sales and Office Occupations
Sales and Office Occupations by Sex
| Occupation | Male | Female |
| Sales & Related | 0 (0.0%) | 0 (0.0%) |
| Office & Administration | 0 (0.0%) | 0 (0.0%) |
| Total (Category) | 0 (0.0%) | 0 (0.0%) |
| Total (Overall) | 31 (53.4%) | 27 (46.6%) |
Natural Resources, Construction and Maintenance Occupations
The most common Natural Resources, Construction and Maintenance occupations in Pine Level are , and Farming, Fishing & Forestry (9 | 15.5%).
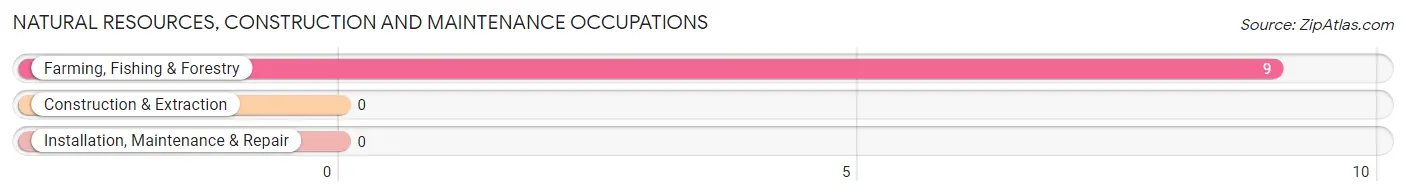
Natural Resources, Construction and Maintenance Occupations by Sex
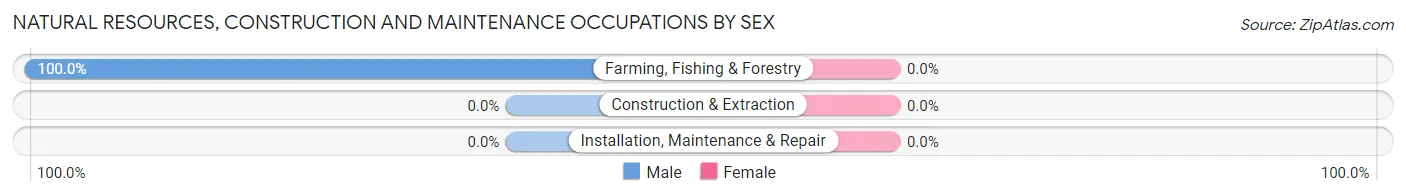
| Occupation | Male | Female |
| Farming, Fishing & Forestry | 9 (100.0%) | 0 (0.0%) |
| Construction & Extraction | 0 (0.0%) | 0 (0.0%) |
| Installation, Maintenance & Repair | 0 (0.0%) | 0 (0.0%) |
| Total (Category) | 9 (100.0%) | 0 (0.0%) |
| Total (Overall) | 31 (53.4%) | 27 (46.6%) |
Production, Transportation and Moving Occupations
The most common Production, Transportation and Moving occupations in Pine Level are , and Production (7 | 12.1%).
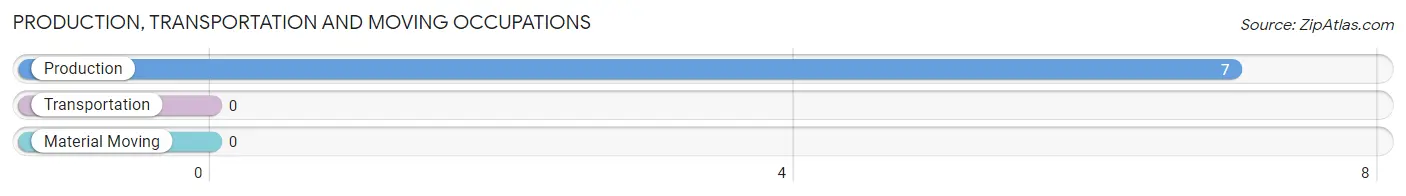
Production, Transportation and Moving Occupations by Sex
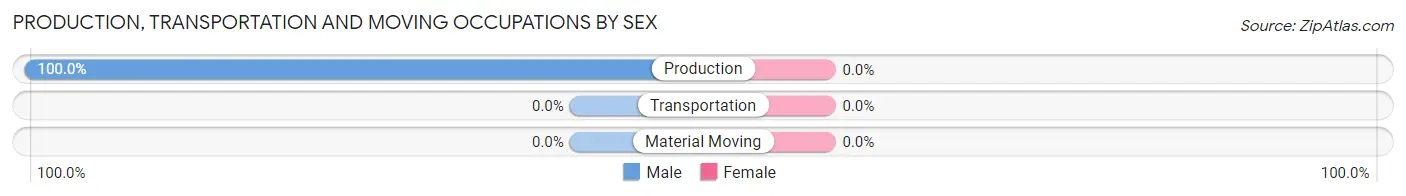
| Occupation | Male | Female |
| Production | 7 (100.0%) | 0 (0.0%) |
| Transportation | 0 (0.0%) | 0 (0.0%) |
| Material Moving | 0 (0.0%) | 0 (0.0%) |
| Total (Category) | 7 (100.0%) | 0 (0.0%) |
| Total (Overall) | 31 (53.4%) | 27 (46.6%) |
Employment Industries by Sex in Pine Level
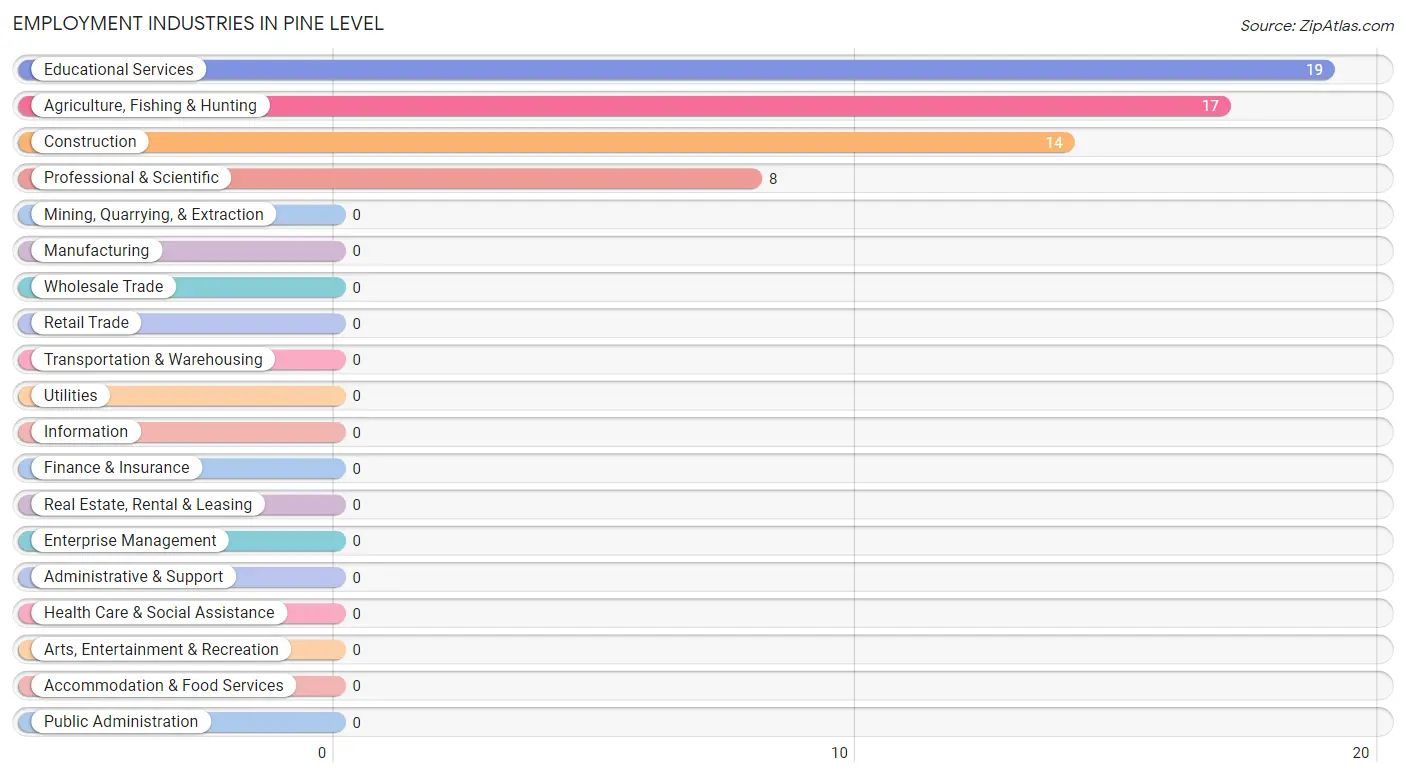
Employment Industries in Pine Level
The major employment industries in Pine Level include Educational Services (19 | 32.8%), Agriculture, Fishing & Hunting (17 | 29.3%), Construction (14 | 24.1%), and Professional & Scientific (8 | 13.8%).
Employment Industries by Sex in Pine Level
The Pine Level industries that see more men than women are Agriculture, Fishing & Hunting (100.0%), and Construction (100.0%), whereas the industries that tend to have a higher number of women are Professional & Scientific (100.0%), and Educational Services (100.0%).
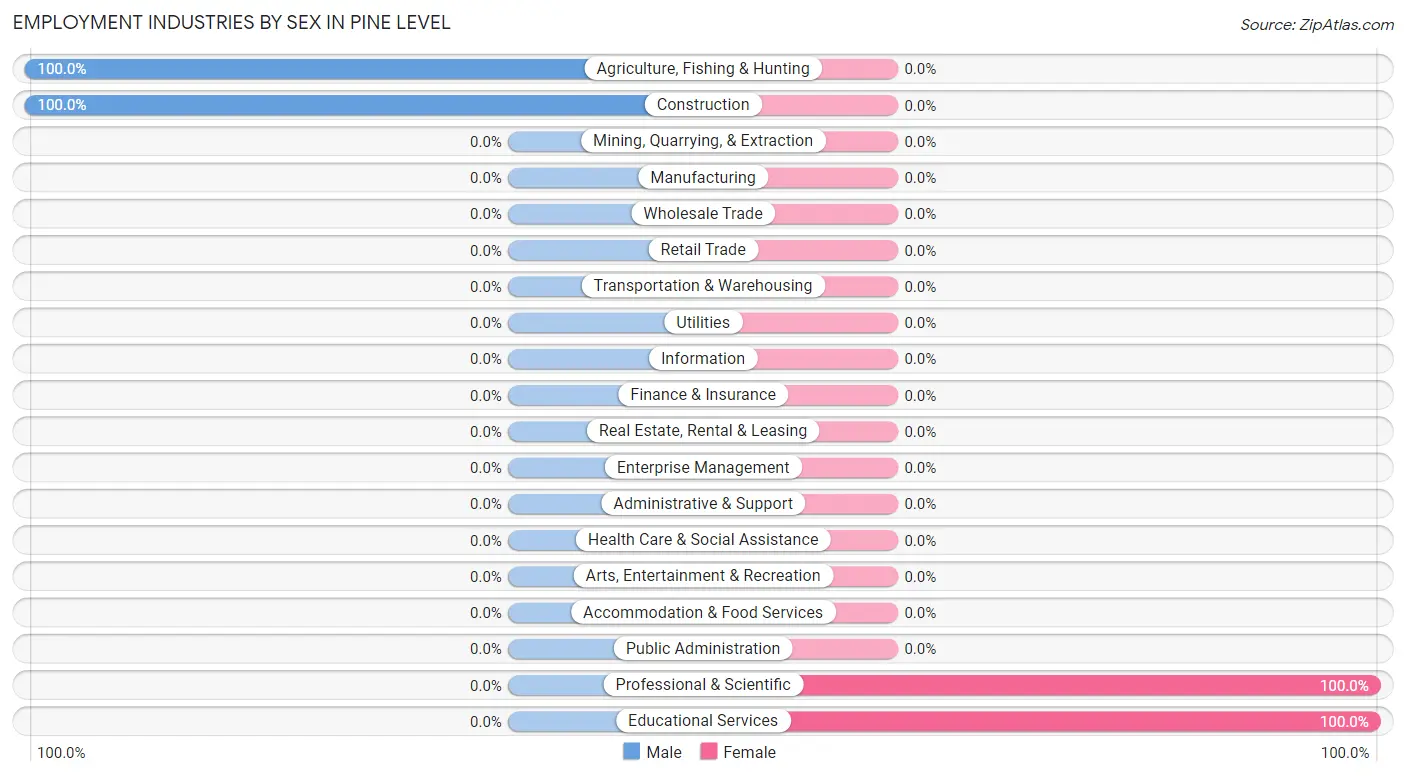
| Industry | Male | Female |
| Agriculture, Fishing & Hunting | 17 (100.0%) | 0 (0.0%) |
| Mining, Quarrying, & Extraction | 0 (0.0%) | 0 (0.0%) |
| Construction | 14 (100.0%) | 0 (0.0%) |
| Manufacturing | 0 (0.0%) | 0 (0.0%) |
| Wholesale Trade | 0 (0.0%) | 0 (0.0%) |
| Retail Trade | 0 (0.0%) | 0 (0.0%) |
| Transportation & Warehousing | 0 (0.0%) | 0 (0.0%) |
| Utilities | 0 (0.0%) | 0 (0.0%) |
| Information | 0 (0.0%) | 0 (0.0%) |
| Finance & Insurance | 0 (0.0%) | 0 (0.0%) |
| Real Estate, Rental & Leasing | 0 (0.0%) | 0 (0.0%) |
| Professional & Scientific | 0 (0.0%) | 8 (100.0%) |
| Enterprise Management | 0 (0.0%) | 0 (0.0%) |
| Administrative & Support | 0 (0.0%) | 0 (0.0%) |
| Educational Services | 0 (0.0%) | 19 (100.0%) |
| Health Care & Social Assistance | 0 (0.0%) | 0 (0.0%) |
| Arts, Entertainment & Recreation | 0 (0.0%) | 0 (0.0%) |
| Accommodation & Food Services | 0 (0.0%) | 0 (0.0%) |
| Public Administration | 0 (0.0%) | 0 (0.0%) |
| Total | 31 (53.4%) | 27 (46.6%) |
Education in Pine Level
School Enrollment in Pine Level
The most common levels of schooling among the 22 students in Pine Level are kindergarten (8 | 36.4%), college / undergraduate (8 | 36.4%), and high school (6 | 27.3%).
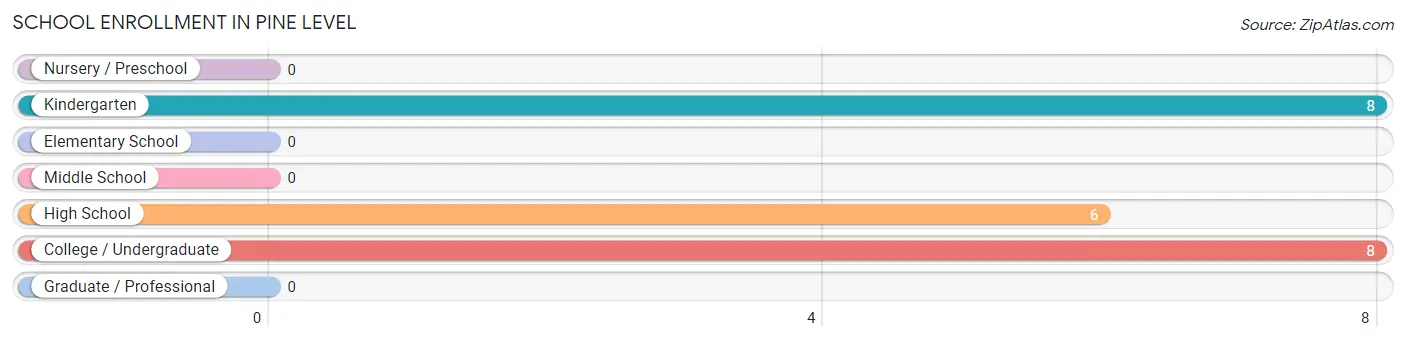
| School Level | # Students | % Students |
| Nursery / Preschool | 0 | 0.0% |
| Kindergarten | 8 | 36.4% |
| Elementary School | 0 | 0.0% |
| Middle School | 0 | 0.0% |
| High School | 6 | 27.3% |
| College / Undergraduate | 8 | 36.4% |
| Graduate / Professional | 0 | 0.0% |
| Total | 22 | 100.0% |
School Enrollment by Age by Funding Source in Pine Level
Out of a total of 22 students who are enrolled in schools in Pine Level, 8 (36.4%) attend a private institution, while the remaining 14 (63.6%) are enrolled in public schools. The age group of 5 to 9 year old has the highest likelihood of being enrolled in private schools, with 8 (100.0% in the age bracket) enrolled. Conversely, the age group of 18 to 19 year olds has the lowest likelihood of being enrolled in a private school, with 6 (100.0% in the age bracket) attending a public institution.
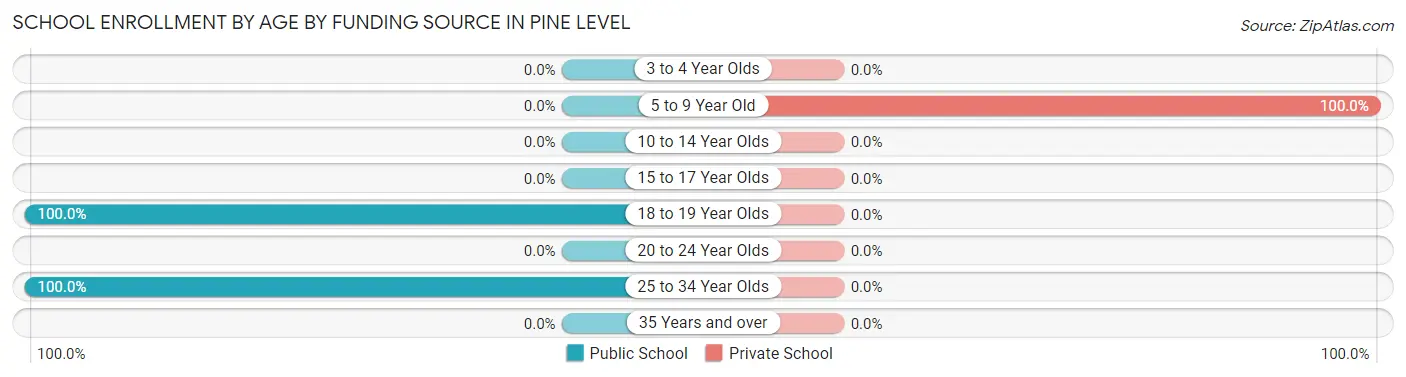
| Age Bracket | Public School | Private School |
| 3 to 4 Year Olds | 0 (0.0%) | 0 (0.0%) |
| 5 to 9 Year Old | 0 (0.0%) | 8 (100.0%) |
| 10 to 14 Year Olds | 0 (0.0%) | 0 (0.0%) |
| 15 to 17 Year Olds | 0 (0.0%) | 0 (0.0%) |
| 18 to 19 Year Olds | 6 (100.0%) | 0 (0.0%) |
| 20 to 24 Year Olds | 0 (0.0%) | 0 (0.0%) |
| 25 to 34 Year Olds | 8 (100.0%) | 0 (0.0%) |
| 35 Years and over | 0 (0.0%) | 0 (0.0%) |
| Total | 14 (63.6%) | 8 (36.4%) |
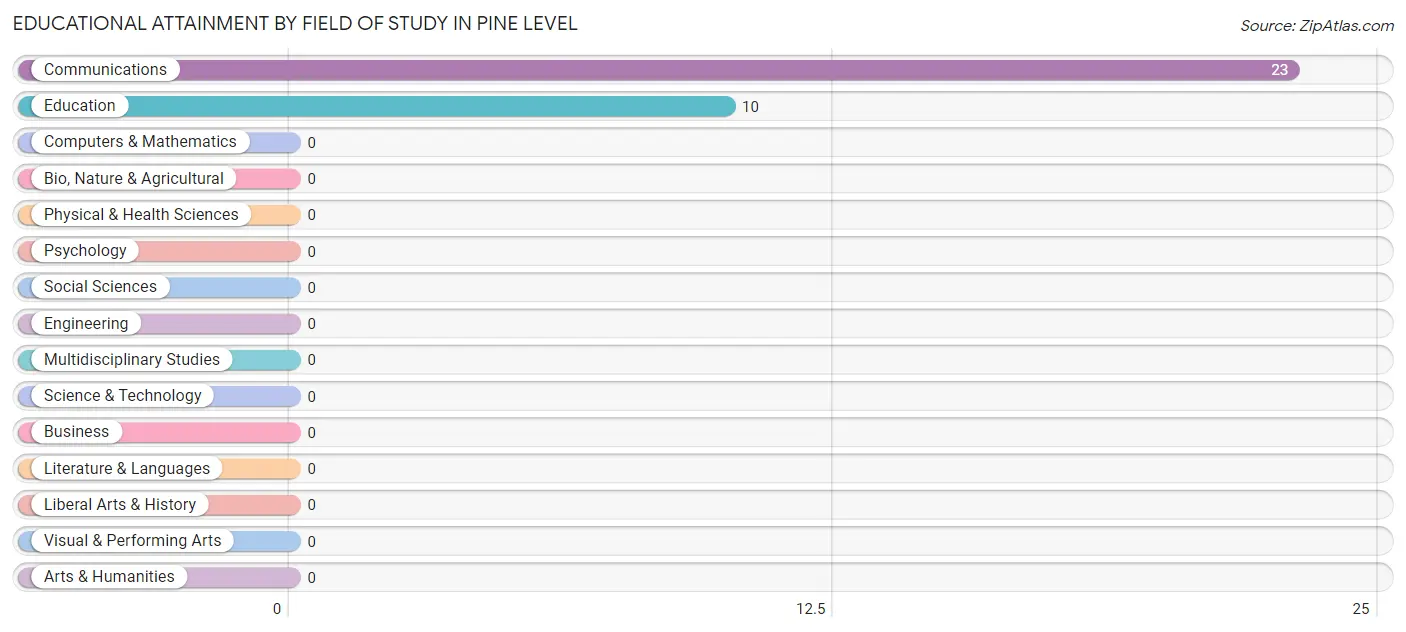
Educational Attainment by Field of Study in Pine Level
Communications (23 | 69.7%), and education (10 | 30.3%) are the most common fields of study among 33 individuals in Pine Level who have obtained a bachelor's degree or higher.
| Field of Study | # Graduates | % Graduates |
| Computers & Mathematics | 0 | 0.0% |
| Bio, Nature & Agricultural | 0 | 0.0% |
| Physical & Health Sciences | 0 | 0.0% |
| Psychology | 0 | 0.0% |
| Social Sciences | 0 | 0.0% |
| Engineering | 0 | 0.0% |
| Multidisciplinary Studies | 0 | 0.0% |
| Science & Technology | 0 | 0.0% |
| Business | 0 | 0.0% |
| Education | 10 | 30.3% |
| Literature & Languages | 0 | 0.0% |
| Liberal Arts & History | 0 | 0.0% |
| Visual & Performing Arts | 0 | 0.0% |
| Communications | 23 | 69.7% |
| Arts & Humanities | 0 | 0.0% |
| Total | 33 | 100.0% |
Transportation & Commute in Pine Level
Vehicle Availability by Sex in Pine Level
The most prevalent vehicle ownership categories in Pine Level are males with 2 vehicles (17, accounting for 70.8%) and females with 2 vehicles (20, making up 63.0%).
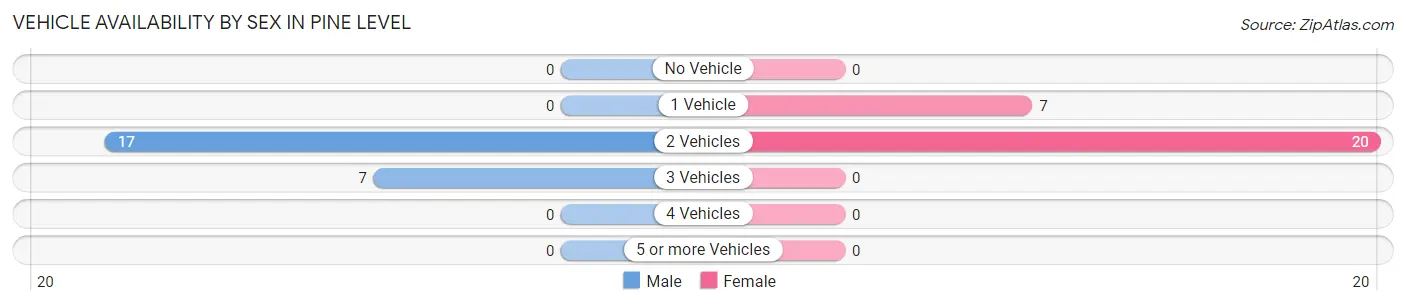
| Vehicles Available | Male | Female |
| No Vehicle | 0 (0.0%) | 0 (0.0%) |
| 1 Vehicle | 0 (0.0%) | 7 (25.9%) |
| 2 Vehicles | 17 (70.8%) | 20 (74.1%) |
| 3 Vehicles | 7 (29.2%) | 0 (0.0%) |
| 4 Vehicles | 0 (0.0%) | 0 (0.0%) |
| 5 or more Vehicles | 0 (0.0%) | 0 (0.0%) |
| Total | 24 (100.0%) | 27 (100.0%) |
Commute Time in Pine Level
The most frequently occuring commute durations in Pine Level are 5 to 9 minutes (29 commuters, 56.9%), 30 to 34 minutes (22 commuters, 43.1%), and less than 5 minutes (0 commuters, 0.0%).
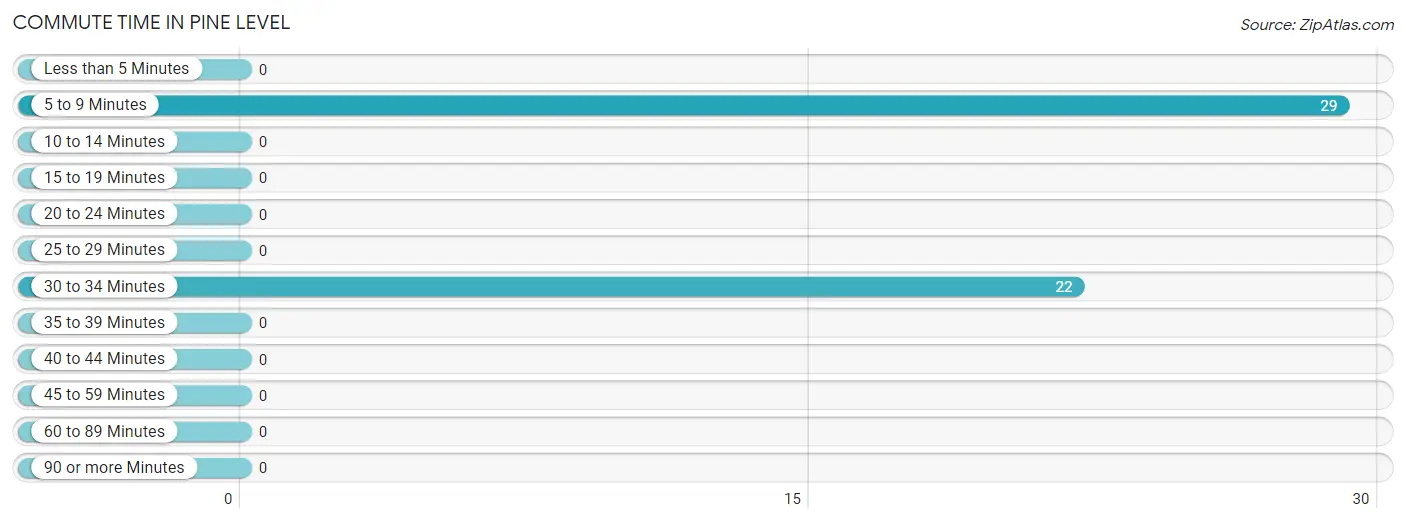
| Commute Time | # Commuters | % Commuters |
| Less than 5 Minutes | 0 | 0.0% |
| 5 to 9 Minutes | 29 | 56.9% |
| 10 to 14 Minutes | 0 | 0.0% |
| 15 to 19 Minutes | 0 | 0.0% |
| 20 to 24 Minutes | 0 | 0.0% |
| 25 to 29 Minutes | 0 | 0.0% |
| 30 to 34 Minutes | 22 | 43.1% |
| 35 to 39 Minutes | 0 | 0.0% |
| 40 to 44 Minutes | 0 | 0.0% |
| 45 to 59 Minutes | 0 | 0.0% |
| 60 to 89 Minutes | 0 | 0.0% |
| 90 or more Minutes | 0 | 0.0% |
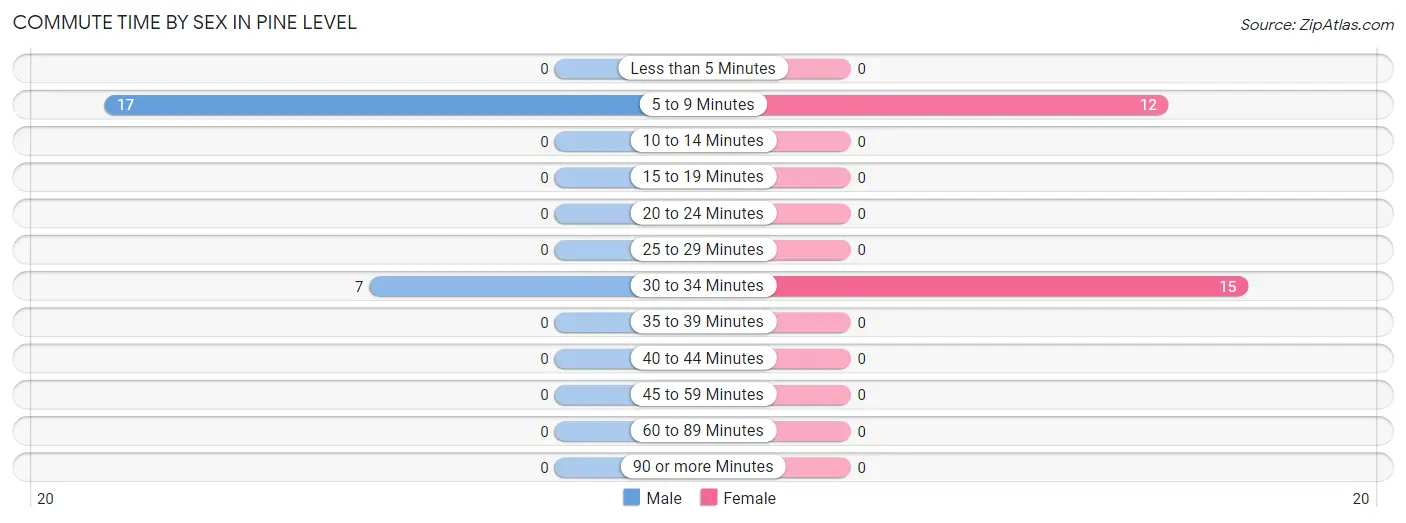
Commute Time by Sex in Pine Level
The most common commute times in Pine Level are 5 to 9 minutes (17 commuters, 70.8%) for males and 30 to 34 minutes (15 commuters, 55.6%) for females.
| Commute Time | Male | Female |
| Less than 5 Minutes | 0 (0.0%) | 0 (0.0%) |
| 5 to 9 Minutes | 17 (70.8%) | 12 (44.4%) |
| 10 to 14 Minutes | 0 (0.0%) | 0 (0.0%) |
| 15 to 19 Minutes | 0 (0.0%) | 0 (0.0%) |
| 20 to 24 Minutes | 0 (0.0%) | 0 (0.0%) |
| 25 to 29 Minutes | 0 (0.0%) | 0 (0.0%) |
| 30 to 34 Minutes | 7 (29.2%) | 15 (55.6%) |
| 35 to 39 Minutes | 0 (0.0%) | 0 (0.0%) |
| 40 to 44 Minutes | 0 (0.0%) | 0 (0.0%) |
| 45 to 59 Minutes | 0 (0.0%) | 0 (0.0%) |
| 60 to 89 Minutes | 0 (0.0%) | 0 (0.0%) |
| 90 or more Minutes | 0 (0.0%) | 0 (0.0%) |
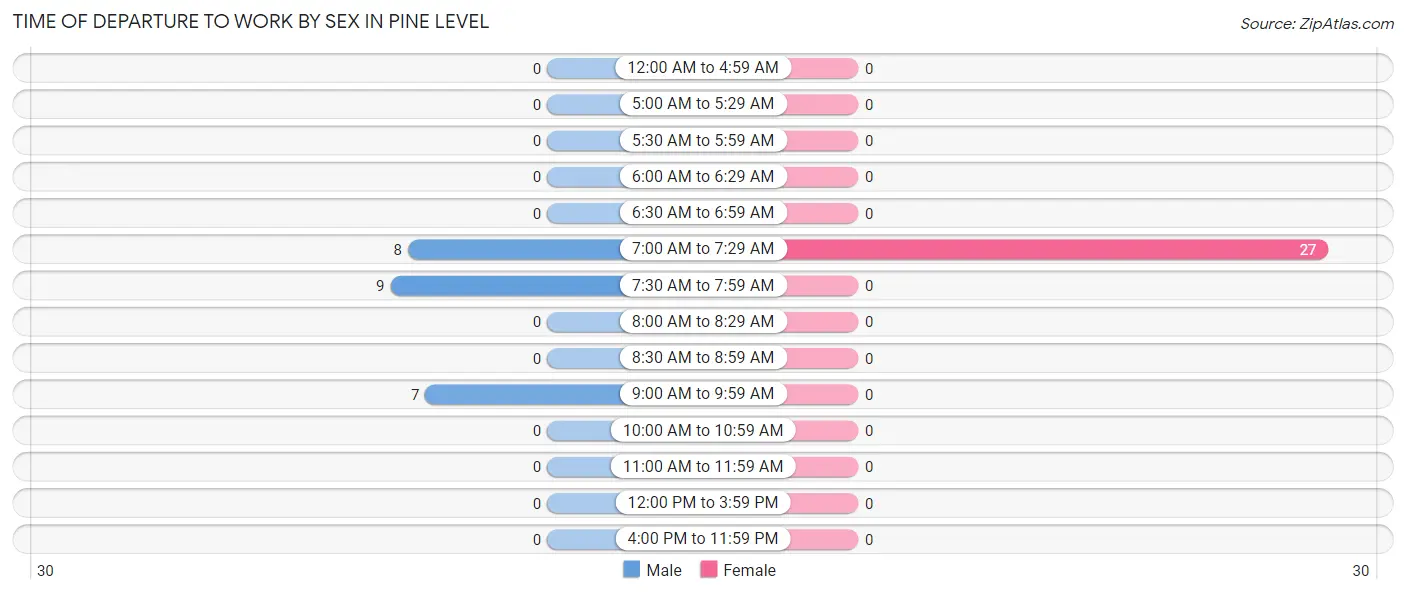
Time of Departure to Work by Sex in Pine Level
The most frequent times of departure to work in Pine Level are 7:30 AM to 7:59 AM (9, 37.5%) for males and 7:00 AM to 7:29 AM (27, 100.0%) for females.
| Time of Departure | Male | Female |
| 12:00 AM to 4:59 AM | 0 (0.0%) | 0 (0.0%) |
| 5:00 AM to 5:29 AM | 0 (0.0%) | 0 (0.0%) |
| 5:30 AM to 5:59 AM | 0 (0.0%) | 0 (0.0%) |
| 6:00 AM to 6:29 AM | 0 (0.0%) | 0 (0.0%) |
| 6:30 AM to 6:59 AM | 0 (0.0%) | 0 (0.0%) |
| 7:00 AM to 7:29 AM | 8 (33.3%) | 27 (100.0%) |
| 7:30 AM to 7:59 AM | 9 (37.5%) | 0 (0.0%) |
| 8:00 AM to 8:29 AM | 0 (0.0%) | 0 (0.0%) |
| 8:30 AM to 8:59 AM | 0 (0.0%) | 0 (0.0%) |
| 9:00 AM to 9:59 AM | 7 (29.2%) | 0 (0.0%) |
| 10:00 AM to 10:59 AM | 0 (0.0%) | 0 (0.0%) |
| 11:00 AM to 11:59 AM | 0 (0.0%) | 0 (0.0%) |
| 12:00 PM to 3:59 PM | 0 (0.0%) | 0 (0.0%) |
| 4:00 PM to 11:59 PM | 0 (0.0%) | 0 (0.0%) |
| Total | 24 (100.0%) | 27 (100.0%) |
Housing Occupancy in Pine Level
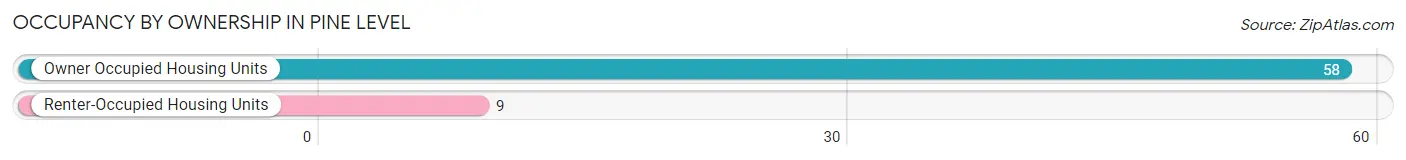
Occupancy by Ownership in Pine Level
Of the total 67 dwellings in Pine Level, owner-occupied units account for 58 (86.6%), while renter-occupied units make up 9 (13.4%).
| Occupancy | # Housing Units | % Housing Units |
| Owner Occupied Housing Units | 58 | 86.6% |
| Renter-Occupied Housing Units | 9 | 13.4% |
| Total Occupied Housing Units | 67 | 100.0% |
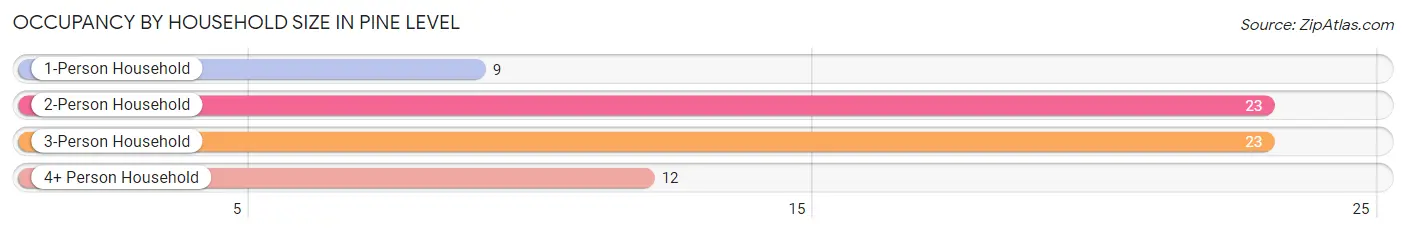
Occupancy by Household Size in Pine Level
| Household Size | # Housing Units | % Housing Units |
| 1-Person Household | 9 | 13.4% |
| 2-Person Household | 23 | 34.3% |
| 3-Person Household | 23 | 34.3% |
| 4+ Person Household | 12 | 17.9% |
| Total Housing Units | 67 | 100.0% |
Occupancy by Ownership by Household Size in Pine Level
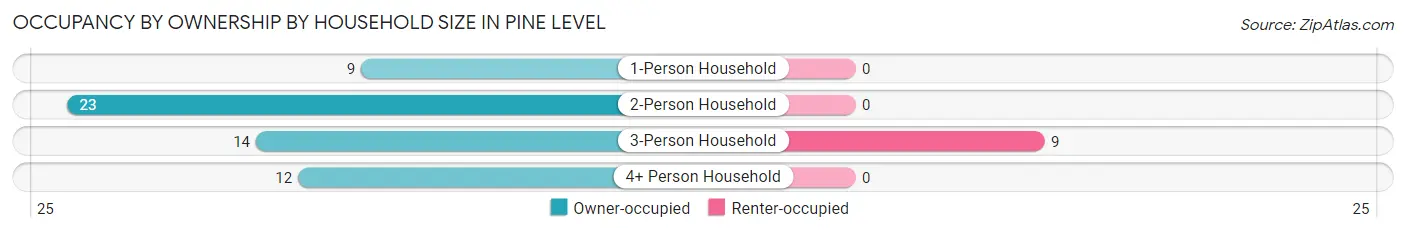
| Household Size | Owner-occupied | Renter-occupied |
| 1-Person Household | 9 (100.0%) | 0 (0.0%) |
| 2-Person Household | 23 (100.0%) | 0 (0.0%) |
| 3-Person Household | 14 (60.9%) | 9 (39.1%) |
| 4+ Person Household | 12 (100.0%) | 0 (0.0%) |
| Total Housing Units | 58 (86.6%) | 9 (13.4%) |
Occupancy by Educational Attainment in Pine Level
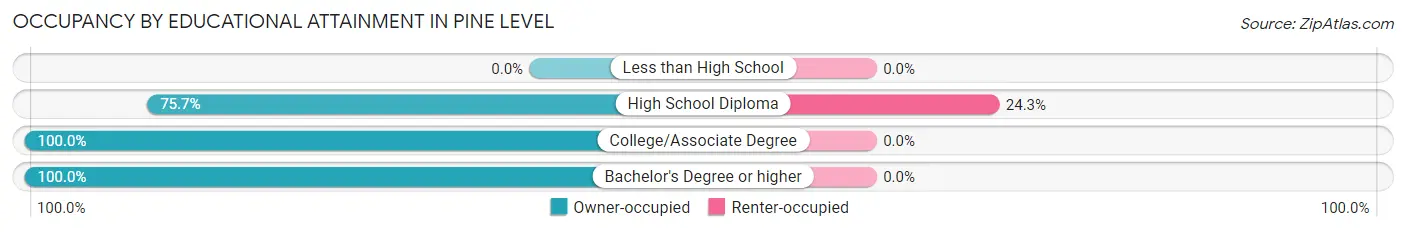
| Household Size | Owner-occupied | Renter-occupied |
| Less than High School | 0 (0.0%) | 0 (0.0%) |
| High School Diploma | 28 (75.7%) | 9 (24.3%) |
| College/Associate Degree | 7 (100.0%) | 0 (0.0%) |
| Bachelor's Degree or higher | 23 (100.0%) | 0 (0.0%) |
Occupancy by Age of Householder in Pine Level
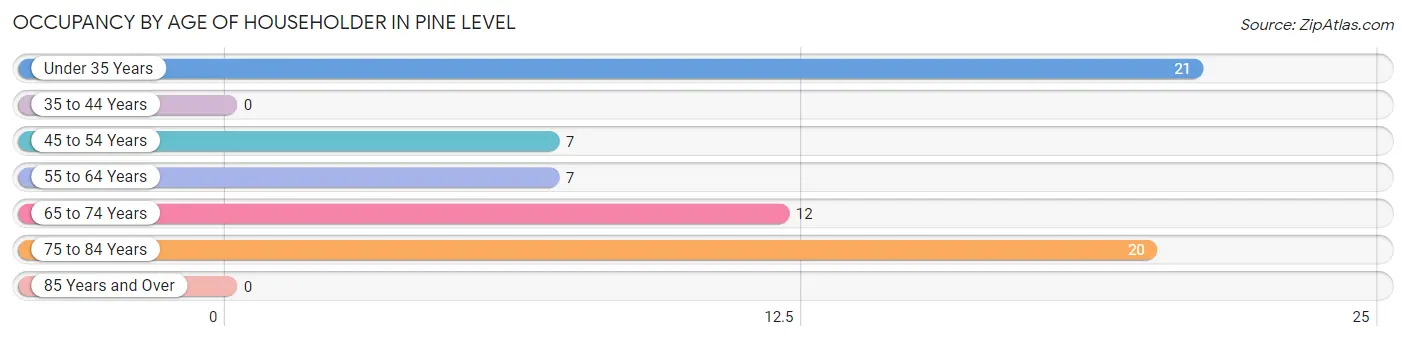
| Age Bracket | # Households | % Households |
| Under 35 Years | 21 | 31.3% |
| 35 to 44 Years | 0 | 0.0% |
| 45 to 54 Years | 7 | 10.4% |
| 55 to 64 Years | 7 | 10.4% |
| 65 to 74 Years | 12 | 17.9% |
| 75 to 84 Years | 20 | 29.8% |
| 85 Years and Over | 0 | 0.0% |
| Total | 67 | 100.0% |
Housing Finances in Pine Level
Median Income by Occupancy in Pine Level
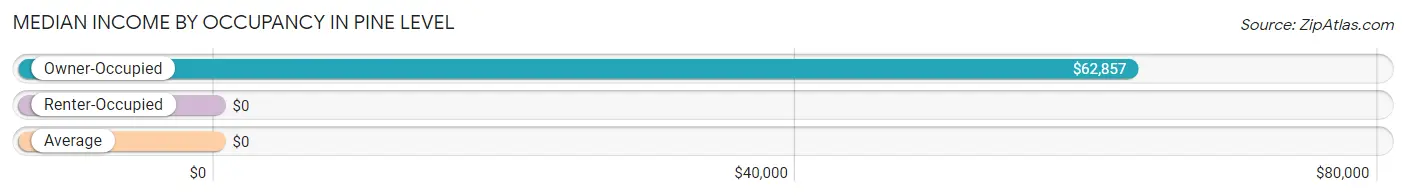
| Occupancy Type | # Households | Median Income |
| Owner-Occupied | 58 (86.6%) | $62,857 |
| Renter-Occupied | 9 (13.4%) | $0 |
| Average | 67 (100.0%) | $0 |
Occupancy by Householder Income Bracket in Pine Level
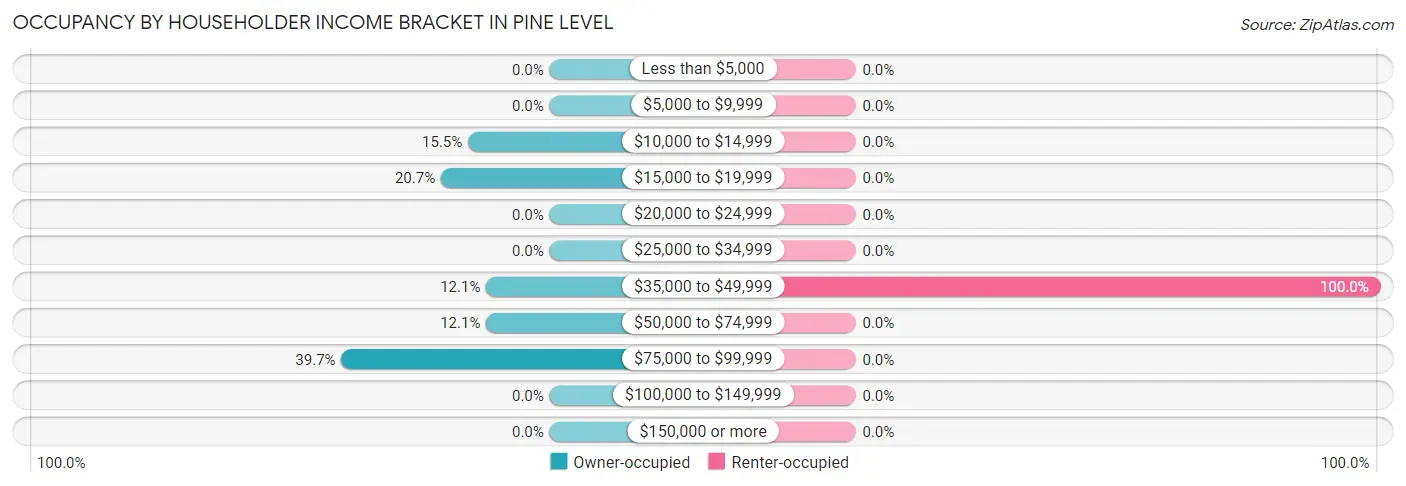
| Income Bracket | Owner-occupied | Renter-occupied |
| Less than $5,000 | 0 (0.0%) | 0 (0.0%) |
| $5,000 to $9,999 | 0 (0.0%) | 0 (0.0%) |
| $10,000 to $14,999 | 9 (15.5%) | 0 (0.0%) |
| $15,000 to $19,999 | 12 (20.7%) | 0 (0.0%) |
| $20,000 to $24,999 | 0 (0.0%) | 0 (0.0%) |
| $25,000 to $34,999 | 0 (0.0%) | 0 (0.0%) |
| $35,000 to $49,999 | 7 (12.1%) | 9 (100.0%) |
| $50,000 to $74,999 | 7 (12.1%) | 0 (0.0%) |
| $75,000 to $99,999 | 23 (39.7%) | 0 (0.0%) |
| $100,000 to $149,999 | 0 (0.0%) | 0 (0.0%) |
| $150,000 or more | 0 (0.0%) | 0 (0.0%) |
| Total | 58 (100.0%) | 9 (100.0%) |
Monthly Housing Cost Tiers in Pine Level
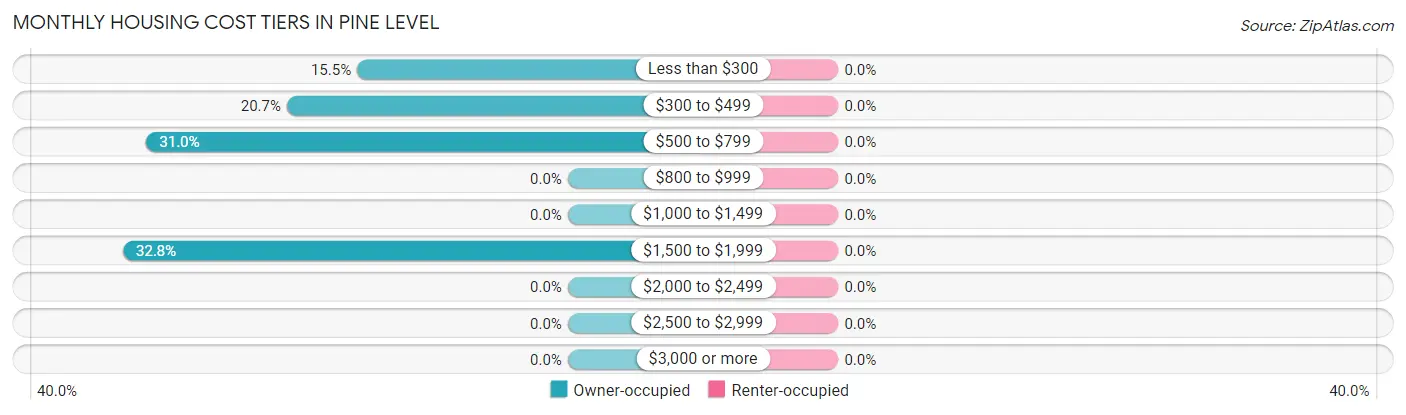
| Monthly Cost | Owner-occupied | Renter-occupied |
| Less than $300 | 9 (15.5%) | 0 (0.0%) |
| $300 to $499 | 12 (20.7%) | 0 (0.0%) |
| $500 to $799 | 18 (31.0%) | 0 (0.0%) |
| $800 to $999 | 0 (0.0%) | 0 (0.0%) |
| $1,000 to $1,499 | 0 (0.0%) | 0 (0.0%) |
| $1,500 to $1,999 | 19 (32.8%) | 0 (0.0%) |
| $2,000 to $2,499 | 0 (0.0%) | 0 (0.0%) |
| $2,500 to $2,999 | 0 (0.0%) | 0 (0.0%) |
| $3,000 or more | 0 (0.0%) | 0 (0.0%) |
| Total | 58 (100.0%) | 9 (100.0%) |
Physical Housing Characteristics in Pine Level
Housing Structures in Pine Level
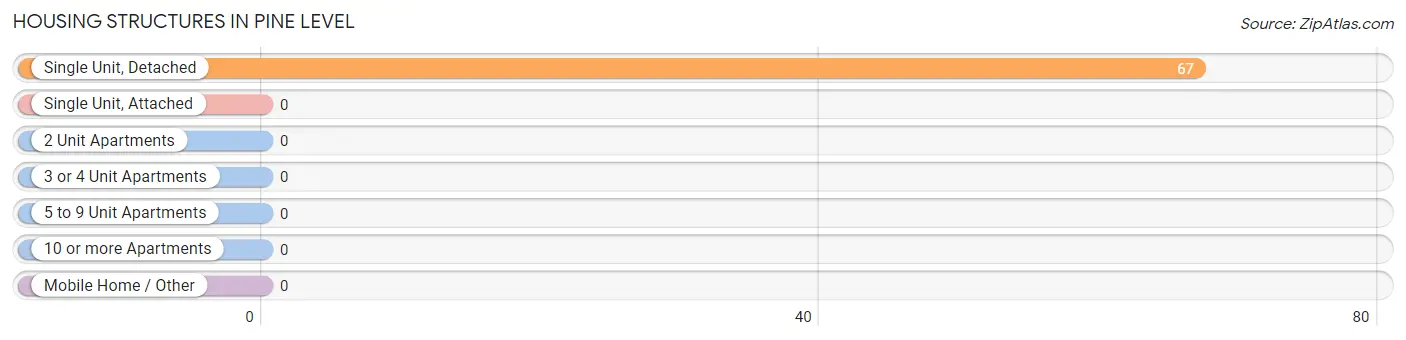
| Structure Type | # Housing Units | % Housing Units |
| Single Unit, Detached | 67 | 100.0% |
| Single Unit, Attached | 0 | 0.0% |
| 2 Unit Apartments | 0 | 0.0% |
| 3 or 4 Unit Apartments | 0 | 0.0% |
| 5 to 9 Unit Apartments | 0 | 0.0% |
| 10 or more Apartments | 0 | 0.0% |
| Mobile Home / Other | 0 | 0.0% |
| Total | 67 | 100.0% |
Housing Structures by Occupancy in Pine Level
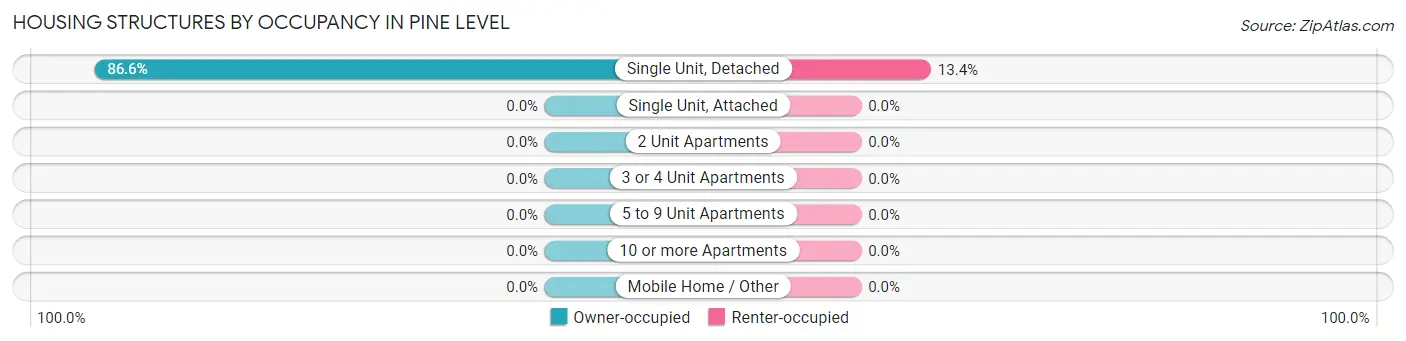
| Structure Type | Owner-occupied | Renter-occupied |
| Single Unit, Detached | 58 (86.6%) | 9 (13.4%) |
| Single Unit, Attached | 0 (0.0%) | 0 (0.0%) |
| 2 Unit Apartments | 0 (0.0%) | 0 (0.0%) |
| 3 or 4 Unit Apartments | 0 (0.0%) | 0 (0.0%) |
| 5 to 9 Unit Apartments | 0 (0.0%) | 0 (0.0%) |
| 10 or more Apartments | 0 (0.0%) | 0 (0.0%) |
| Mobile Home / Other | 0 (0.0%) | 0 (0.0%) |
| Total | 58 (86.6%) | 9 (13.4%) |
Housing Structures by Number of Rooms in Pine Level
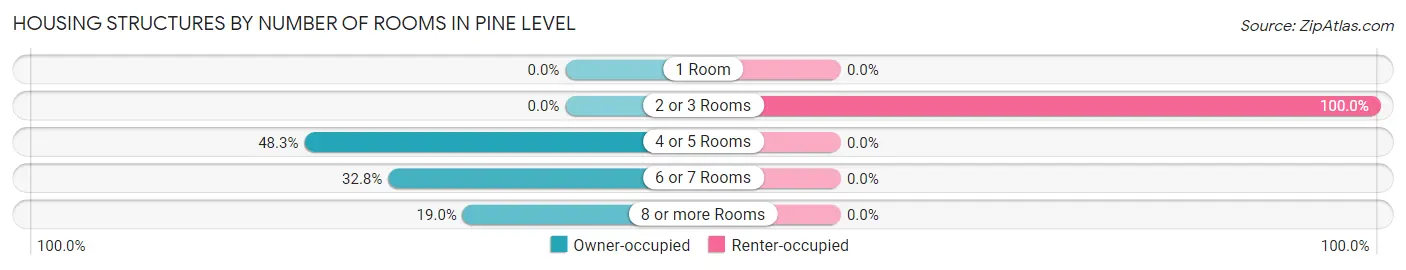
| Number of Rooms | Owner-occupied | Renter-occupied |
| 1 Room | 0 (0.0%) | 0 (0.0%) |
| 2 or 3 Rooms | 0 (0.0%) | 9 (100.0%) |
| 4 or 5 Rooms | 28 (48.3%) | 0 (0.0%) |
| 6 or 7 Rooms | 19 (32.8%) | 0 (0.0%) |
| 8 or more Rooms | 11 (19.0%) | 0 (0.0%) |
| Total | 58 (100.0%) | 9 (100.0%) |
Housing Structure by Heating Type in Pine Level
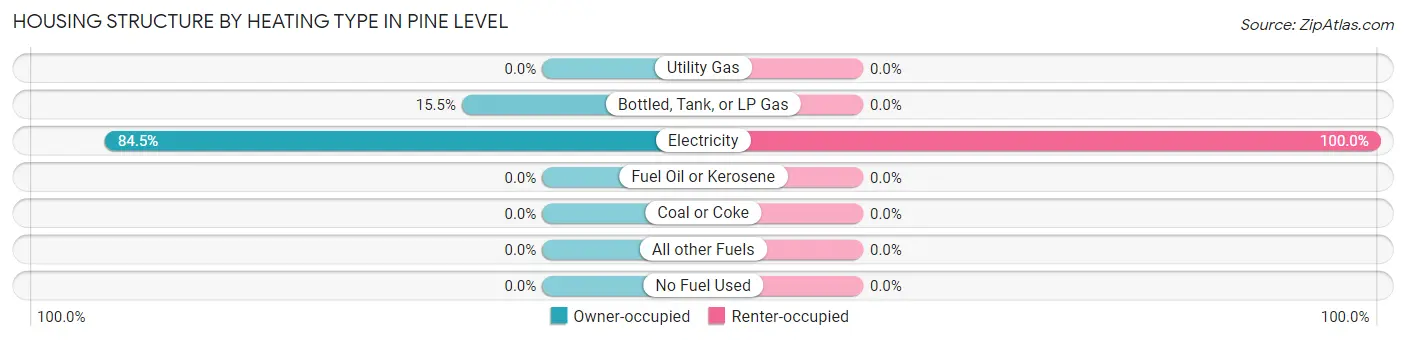
| Heating Type | Owner-occupied | Renter-occupied |
| Utility Gas | 0 (0.0%) | 0 (0.0%) |
| Bottled, Tank, or LP Gas | 9 (15.5%) | 0 (0.0%) |
| Electricity | 49 (84.5%) | 9 (100.0%) |
| Fuel Oil or Kerosene | 0 (0.0%) | 0 (0.0%) |
| Coal or Coke | 0 (0.0%) | 0 (0.0%) |
| All other Fuels | 0 (0.0%) | 0 (0.0%) |
| No Fuel Used | 0 (0.0%) | 0 (0.0%) |
| Total | 58 (100.0%) | 9 (100.0%) |
Household Vehicle Usage in Pine Level
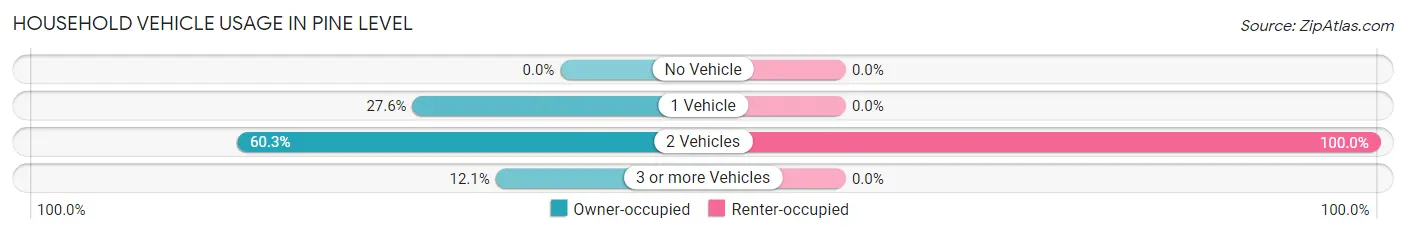
| Vehicles per Household | Owner-occupied | Renter-occupied |
| No Vehicle | 0 (0.0%) | 0 (0.0%) |
| 1 Vehicle | 16 (27.6%) | 0 (0.0%) |
| 2 Vehicles | 35 (60.3%) | 9 (100.0%) |
| 3 or more Vehicles | 7 (12.1%) | 0 (0.0%) |
| Total | 58 (100.0%) | 9 (100.0%) |
Real Estate & Mortgages in Pine Level
Real Estate and Mortgage Overview in Pine Level
| Characteristic | Without Mortgage | With Mortgage |
| Housing Units | 39 | 19 |
| Median Property Value | $183,000 | $0 |
| Median Household Income | $83,229 | $0 |
| Monthly Housing Costs | $488 | $0 |
| Real Estate Taxes | - | - |
Property Value by Mortgage Status in Pine Level
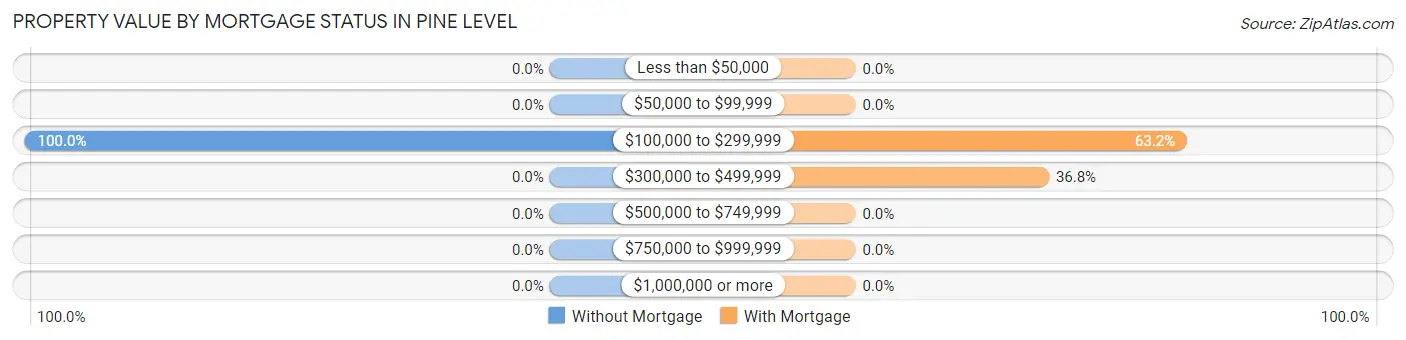
| Property Value | Without Mortgage | With Mortgage |
| Less than $50,000 | 0 (0.0%) | 0 (0.0%) |
| $50,000 to $99,999 | 0 (0.0%) | 0 (0.0%) |
| $100,000 to $299,999 | 39 (100.0%) | 12 (63.2%) |
| $300,000 to $499,999 | 0 (0.0%) | 7 (36.8%) |
| $500,000 to $749,999 | 0 (0.0%) | 0 (0.0%) |
| $750,000 to $999,999 | 0 (0.0%) | 0 (0.0%) |
| $1,000,000 or more | 0 (0.0%) | 0 (0.0%) |
| Total | 39 (100.0%) | 19 (100.0%) |
Household Income by Mortgage Status in Pine Level
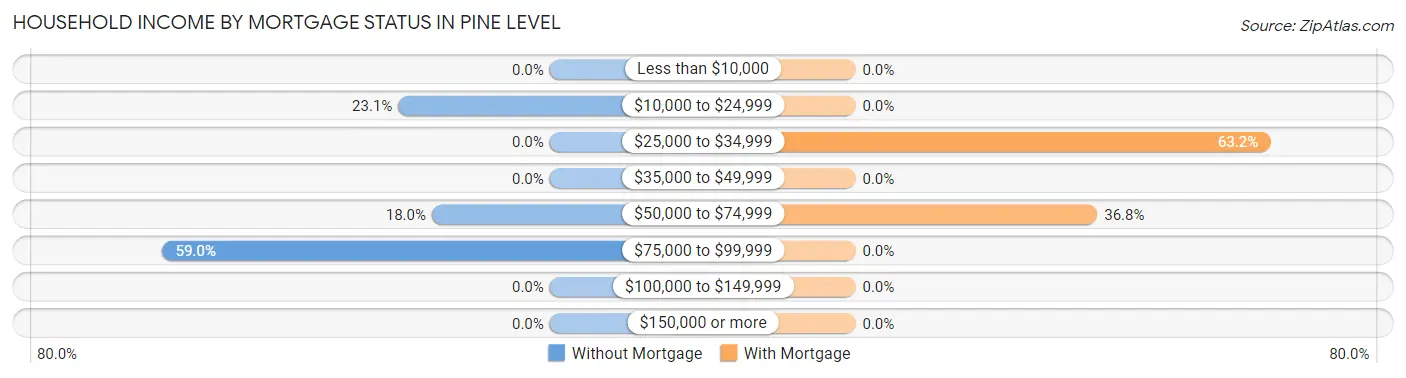
| Household Income | Without Mortgage | With Mortgage |
| Less than $10,000 | 0 (0.0%) | 0 (0.0%) |
| $10,000 to $24,999 | 9 (23.1%) | 0 (0.0%) |
| $25,000 to $34,999 | 0 (0.0%) | 12 (63.2%) |
| $35,000 to $49,999 | 0 (0.0%) | 0 (0.0%) |
| $50,000 to $74,999 | 7 (17.9%) | 7 (36.8%) |
| $75,000 to $99,999 | 23 (59.0%) | 0 (0.0%) |
| $100,000 to $149,999 | 0 (0.0%) | 0 (0.0%) |
| $150,000 or more | 0 (0.0%) | 0 (0.0%) |
| Total | 39 (100.0%) | 19 (100.0%) |
Property Value to Household Income Ratio in Pine Level
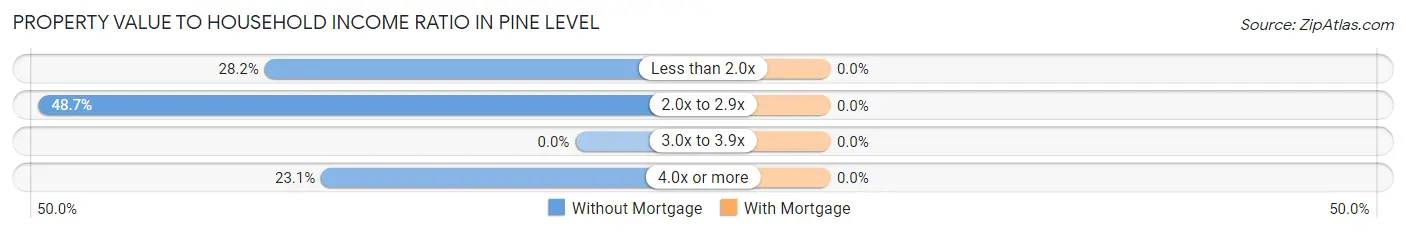
| Value-to-Income Ratio | Without Mortgage | With Mortgage |
| Less than 2.0x | 11 (28.2%) | 0 (0.0%) |
| 2.0x to 2.9x | 19 (48.7%) | 0 (0.0%) |
| 3.0x to 3.9x | 0 (0.0%) | 0 (0.0%) |
| 4.0x or more | 9 (23.1%) | 0 (0.0%) |
| Total | 39 (100.0%) | 19 (100.0%) |
Real Estate Taxes by Mortgage Status in Pine Level
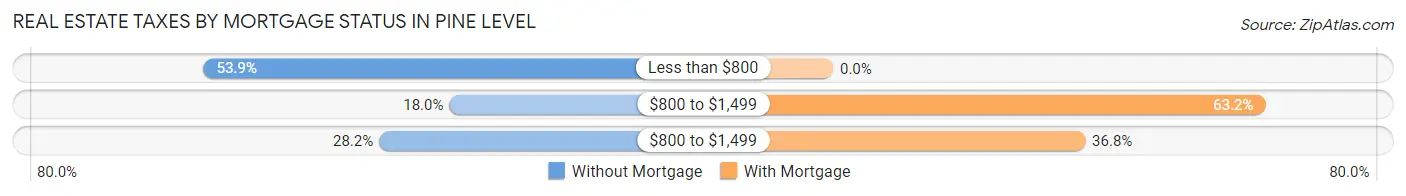
| Property Taxes | Without Mortgage | With Mortgage |
| Less than $800 | 21 (53.8%) | 0 (0.0%) |
| $800 to $1,499 | 7 (17.9%) | 12 (63.2%) |
| $800 to $1,499 | 11 (28.2%) | 7 (36.8%) |
| Total | 39 (100.0%) | 19 (100.0%) |
Health & Disability in Pine Level
Health Insurance Coverage by Age in Pine Level
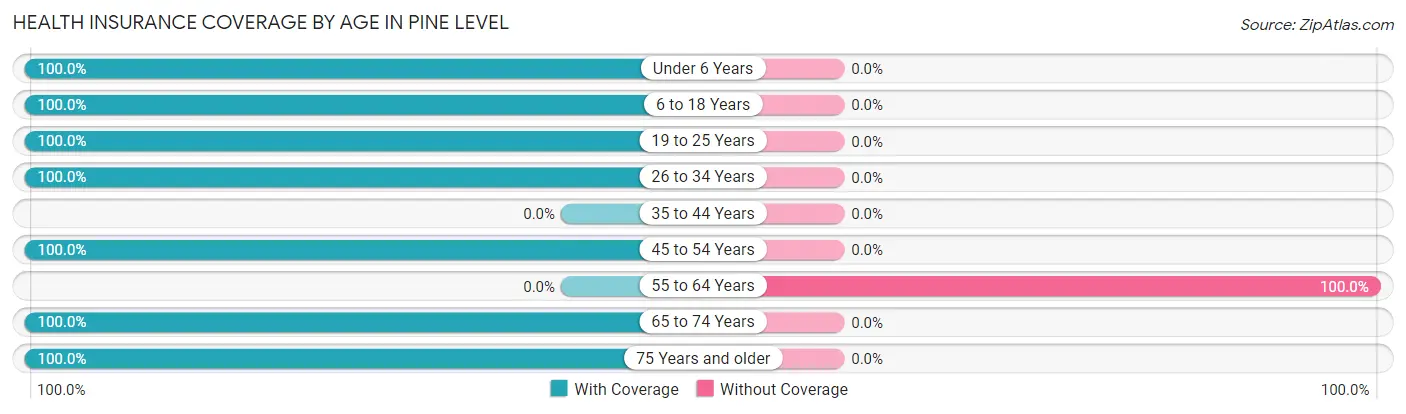
| Age Bracket | With Coverage | Without Coverage |
| Under 6 Years | 21 (100.0%) | 0 (0.0%) |
| 6 to 18 Years | 6 (100.0%) | 0 (0.0%) |
| 19 to 25 Years | 17 (100.0%) | 0 (0.0%) |
| 26 to 34 Years | 28 (100.0%) | 0 (0.0%) |
| 35 to 44 Years | 0 (0.0%) | 0 (0.0%) |
| 45 to 54 Years | 14 (100.0%) | 0 (0.0%) |
| 55 to 64 Years | 0 (0.0%) | 12 (100.0%) |
| 65 to 74 Years | 23 (100.0%) | 0 (0.0%) |
| 75 Years and older | 30 (100.0%) | 0 (0.0%) |
| Total | 139 (92.0%) | 12 (8.0%) |
Health Insurance Coverage by Citizenship Status in Pine Level
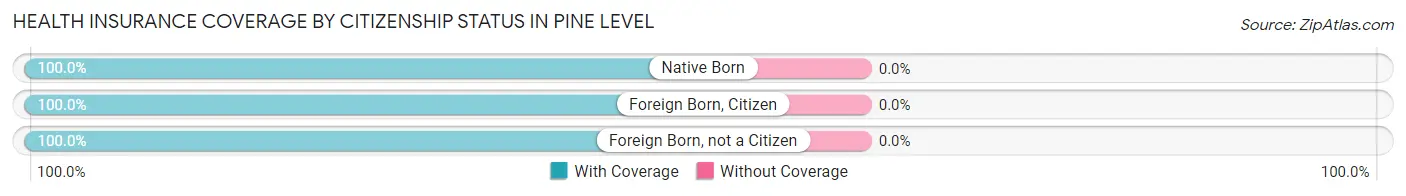
| Citizenship Status | With Coverage | Without Coverage |
| Native Born | 21 (100.0%) | 0 (0.0%) |
| Foreign Born, Citizen | 6 (100.0%) | 0 (0.0%) |
| Foreign Born, not a Citizen | 17 (100.0%) | 0 (0.0%) |
Health Insurance Coverage by Household Income in Pine Level
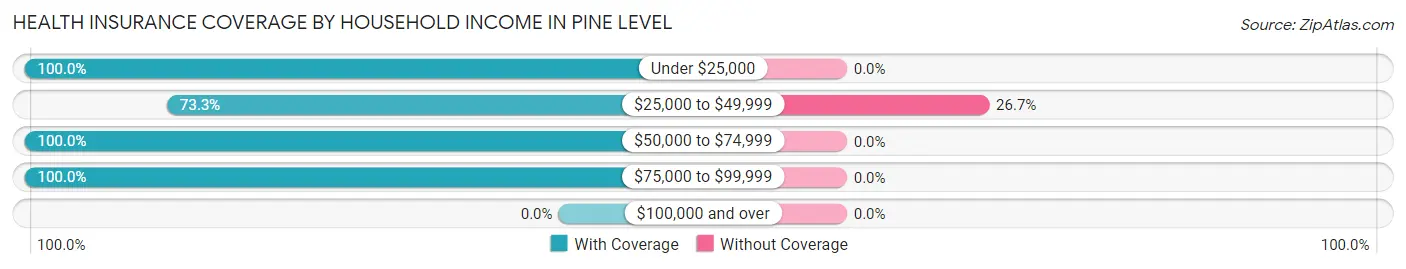
| Household Income | With Coverage | Without Coverage |
| Under $25,000 | 32 (100.0%) | 0 (0.0%) |
| $25,000 to $49,999 | 33 (73.3%) | 12 (26.7%) |
| $50,000 to $74,999 | 20 (100.0%) | 0 (0.0%) |
| $75,000 to $99,999 | 54 (100.0%) | 0 (0.0%) |
| $100,000 and over | 0 (0.0%) | 0 (0.0%) |
Public vs Private Health Insurance Coverage by Age in Pine Level
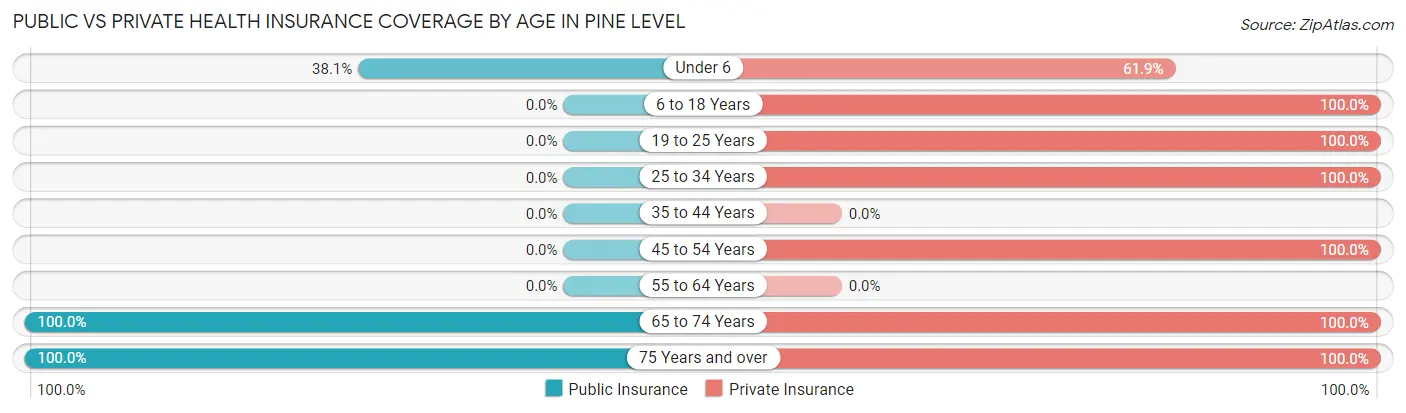
| Age Bracket | Public Insurance | Private Insurance |
| Under 6 | 8 (38.1%) | 13 (61.9%) |
| 6 to 18 Years | 0 (0.0%) | 6 (100.0%) |
| 19 to 25 Years | 0 (0.0%) | 17 (100.0%) |
| 25 to 34 Years | 0 (0.0%) | 28 (100.0%) |
| 35 to 44 Years | 0 (0.0%) | 0 (0.0%) |
| 45 to 54 Years | 0 (0.0%) | 14 (100.0%) |
| 55 to 64 Years | 0 (0.0%) | 0 (0.0%) |
| 65 to 74 Years | 23 (100.0%) | 23 (100.0%) |
| 75 Years and over | 30 (100.0%) | 30 (100.0%) |
| Total | 61 (40.4%) | 131 (86.8%) |
Disability Status by Sex by Age in Pine Level
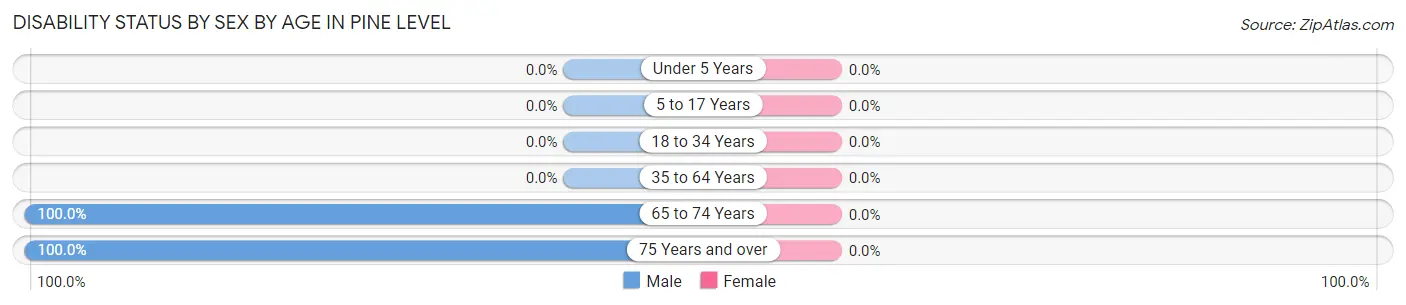
| Age Bracket | Male | Female |
| Under 5 Years | 0 (0.0%) | 0 (0.0%) |
| 5 to 17 Years | 0 (0.0%) | 0 (0.0%) |
| 18 to 34 Years | 0 (0.0%) | 0 (0.0%) |
| 35 to 64 Years | 0 (0.0%) | 0 (0.0%) |
| 65 to 74 Years | 11 (100.0%) | 0 (0.0%) |
| 75 Years and over | 11 (100.0%) | 0 (0.0%) |
Disability Class by Sex by Age in Pine Level
Disability Class: Hearing Difficulty
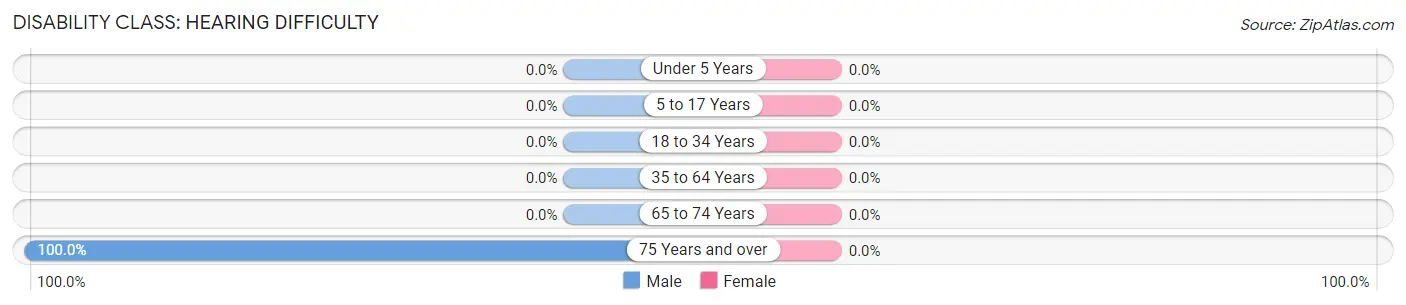
| Age Bracket | Male | Female |
| Under 5 Years | 0 (0.0%) | 0 (0.0%) |
| 5 to 17 Years | 0 (0.0%) | 0 (0.0%) |
| 18 to 34 Years | 0 (0.0%) | 0 (0.0%) |
| 35 to 64 Years | 0 (0.0%) | 0 (0.0%) |
| 65 to 74 Years | 0 (0.0%) | 0 (0.0%) |
| 75 Years and over | 11 (100.0%) | 0 (0.0%) |
Disability Class: Vision Difficulty
| Age Bracket | Male | Female |
| Under 5 Years | 0 (0.0%) | 0 (0.0%) |
| 5 to 17 Years | 0 (0.0%) | 0 (0.0%) |
| 18 to 34 Years | 0 (0.0%) | 0 (0.0%) |
| 35 to 64 Years | 0 (0.0%) | 0 (0.0%) |
| 65 to 74 Years | 0 (0.0%) | 0 (0.0%) |
| 75 Years and over | 0 (0.0%) | 0 (0.0%) |
Disability Class: Cognitive Difficulty
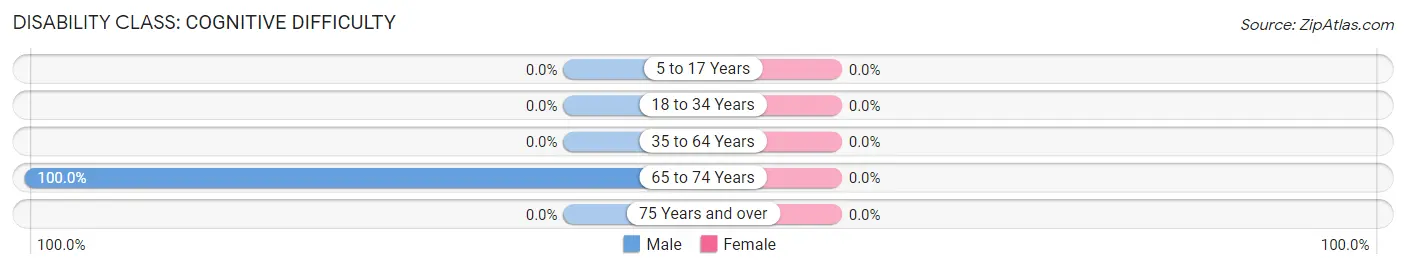
| Age Bracket | Male | Female |
| 5 to 17 Years | 0 (0.0%) | 0 (0.0%) |
| 18 to 34 Years | 0 (0.0%) | 0 (0.0%) |
| 35 to 64 Years | 0 (0.0%) | 0 (0.0%) |
| 65 to 74 Years | 11 (100.0%) | 0 (0.0%) |
| 75 Years and over | 0 (0.0%) | 0 (0.0%) |
Disability Class: Ambulatory Difficulty
| Age Bracket | Male | Female |
| 5 to 17 Years | 0 (0.0%) | 0 (0.0%) |
| 18 to 34 Years | 0 (0.0%) | 0 (0.0%) |
| 35 to 64 Years | 0 (0.0%) | 0 (0.0%) |
| 65 to 74 Years | 0 (0.0%) | 0 (0.0%) |
| 75 Years and over | 0 (0.0%) | 0 (0.0%) |
Disability Class: Self-Care Difficulty
| Age Bracket | Male | Female |
| 5 to 17 Years | 0 (0.0%) | 0 (0.0%) |
| 18 to 34 Years | 0 (0.0%) | 0 (0.0%) |
| 35 to 64 Years | 0 (0.0%) | 0 (0.0%) |
| 65 to 74 Years | 0 (0.0%) | 0 (0.0%) |
| 75 Years and over | 0 (0.0%) | 0 (0.0%) |
Technology Access in Pine Level
Computing Device Access in Pine Level
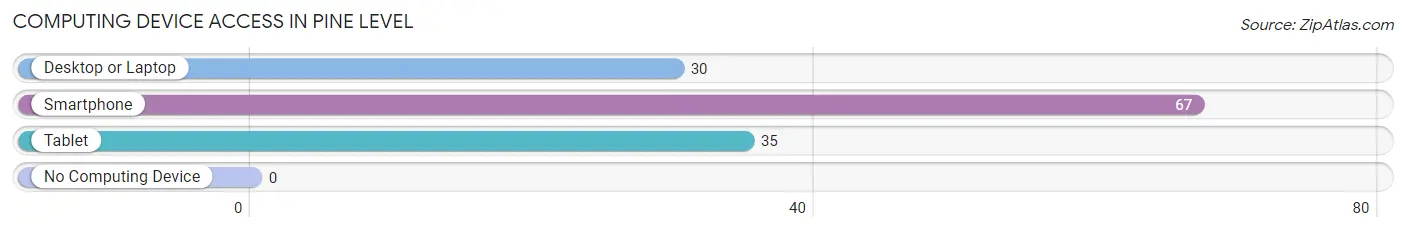
| Device Type | # Households | % Households |
| Desktop or Laptop | 30 | 44.8% |
| Smartphone | 67 | 100.0% |
| Tablet | 35 | 52.2% |
| No Computing Device | 0 | 0.0% |
| Total | 67 | 100.0% |
Internet Access in Pine Level
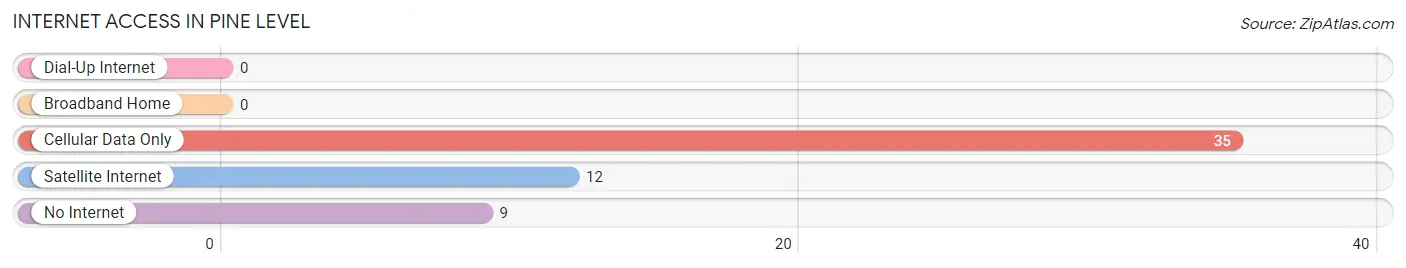
| Internet Type | # Households | % Households |
| Dial-Up Internet | 0 | 0.0% |
| Broadband Home | 0 | 0.0% |
| Cellular Data Only | 35 | 52.2% |
| Satellite Internet | 12 | 17.9% |
| No Internet | 9 | 13.4% |
| Total | 67 | 100.0% |
Pine Level Summary
Pine Level is a small town located in the state of Florida, in the United States. It is situated in the northern part of the state, in the county of Duval. The town has a population of approximately 1,000 people, and is located about 20 miles south of Jacksonville.
History
Pine Level was first settled in the late 1800s by a group of settlers from Georgia. The town was originally known as “Pine Level Station”, and was a stop on the Florida East Coast Railway. The town was officially incorporated in 1891, and was named after the nearby pine trees.
In the early 1900s, the town was a thriving agricultural community, with many of the residents working in the local citrus and vegetable farms. The town also had a sawmill, a grist mill, and a cotton gin.
In the 1950s, the town began to decline as the local farms were replaced by suburban development. The town’s population decreased from 1,500 in 1950 to just over 1,000 in 2000.
Geography
Pine Level is located in the northern part of Duval County, in the state of Florida. The town is situated on the banks of the St. Johns River, and is about 20 miles south of Jacksonville. The town is surrounded by a number of small towns and rural communities, including Orange Park, Middleburg, and Green Cove Springs.
The town has a total area of 1.2 square miles, all of which is land. The town is located at an elevation of about 30 feet above sea level.
Economy
The economy of Pine Level is largely based on agriculture and tourism. The town is home to several farms, which produce a variety of fruits and vegetables. The town also has a number of small businesses, including restaurants, retail stores, and service providers.
The town is also a popular tourist destination, with many visitors coming to enjoy the town’s natural beauty and outdoor activities. The town is home to several parks, including the Pine Level Nature Preserve, which offers hiking, biking, and bird watching.
Demographics
As of the 2010 census, the population of Pine Level was 1,000. The racial makeup of the town was 94.2% White, 2.2% African American, 0.2% Native American, 0.8% Asian, 0.2% from other races, and 2.4% from two or more races. Hispanic or Latino of any race were 1.2% of the population.
The median income for a household in the town was $37,500, and the median income for a family was $45,000. The per capita income for the town was $18,000. About 11.2% of families and 14.2% of the population were below the poverty line, including 18.2% of those under age 18 and 8.2% of those age 65 or over.
Common Questions
What is Per Capita Income in Pine Level?
Per Capita income in Pine Level is $21,826.
What is the Median Family Income in Pine Level?
Median Family Income in Pine Level is $62,857.
What is Inequality or Gini Index in Pine Level?
Inequality or Gini Index in Pine Level is 0.34.
What is the Total Population of Pine Level?
Total Population of Pine Level is 151.
What is the Total Male Population of Pine Level?
Total Male Population of Pine Level is 72.
What is the Total Female Population of Pine Level?
Total Female Population of Pine Level is 79.
What is the Ratio of Males per 100 Females in Pine Level?
There are 91.14 Males per 100 Females in Pine Level.
What is the Ratio of Females per 100 Males in Pine Level?
There are 109.72 Females per 100 Males in Pine Level.
What is the Median Population Age in Pine Level?
Median Population Age in Pine Level is 49.5 Years.
What is the Average Family Size in Pine Level
Average Family Size in Pine Level is 2.5 People.
What is the Average Household Size in Pine Level
Average Household Size in Pine Level is 2.2 People.
How Large is the Labor Force in Pine Level?
There are 58 People in the Labor Forcein in Pine Level.
What is the Percentage of People in the Labor Force in Pine Level?
44.6% of People are in the Labor Force in Pine Level.