Mount Carmel, FL Map & Demographics
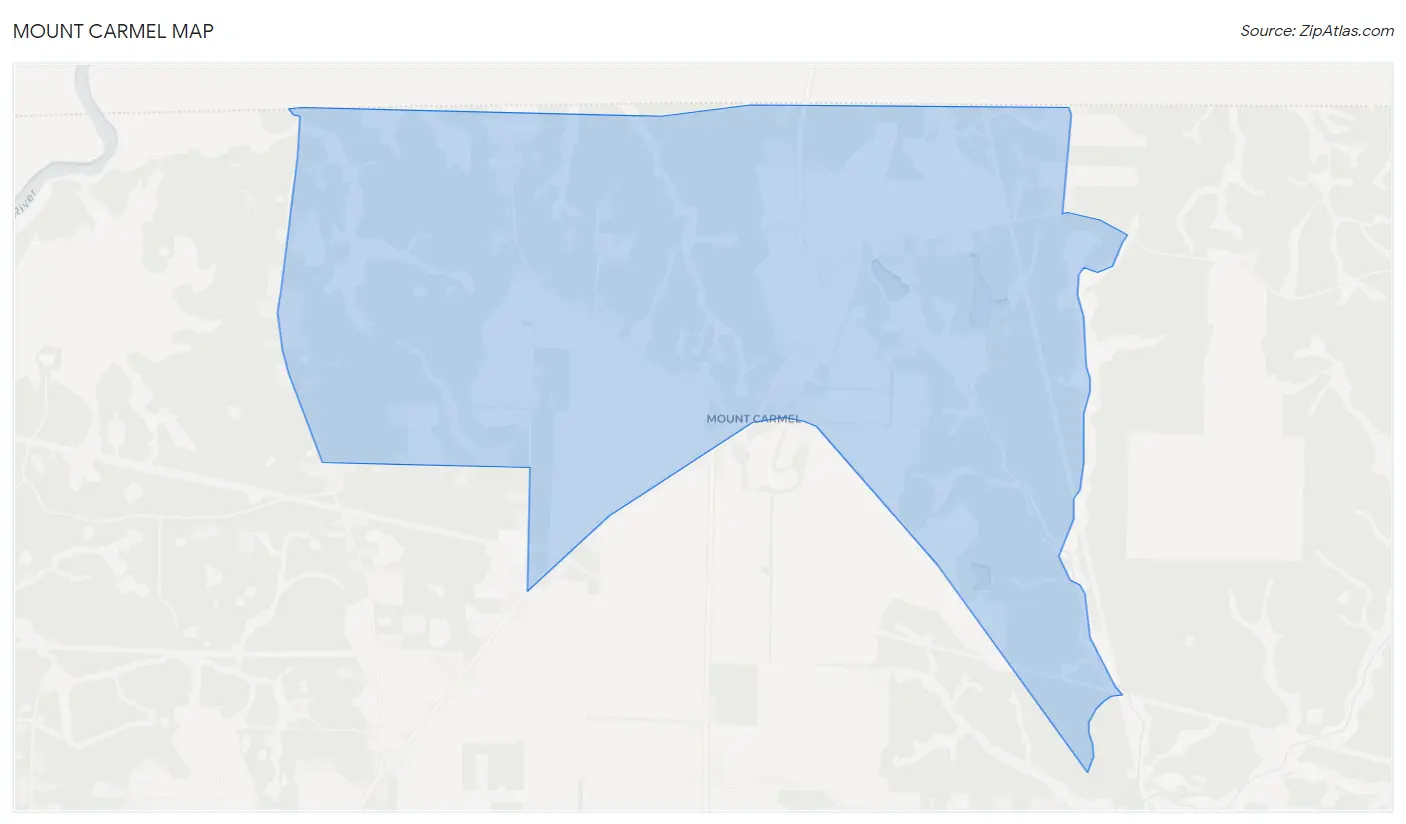
Mount Carmel Map
Mount Carmel Overview
$52,823
PER CAPITA INCOME
$178,611
AVG FAMILY INCOME
0.6%
WAGE / INCOME GAP [ % ]
99.4¢/ $1
WAGE / INCOME GAP [ $ ]
0.34
INEQUALITY / GINI INDEX
207
TOTAL POPULATION
91
MALE POPULATION
116
FEMALE POPULATION
78.45
MALES / 100 FEMALES
127.47
FEMALES / 100 MALES
55.4
MEDIAN AGE
3.1
AVG FAMILY SIZE
2.2
AVG HOUSEHOLD SIZE
119
LABOR FORCE [ PEOPLE ]
70.0%
PERCENT IN LABOR FORCE
Income in Mount Carmel
Income Overview in Mount Carmel
| Characteristic | Number | Measure |
| Per Capita Income | 207 | $52,823 |
| Median Family Income | 52 | $178,611 |
| Mean Family Income | 52 | $171,527 |
| Median Household Income | 95 | $0 |
| Mean Household Income | 95 | $111,100 |
| Income Deficit | 52 | $0 |
| Wage / Income Gap (%) | 207 | 0.58% |
| Wage / Income Gap ($) | 207 | 99.42¢ per $1 |
| Gini / Inequality Index | 207 | 0.34 |
Earnings by Sex in Mount Carmel
Average Earnings in Mount Carmel are $83,090, $83,333 for men and $82,847 for women, a difference of 0.6%.
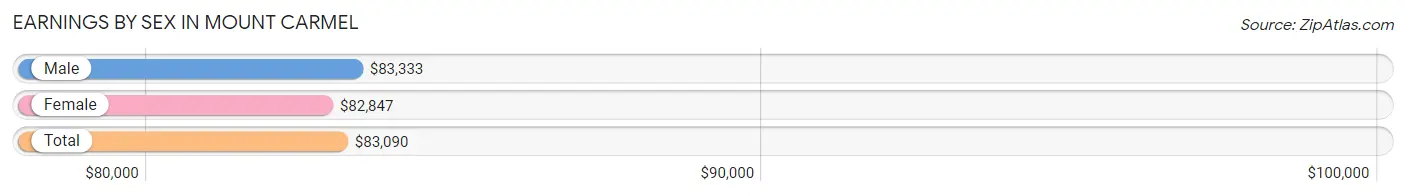
| Sex | Number | Average Earnings |
| Male | 64 (50.4%) | $83,333 |
| Female | 63 (49.6%) | $82,847 |
| Total | 127 (100.0%) | $83,090 |
Earnings by Sex by Income Bracket in Mount Carmel
The most common earnings brackets in Mount Carmel are $75,000 to $99,999 for men (36 | 56.2%) and $75,000 to $99,999 for women (18 | 28.6%).
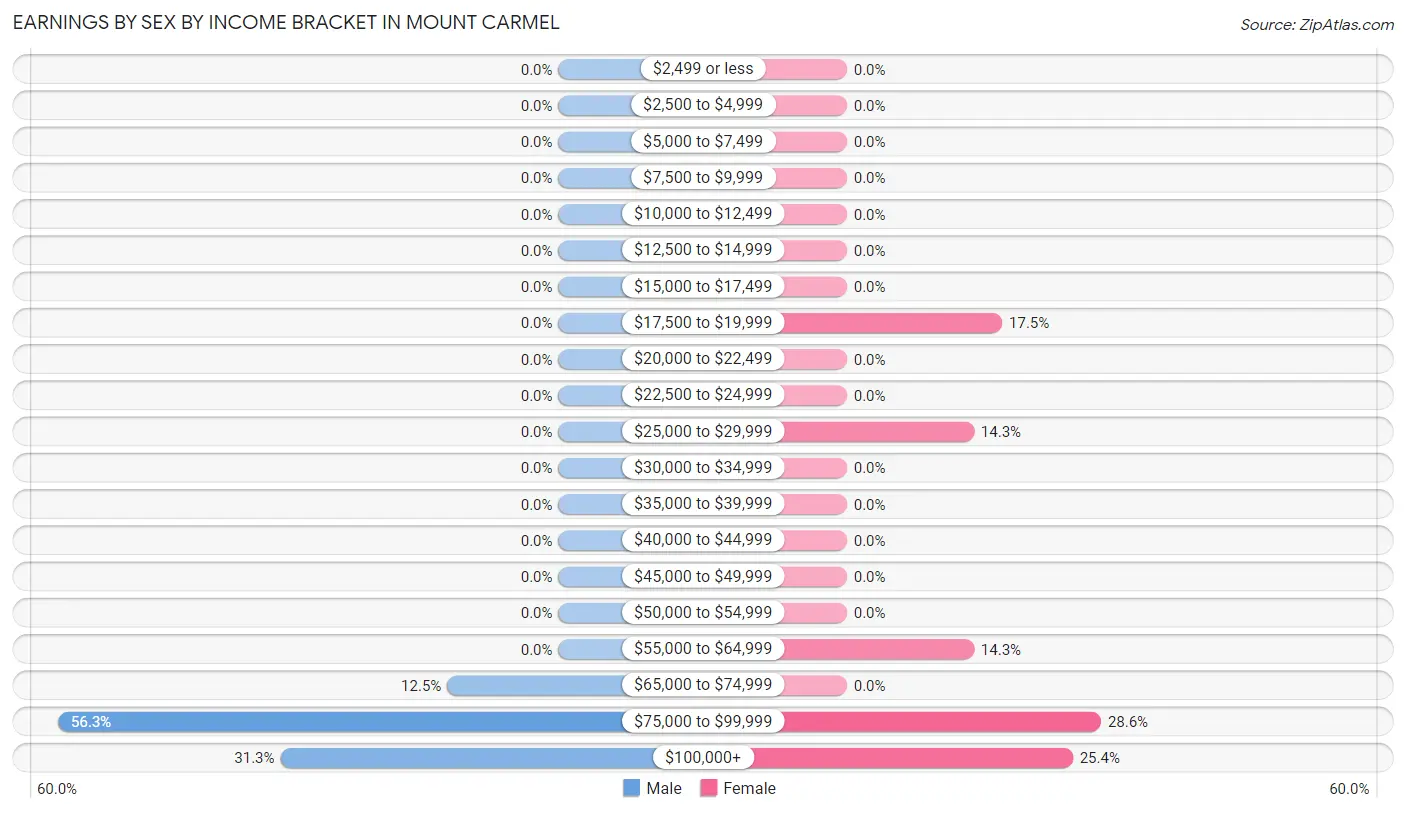
| Income | Male | Female |
| $2,499 or less | 0 (0.0%) | 0 (0.0%) |
| $2,500 to $4,999 | 0 (0.0%) | 0 (0.0%) |
| $5,000 to $7,499 | 0 (0.0%) | 0 (0.0%) |
| $7,500 to $9,999 | 0 (0.0%) | 0 (0.0%) |
| $10,000 to $12,499 | 0 (0.0%) | 0 (0.0%) |
| $12,500 to $14,999 | 0 (0.0%) | 0 (0.0%) |
| $15,000 to $17,499 | 0 (0.0%) | 0 (0.0%) |
| $17,500 to $19,999 | 0 (0.0%) | 11 (17.5%) |
| $20,000 to $22,499 | 0 (0.0%) | 0 (0.0%) |
| $22,500 to $24,999 | 0 (0.0%) | 0 (0.0%) |
| $25,000 to $29,999 | 0 (0.0%) | 9 (14.3%) |
| $30,000 to $34,999 | 0 (0.0%) | 0 (0.0%) |
| $35,000 to $39,999 | 0 (0.0%) | 0 (0.0%) |
| $40,000 to $44,999 | 0 (0.0%) | 0 (0.0%) |
| $45,000 to $49,999 | 0 (0.0%) | 0 (0.0%) |
| $50,000 to $54,999 | 0 (0.0%) | 0 (0.0%) |
| $55,000 to $64,999 | 0 (0.0%) | 9 (14.3%) |
| $65,000 to $74,999 | 8 (12.5%) | 0 (0.0%) |
| $75,000 to $99,999 | 36 (56.2%) | 18 (28.6%) |
| $100,000+ | 20 (31.2%) | 16 (25.4%) |
| Total | 64 (100.0%) | 63 (100.0%) |
Earnings by Sex by Educational Attainment in Mount Carmel
| Educational Attainment | Male Income | Female Income |
| Less than High School | - | - |
| High School Diploma | - | - |
| College or Associate's Degree | - | - |
| Bachelor's Degree | - | - |
| Graduate Degree | - | - |
| Total | $83,333 | $82,847 |
Family Income in Mount Carmel
Family Income Brackets in Mount Carmel
According to the Mount Carmel family income data, there are 43 families falling into the $150,000 to $199,999 income range, which is the most common income bracket and makes up 82.7% of all families.
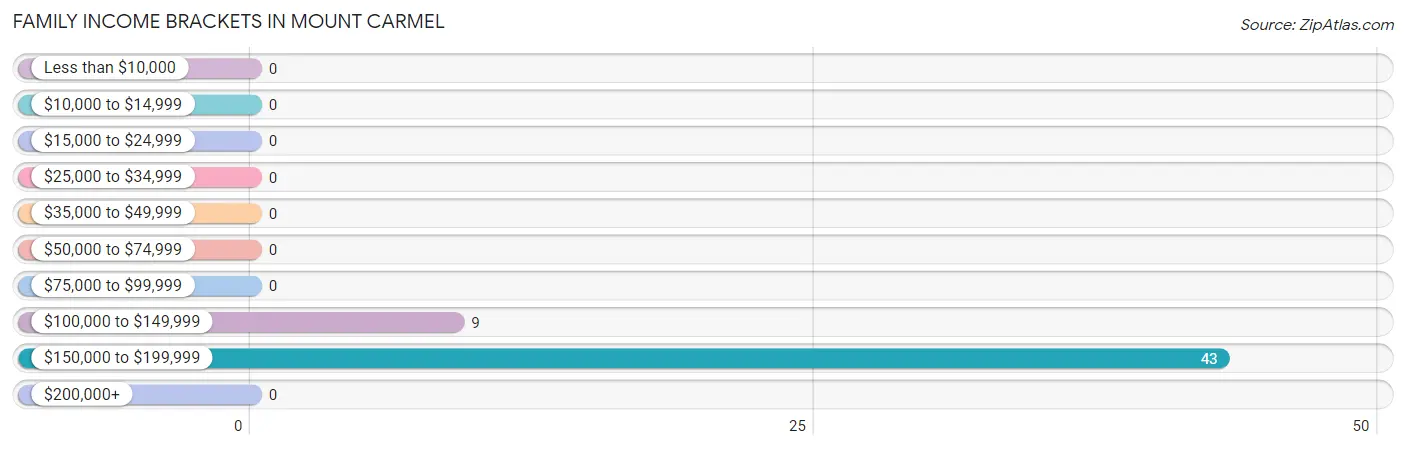
| Income Bracket | # Families | % Families |
| Less than $10,000 | 0 | 0.0% |
| $10,000 to $14,999 | 0 | 0.0% |
| $15,000 to $24,999 | 0 | 0.0% |
| $25,000 to $34,999 | 0 | 0.0% |
| $35,000 to $49,999 | 0 | 0.0% |
| $50,000 to $74,999 | 0 | 0.0% |
| $75,000 to $99,999 | 0 | 0.0% |
| $100,000 to $149,999 | 9 | 17.3% |
| $150,000 to $199,999 | 43 | 82.7% |
| $200,000+ | 0 | 0.0% |
Family Income by Famaliy Size in Mount Carmel
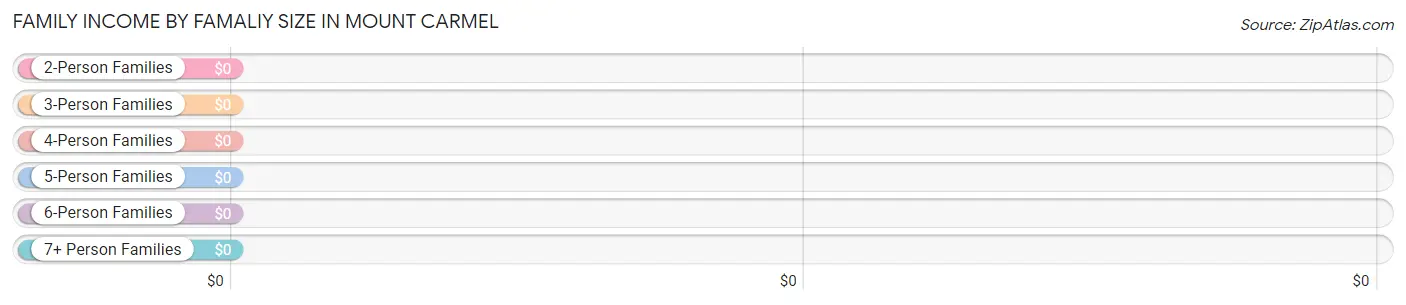
| Income Bracket | # Families | Median Income |
| 2-Person Families | 18 (34.6%) | $0 |
| 3-Person Families | 16 (30.8%) | $0 |
| 4-Person Families | 18 (34.6%) | $0 |
| 5-Person Families | 0 (0.0%) | $0 |
| 6-Person Families | 0 (0.0%) | $0 |
| 7+ Person Families | 0 (0.0%) | $0 |
| Total | 52 (100.0%) | $178,611 |
Family Income by Number of Earners in Mount Carmel
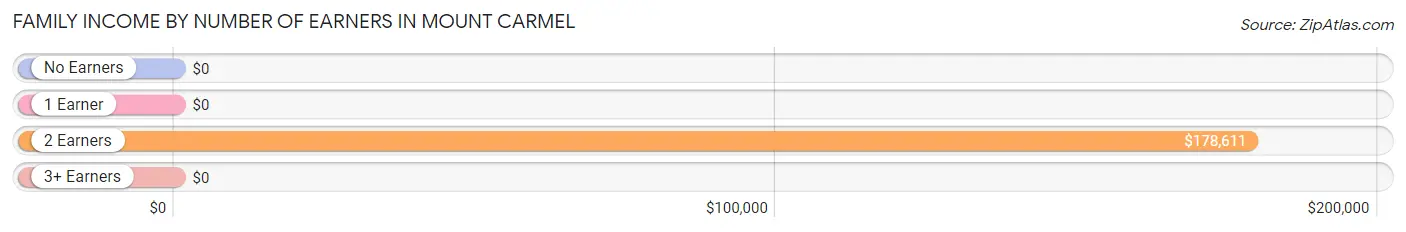
| Number of Earners | # Families | Median Income |
| No Earners | 0 (0.0%) | $0 |
| 1 Earner | 0 (0.0%) | $0 |
| 2 Earners | 52 (100.0%) | $178,611 |
| 3+ Earners | 0 (0.0%) | $0 |
| Total | 52 (100.0%) | $178,611 |
Household Income in Mount Carmel
Household Income Brackets in Mount Carmel
With 43 households falling in the category, the $150,000 to $199,999 income range is the most frequent in Mount Carmel, accounting for 45.3% of all households.
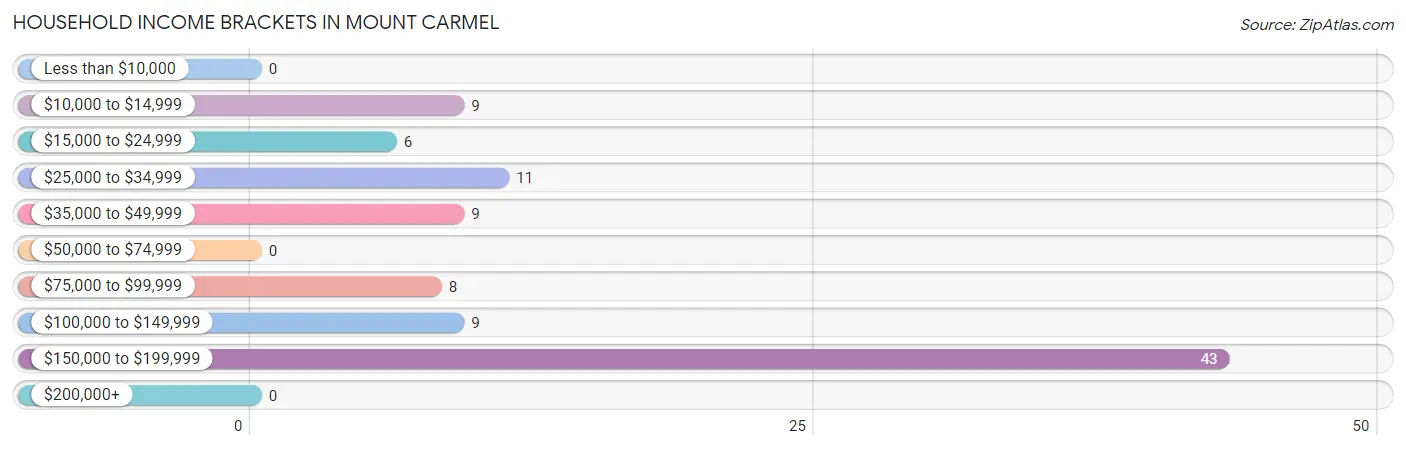
| Income Bracket | # Households | % Households |
| Less than $10,000 | 0 | 0.0% |
| $10,000 to $14,999 | 9 | 9.5% |
| $15,000 to $24,999 | 6 | 6.3% |
| $25,000 to $34,999 | 11 | 11.6% |
| $35,000 to $49,999 | 9 | 9.5% |
| $50,000 to $74,999 | 0 | 0.0% |
| $75,000 to $99,999 | 8 | 8.4% |
| $100,000 to $149,999 | 9 | 9.5% |
| $150,000 to $199,999 | 43 | 45.3% |
| $200,000+ | 0 | 0.0% |
Household Income by Householder Age in Mount Carmel
The median household income in Mount Carmel is $0, with the highest median household income of $158,611 found in the 45 to 64 years age bracket for the primary householder. A total of 78 households (82.1%) fall into this category.
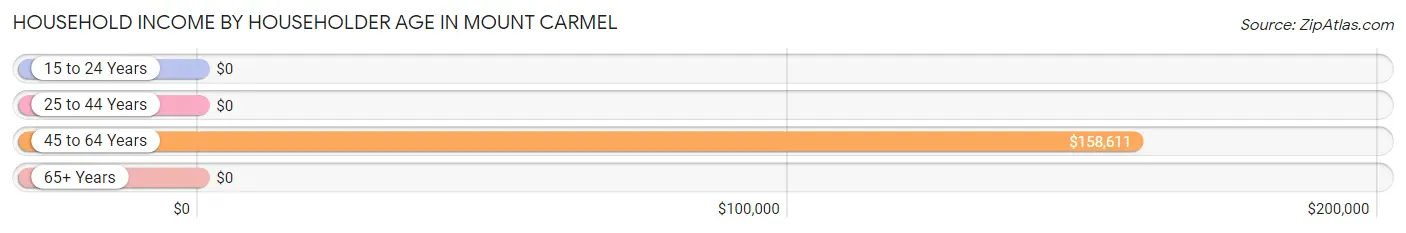
| Income Bracket | # Households | Median Income |
| 15 to 24 Years | 0 (0.0%) | $0 |
| 25 to 44 Years | 0 (0.0%) | $0 |
| 45 to 64 Years | 78 (82.1%) | $158,611 |
| 65+ Years | 17 (17.9%) | $0 |
| Total | 95 (100.0%) | $0 |
Poverty in Mount Carmel
Income Below Poverty by Sex and Age in Mount Carmel
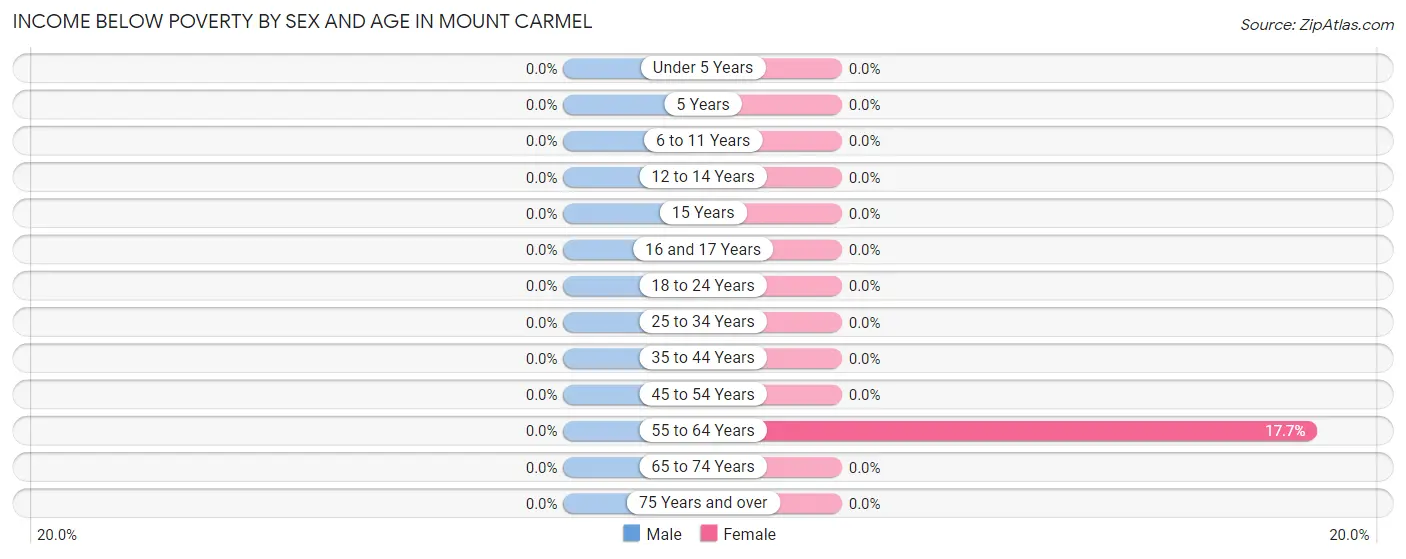
| Age Bracket | Male | Female |
| Under 5 Years | 0 (0.0%) | 0 (0.0%) |
| 5 Years | 0 (0.0%) | 0 (0.0%) |
| 6 to 11 Years | 0 (0.0%) | 0 (0.0%) |
| 12 to 14 Years | 0 (0.0%) | 0 (0.0%) |
| 15 Years | 0 (0.0%) | 0 (0.0%) |
| 16 and 17 Years | 0 (0.0%) | 0 (0.0%) |
| 18 to 24 Years | 0 (0.0%) | 0 (0.0%) |
| 25 to 34 Years | 0 (0.0%) | 0 (0.0%) |
| 35 to 44 Years | 0 (0.0%) | 0 (0.0%) |
| 45 to 54 Years | 0 (0.0%) | 0 (0.0%) |
| 55 to 64 Years | 0 (0.0%) | 9 (17.6%) |
| 65 to 74 Years | 0 (0.0%) | 0 (0.0%) |
| 75 Years and over | 0 (0.0%) | 0 (0.0%) |
| Total | 0 (0.0%) | 9 (7.8%) |
Income Above Poverty by Sex and Age in Mount Carmel
According to the poverty statistics in Mount Carmel, males aged 12 to 14 years and females aged 15 years are the age groups that are most secure financially, with 100.0% of males and 100.0% of females in these age groups living above the poverty line.
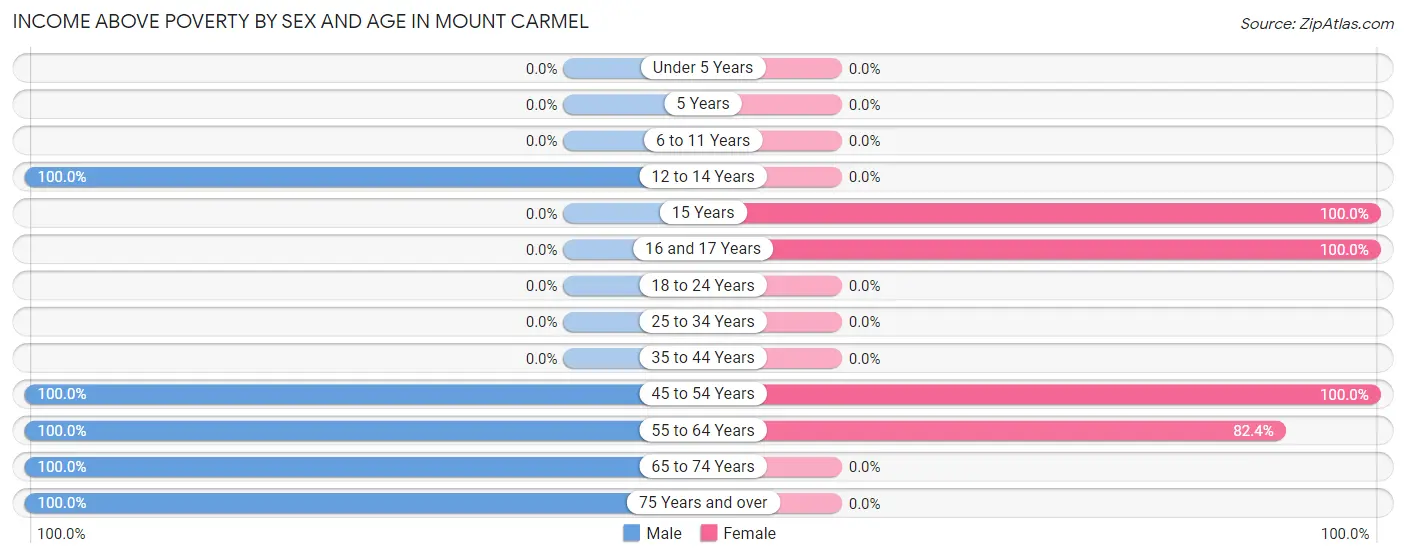
| Age Bracket | Male | Female |
| Under 5 Years | 0 (0.0%) | 0 (0.0%) |
| 5 Years | 0 (0.0%) | 0 (0.0%) |
| 6 to 11 Years | 0 (0.0%) | 0 (0.0%) |
| 12 to 14 Years | 18 (100.0%) | 0 (0.0%) |
| 15 Years | 0 (0.0%) | 19 (100.0%) |
| 16 and 17 Years | 0 (0.0%) | 19 (100.0%) |
| 18 to 24 Years | 0 (0.0%) | 0 (0.0%) |
| 25 to 34 Years | 0 (0.0%) | 0 (0.0%) |
| 35 to 44 Years | 0 (0.0%) | 0 (0.0%) |
| 45 to 54 Years | 18 (100.0%) | 27 (100.0%) |
| 55 to 64 Years | 38 (100.0%) | 42 (82.4%) |
| 65 to 74 Years | 8 (100.0%) | 0 (0.0%) |
| 75 Years and over | 9 (100.0%) | 0 (0.0%) |
| Total | 91 (100.0%) | 107 (92.2%) |
Income Below Poverty Among Married-Couple Families in Mount Carmel
| Children | Above Poverty | Below Poverty |
| No Children | 18 (100.0%) | 0 (0.0%) |
| 1 or 2 Children | 34 (100.0%) | 0 (0.0%) |
| 3 or 4 Children | 0 (0.0%) | 0 (0.0%) |
| 5 or more Children | 0 (0.0%) | 0 (0.0%) |
| Total | 52 (100.0%) | 0 (0.0%) |
Income Below Poverty Among Single-Parent Households in Mount Carmel
| Children | Single Father | Single Mother |
| No Children | 0 (0.0%) | 0 (0.0%) |
| 1 or 2 Children | 0 (0.0%) | 0 (0.0%) |
| 3 or 4 Children | 0 (0.0%) | 0 (0.0%) |
| 5 or more Children | 0 (0.0%) | 0 (0.0%) |
| Total | 0 (0.0%) | 0 (0.0%) |
Income Below Poverty Among Married-Couple vs Single-Parent Households in Mount Carmel
| Children | Married-Couple Families | Single-Parent Households |
| No Children | 0 (0.0%) | 0 (0.0%) |
| 1 or 2 Children | 0 (0.0%) | 0 (0.0%) |
| 3 or 4 Children | 0 (0.0%) | 0 (0.0%) |
| 5 or more Children | 0 (0.0%) | 0 (0.0%) |
| Total | 0 (0.0%) | 0 (0.0%) |
Race in Mount Carmel
The most populous races in Mount Carmel are , and White / Caucasian (207 | 100.0%).
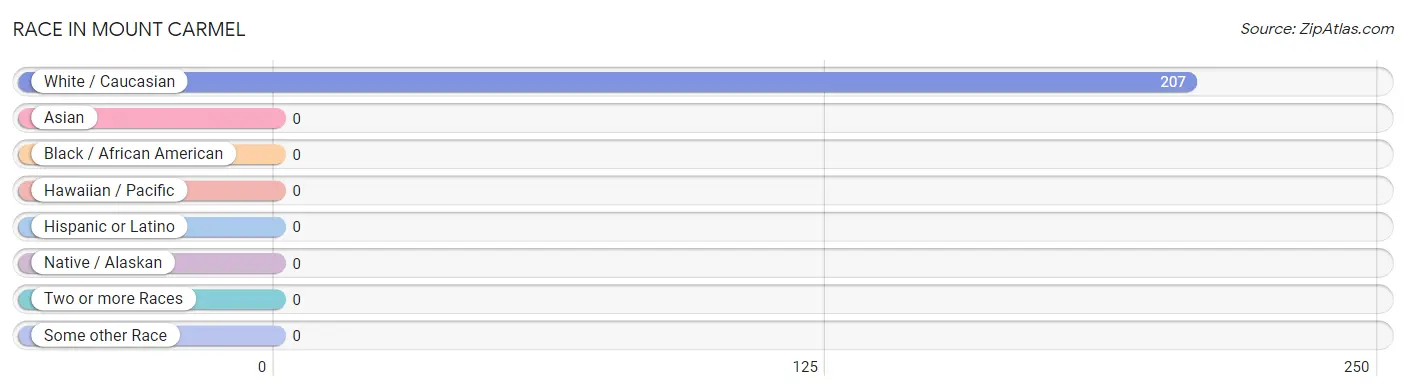
| Race | # Population | % Population |
| Asian | 0 | 0.0% |
| Black / African American | 0 | 0.0% |
| Hawaiian / Pacific | 0 | 0.0% |
| Hispanic or Latino | 0 | 0.0% |
| Native / Alaskan | 0 | 0.0% |
| White / Caucasian | 207 | 100.0% |
| Two or more Races | 0 | 0.0% |
| Some other Race | 0 | 0.0% |
| Total | 207 | 100.0% |
Ancestry in Mount Carmel
The most populous ancestries reported in Mount Carmel are American (63 | 30.4%), Dutch (18 | 8.7%), Irish (18 | 8.7%), Scottish (11 | 5.3%), and English (9 | 4.3%), together accounting for 57.5% of all Mount Carmel residents.
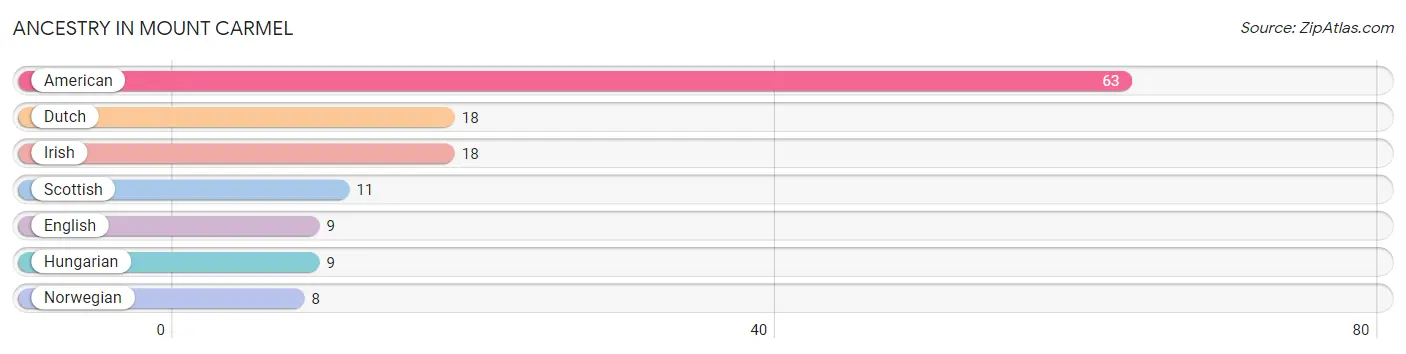
| Ancestry | # Population | % Population |
| American | 63 | 30.4% |
| Dutch | 18 | 8.7% |
| English | 9 | 4.3% |
| Hungarian | 9 | 4.3% |
| Irish | 18 | 8.7% |
| Norwegian | 8 | 3.9% |
| Scottish | 11 | 5.3% | View All 7 Rows |
Immigrants in Mount Carmel

| Immigration Origin | # Population | % Population | View All 0 Rows |
Sex and Age in Mount Carmel
Sex and Age in Mount Carmel
The most populous age groups in Mount Carmel are 55 to 59 Years (27 | 29.7%) for men and 15 to 19 Years (38 | 32.8%) for women.
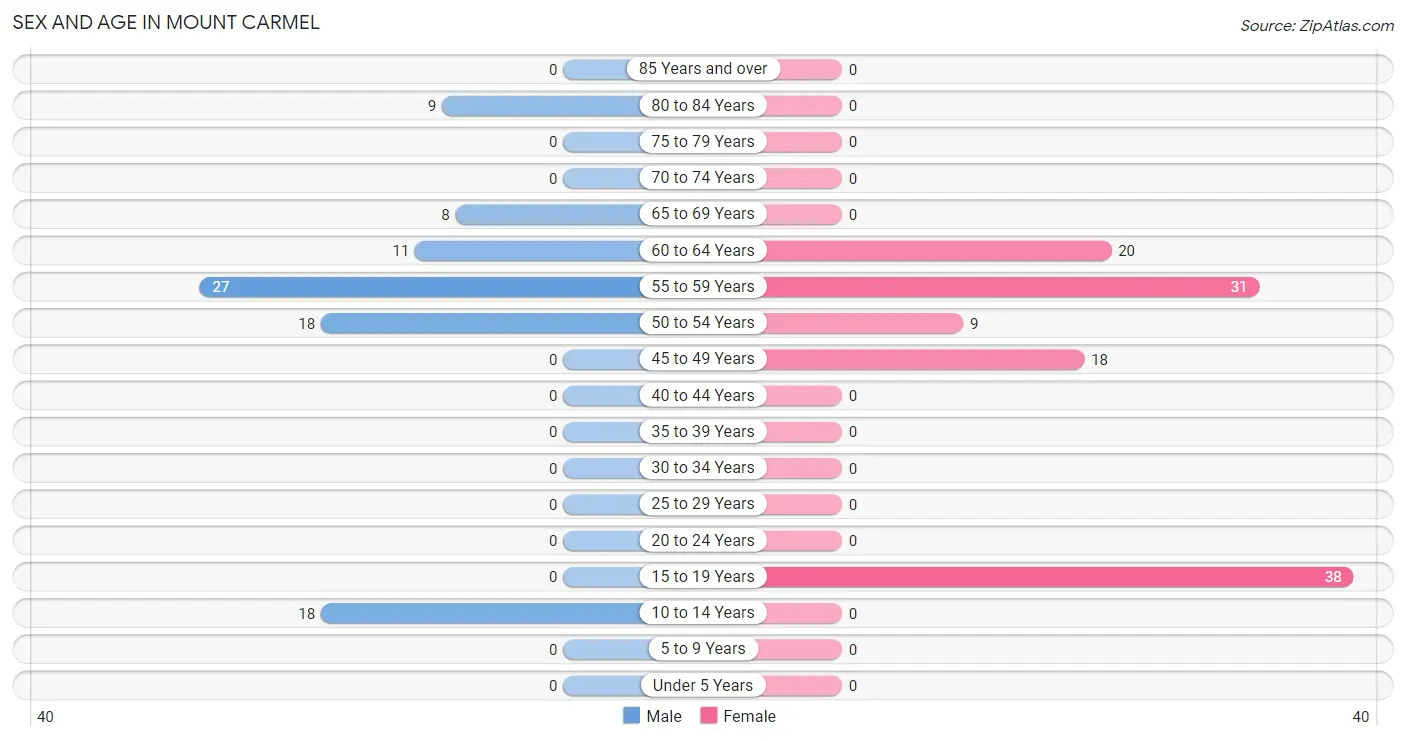
| Age Bracket | Male | Female |
| Under 5 Years | 0 (0.0%) | 0 (0.0%) |
| 5 to 9 Years | 0 (0.0%) | 0 (0.0%) |
| 10 to 14 Years | 18 (19.8%) | 0 (0.0%) |
| 15 to 19 Years | 0 (0.0%) | 38 (32.8%) |
| 20 to 24 Years | 0 (0.0%) | 0 (0.0%) |
| 25 to 29 Years | 0 (0.0%) | 0 (0.0%) |
| 30 to 34 Years | 0 (0.0%) | 0 (0.0%) |
| 35 to 39 Years | 0 (0.0%) | 0 (0.0%) |
| 40 to 44 Years | 0 (0.0%) | 0 (0.0%) |
| 45 to 49 Years | 0 (0.0%) | 18 (15.5%) |
| 50 to 54 Years | 18 (19.8%) | 9 (7.8%) |
| 55 to 59 Years | 27 (29.7%) | 31 (26.7%) |
| 60 to 64 Years | 11 (12.1%) | 20 (17.2%) |
| 65 to 69 Years | 8 (8.8%) | 0 (0.0%) |
| 70 to 74 Years | 0 (0.0%) | 0 (0.0%) |
| 75 to 79 Years | 0 (0.0%) | 0 (0.0%) |
| 80 to 84 Years | 9 (9.9%) | 0 (0.0%) |
| 85 Years and over | 0 (0.0%) | 0 (0.0%) |
| Total | 91 (100.0%) | 116 (100.0%) |
Families and Households in Mount Carmel
Median Family Size in Mount Carmel
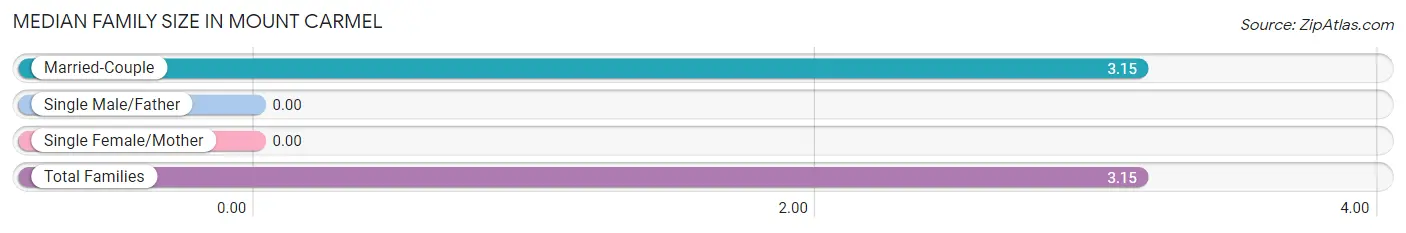
| Family Type | # Families | Family Size |
| Married-Couple | 52 (100.0%) | 3.15 |
| Single Male/Father | 0 (0.0%) | - |
| Single Female/Mother | 0 (0.0%) | - |
| Total Families | 52 (100.0%) | 3.15 |
Median Household Size in Mount Carmel
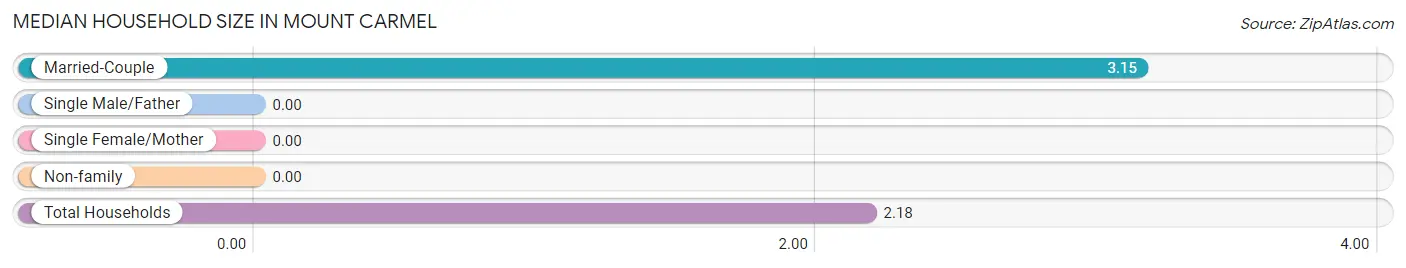
| Household Type | # Households | Household Size |
| Married-Couple | 52 (54.7%) | 3.15 |
| Single Male/Father | 0 (0.0%) | - |
| Single Female/Mother | 0 (0.0%) | - |
| Non-family | 43 (45.3%) | - |
| Total Households | 95 (100.0%) | 2.18 |
Household Size by Marriage Status in Mount Carmel
Out of a total of 95 households in Mount Carmel, 52 (54.7%) are family households, while 43 (45.3%) are nonfamily households. The most numerous type of family households are 2-person households, comprising 18, and the most common type of nonfamily households are 1-person households, comprising 43.
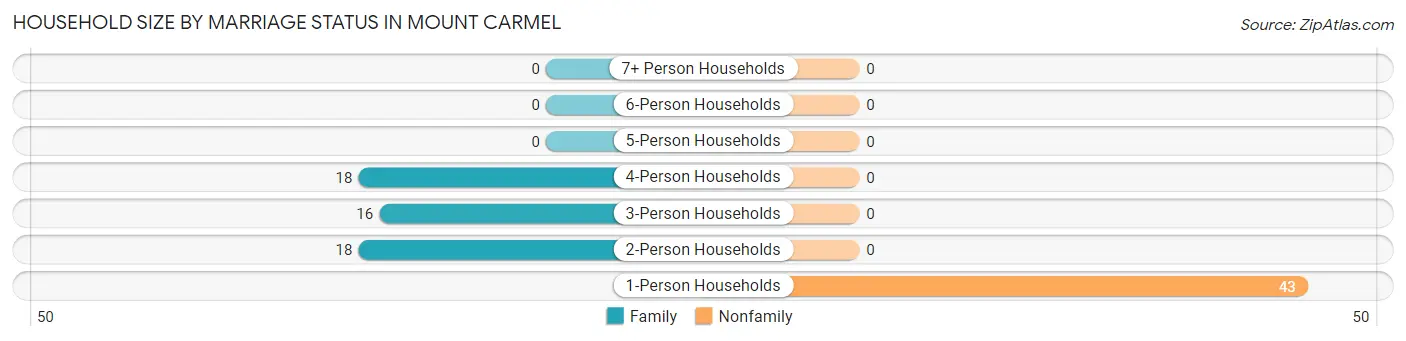
| Household Size | Family Households | Nonfamily Households |
| 1-Person Households | - | 43 (45.3%) |
| 2-Person Households | 18 (19.0%) | 0 (0.0%) |
| 3-Person Households | 16 (16.8%) | 0 (0.0%) |
| 4-Person Households | 18 (19.0%) | 0 (0.0%) |
| 5-Person Households | 0 (0.0%) | 0 (0.0%) |
| 6-Person Households | 0 (0.0%) | 0 (0.0%) |
| 7+ Person Households | 0 (0.0%) | 0 (0.0%) |
| Total | 52 (54.7%) | 43 (45.3%) |
Female Fertility in Mount Carmel
Fertility by Age in Mount Carmel
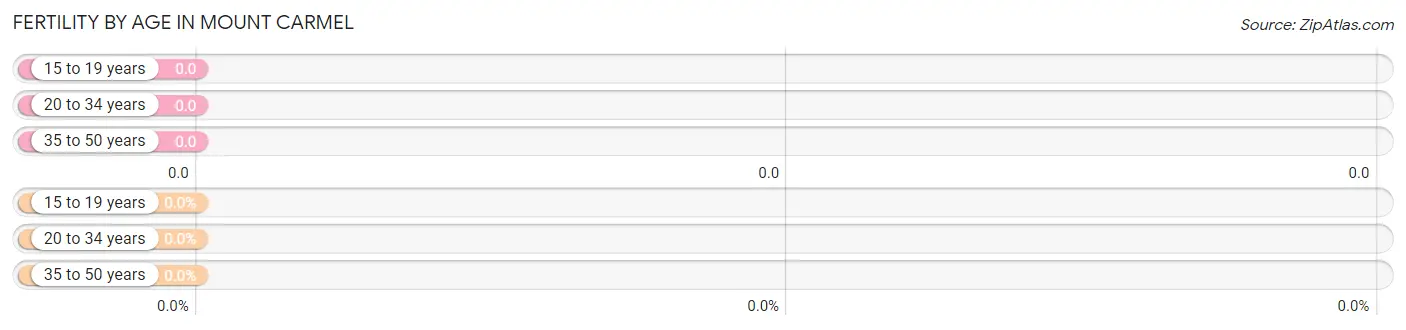
| Age Bracket | Women with Births | Births / 1,000 Women |
| 15 to 19 years | 0 (0.0%) | 0.0 |
| 20 to 34 years | 0 (0.0%) | 0.0 |
| 35 to 50 years | 0 (0.0%) | 0.0 |
| Total | 0 (0.0%) | 0.0 |
Fertility by Age by Marriage Status in Mount Carmel
| Age Bracket | Married | Unmarried |
| 15 to 19 years | 0 (0.0%) | 0 (0.0%) |
| 20 to 34 years | 0 (0.0%) | 0 (0.0%) |
| 35 to 50 years | 0 (0.0%) | 0 (0.0%) |
| Total | 0 (0.0%) | 0 (0.0%) |
Fertility by Education in Mount Carmel
| Educational Attainment | Women with Births | Births / 1,000 Women |
| Less than High School | 0 (0.0%) | 0.0 |
| High School Diploma | 0 (0.0%) | 0.0 |
| College or Associate's Degree | 0 (0.0%) | 0.0 |
| Bachelor's Degree | 0 (0.0%) | 0.0 |
| Graduate Degree | 0 (0.0%) | 0.0 |
| Total | 0 (0.0%) | 0.0 |
Fertility by Education by Marriage Status in Mount Carmel
| Educational Attainment | Married | Unmarried |
| Less than High School | 0 (0.0%) | 0 (0.0%) |
| High School Diploma | 0 (0.0%) | 0 (0.0%) |
| College or Associate's Degree | 0 (0.0%) | 0 (0.0%) |
| Bachelor's Degree | 0 (0.0%) | 0 (0.0%) |
| Graduate Degree | 0 (0.0%) | 0 (0.0%) |
| Total | 0 (0.0%) | 0 (0.0%) |
Employment Characteristics in Mount Carmel
Employment by Class of Employer in Mount Carmel
Among the 119 employed individuals in Mount Carmel, private company employees (101 | 84.9%), and local government employees (18 | 15.1%) make up the most common classes of employment.
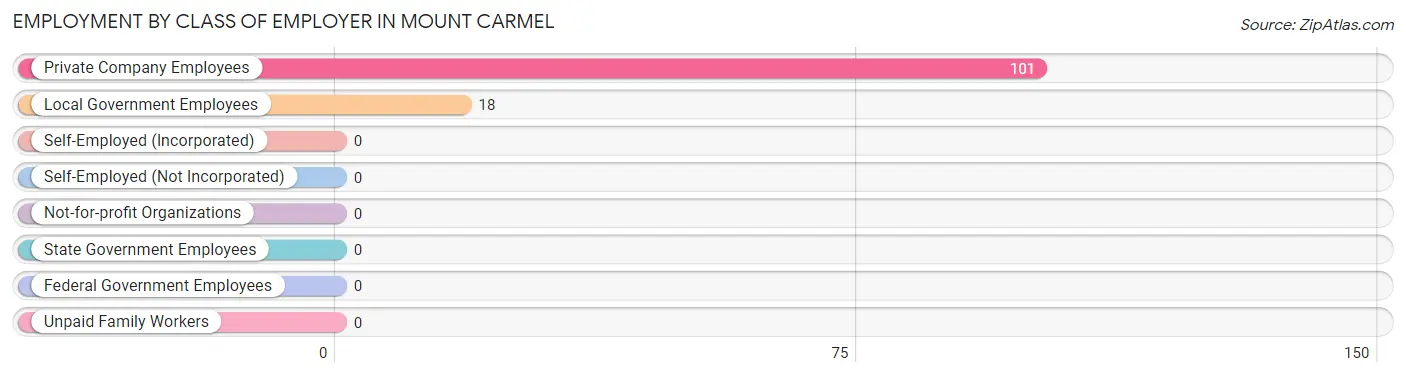
| Employer Class | # Employees | % Employees |
| Private Company Employees | 101 | 84.9% |
| Self-Employed (Incorporated) | 0 | 0.0% |
| Self-Employed (Not Incorporated) | 0 | 0.0% |
| Not-for-profit Organizations | 0 | 0.0% |
| Local Government Employees | 18 | 15.1% |
| State Government Employees | 0 | 0.0% |
| Federal Government Employees | 0 | 0.0% |
| Unpaid Family Workers | 0 | 0.0% |
| Total | 119 | 100.0% |
Employment Status by Age in Mount Carmel
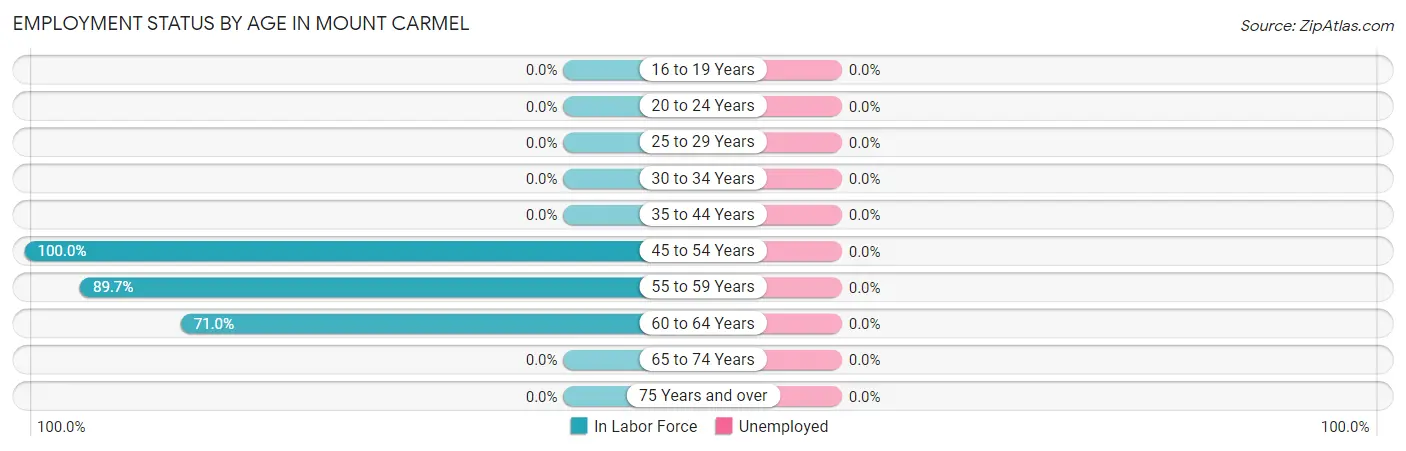
| Age Bracket | In Labor Force | Unemployed |
| 16 to 19 Years | 0 (0.0%) | 0 (0.0%) |
| 20 to 24 Years | 0 (0.0%) | 0 (0.0%) |
| 25 to 29 Years | 0 (0.0%) | 0 (0.0%) |
| 30 to 34 Years | 0 (0.0%) | 0 (0.0%) |
| 35 to 44 Years | 0 (0.0%) | 0 (0.0%) |
| 45 to 54 Years | 45 (100.0%) | 0 (0.0%) |
| 55 to 59 Years | 52 (89.7%) | 0 (0.0%) |
| 60 to 64 Years | 22 (71.0%) | 0 (0.0%) |
| 65 to 74 Years | 0 (0.0%) | 0 (0.0%) |
| 75 Years and over | 0 (0.0%) | 0 (0.0%) |
| Total | 119 (70.0%) | 0 (0.0%) |
Employment Status by Educational Attainment in Mount Carmel
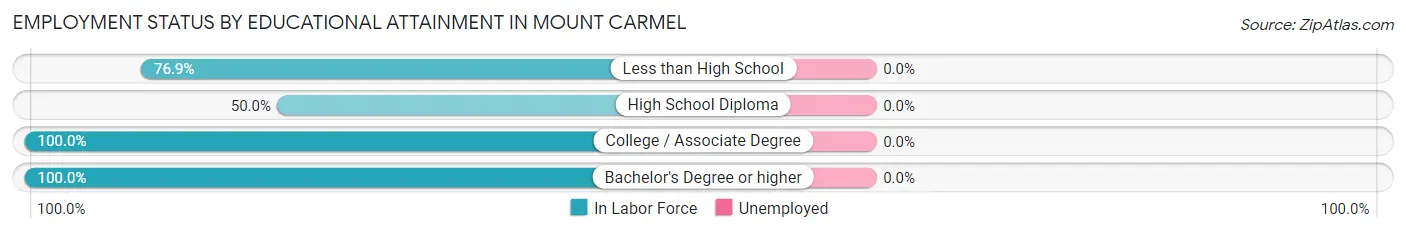
| Educational Attainment | In Labor Force | Unemployed |
| Less than High School | 20 (76.9%) | 0 (0.0%) |
| High School Diploma | 9 (50.0%) | 0 (0.0%) |
| College / Associate Degree | 47 (100.0%) | 0 (0.0%) |
| Bachelor's Degree or higher | 43 (100.0%) | 0 (0.0%) |
| Total | 119 (88.8%) | 0 (0.0%) |
Employment Occupations by Sex in Mount Carmel
Management, Business, Science and Arts Occupations
The most common Management, Business, Science and Arts occupations in Mount Carmel are Business & Financial (36 | 30.2%), Management (18 | 15.1%), Health Diagnosing & Treating (18 | 15.1%), Health Technologists (18 | 15.1%), and Computers, Engineering & Science (11 | 9.2%).
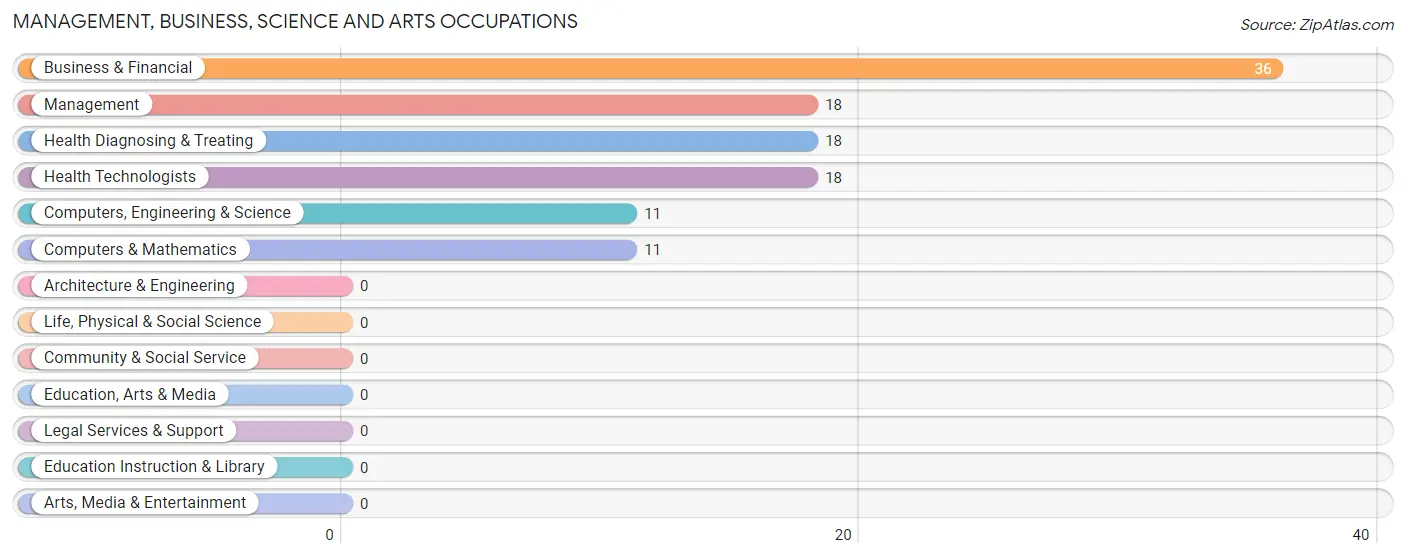
Management, Business, Science and Arts Occupations by Sex
Within the Management, Business, Science and Arts occupations in Mount Carmel, the most male-oriented occupations are Management (100.0%), Computers, Engineering & Science (100.0%), and Computers & Mathematics (100.0%), while the most female-oriented occupations are Business & Financial (100.0%), Health Diagnosing & Treating (100.0%), and Health Technologists (100.0%).
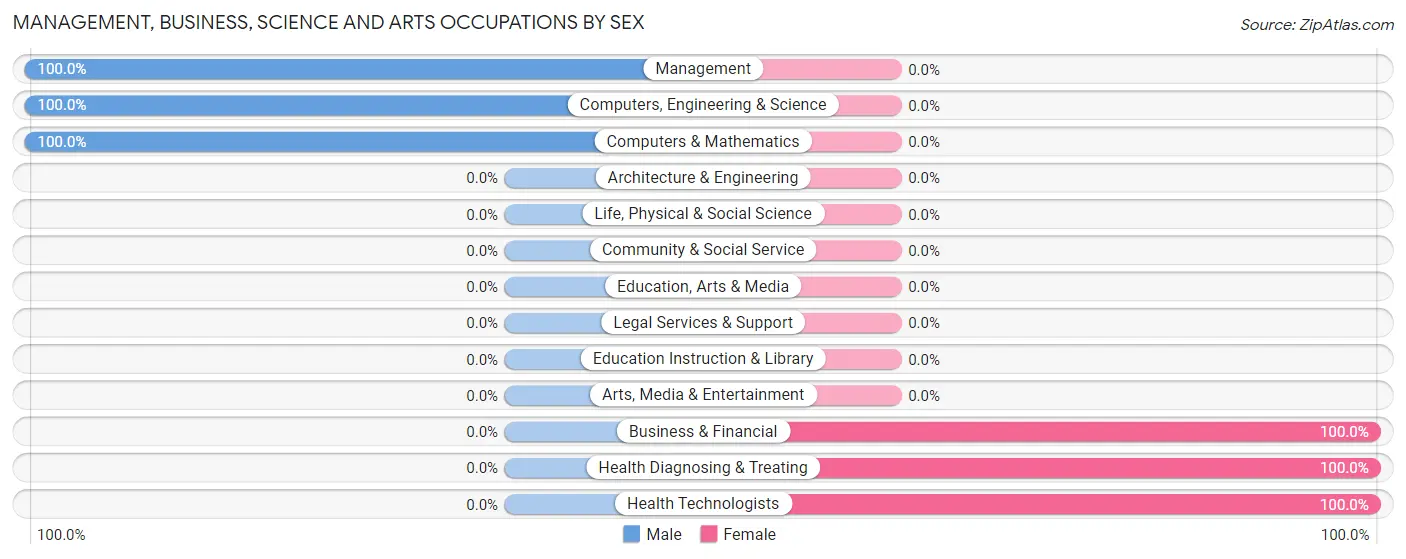
| Occupation | Male | Female |
| Management | 18 (100.0%) | 0 (0.0%) |
| Business & Financial | 0 (0.0%) | 36 (100.0%) |
| Computers, Engineering & Science | 11 (100.0%) | 0 (0.0%) |
| Computers & Mathematics | 11 (100.0%) | 0 (0.0%) |
| Architecture & Engineering | 0 (0.0%) | 0 (0.0%) |
| Life, Physical & Social Science | 0 (0.0%) | 0 (0.0%) |
| Community & Social Service | 0 (0.0%) | 0 (0.0%) |
| Education, Arts & Media | 0 (0.0%) | 0 (0.0%) |
| Legal Services & Support | 0 (0.0%) | 0 (0.0%) |
| Education Instruction & Library | 0 (0.0%) | 0 (0.0%) |
| Arts, Media & Entertainment | 0 (0.0%) | 0 (0.0%) |
| Health Diagnosing & Treating | 0 (0.0%) | 18 (100.0%) |
| Health Technologists | 0 (0.0%) | 18 (100.0%) |
| Total (Category) | 29 (34.9%) | 54 (65.1%) |
| Total (Overall) | 56 (47.1%) | 63 (52.9%) |
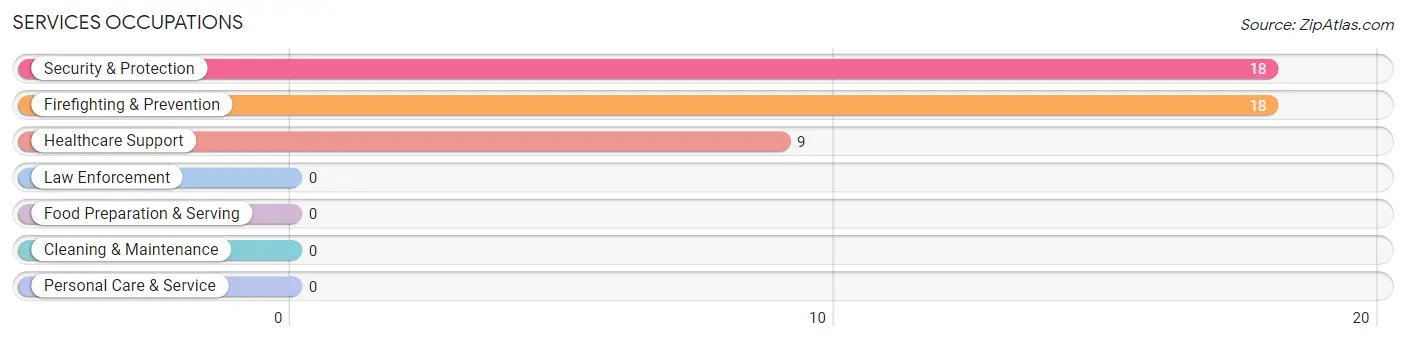
Services Occupations
The most common Services occupations in Mount Carmel are Security & Protection (18 | 15.1%), Firefighting & Prevention (18 | 15.1%), and Healthcare Support (9 | 7.6%).
Services Occupations by Sex
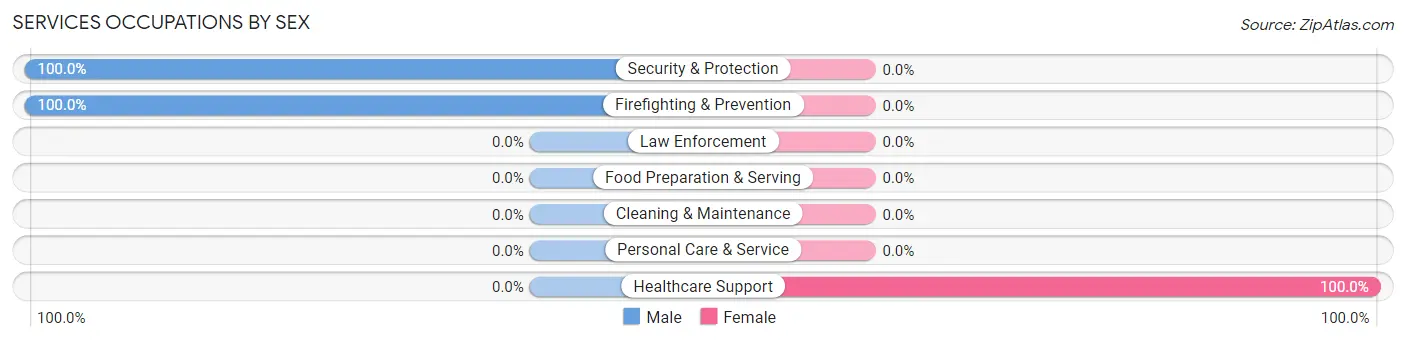
| Occupation | Male | Female |
| Healthcare Support | 0 (0.0%) | 9 (100.0%) |
| Security & Protection | 18 (100.0%) | 0 (0.0%) |
| Firefighting & Prevention | 18 (100.0%) | 0 (0.0%) |
| Law Enforcement | 0 (0.0%) | 0 (0.0%) |
| Food Preparation & Serving | 0 (0.0%) | 0 (0.0%) |
| Cleaning & Maintenance | 0 (0.0%) | 0 (0.0%) |
| Personal Care & Service | 0 (0.0%) | 0 (0.0%) |
| Total (Category) | 18 (66.7%) | 9 (33.3%) |
| Total (Overall) | 56 (47.1%) | 63 (52.9%) |
Sales and Office Occupations
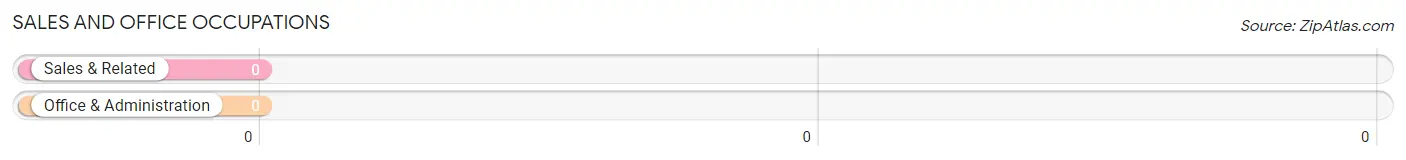
Sales and Office Occupations by Sex
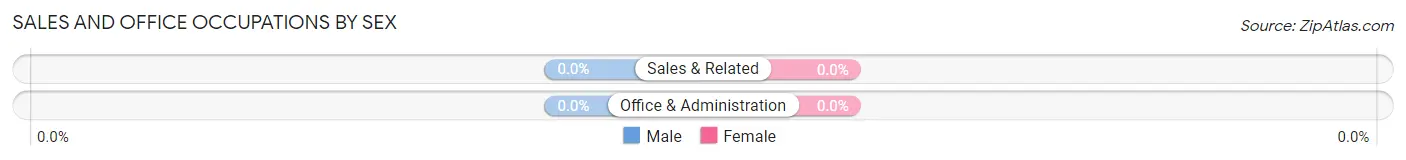
| Occupation | Male | Female |
| Sales & Related | 0 (0.0%) | 0 (0.0%) |
| Office & Administration | 0 (0.0%) | 0 (0.0%) |
| Total (Category) | 0 (0.0%) | 0 (0.0%) |
| Total (Overall) | 56 (47.1%) | 63 (52.9%) |
Natural Resources, Construction and Maintenance Occupations
The most common Natural Resources, Construction and Maintenance occupations in Mount Carmel are , and Construction & Extraction (9 | 7.6%).
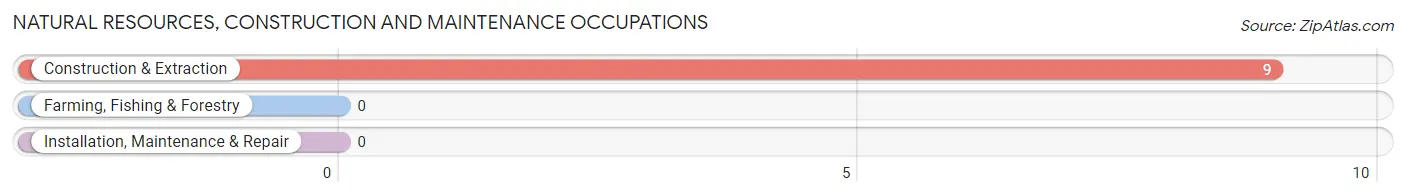
Natural Resources, Construction and Maintenance Occupations by Sex
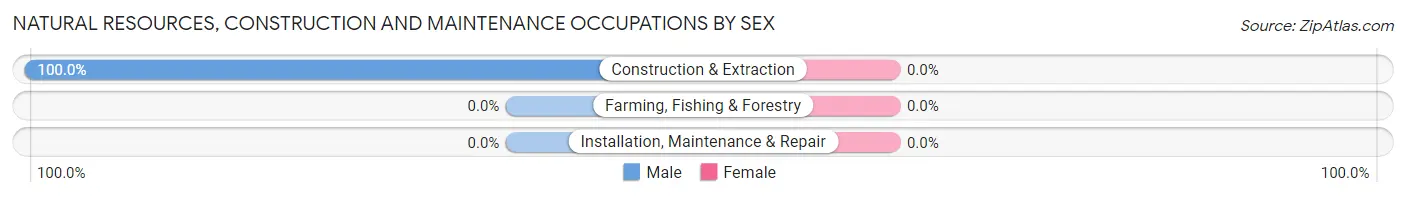
| Occupation | Male | Female |
| Farming, Fishing & Forestry | 0 (0.0%) | 0 (0.0%) |
| Construction & Extraction | 9 (100.0%) | 0 (0.0%) |
| Installation, Maintenance & Repair | 0 (0.0%) | 0 (0.0%) |
| Total (Category) | 9 (100.0%) | 0 (0.0%) |
| Total (Overall) | 56 (47.1%) | 63 (52.9%) |
Production, Transportation and Moving Occupations
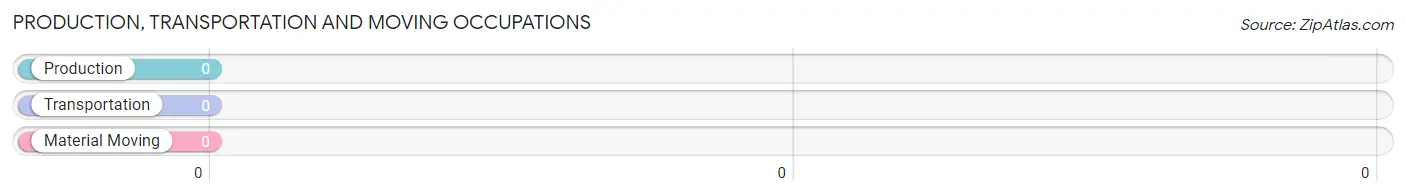
Production, Transportation and Moving Occupations by Sex
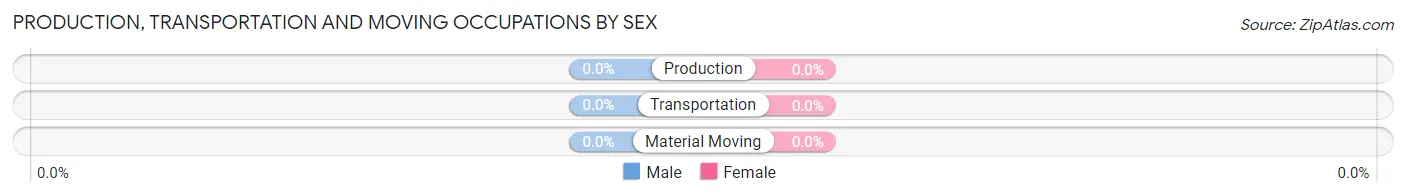
| Occupation | Male | Female |
| Production | 0 (0.0%) | 0 (0.0%) |
| Transportation | 0 (0.0%) | 0 (0.0%) |
| Material Moving | 0 (0.0%) | 0 (0.0%) |
| Total (Category) | 0 (0.0%) | 0 (0.0%) |
| Total (Overall) | 56 (47.1%) | 63 (52.9%) |
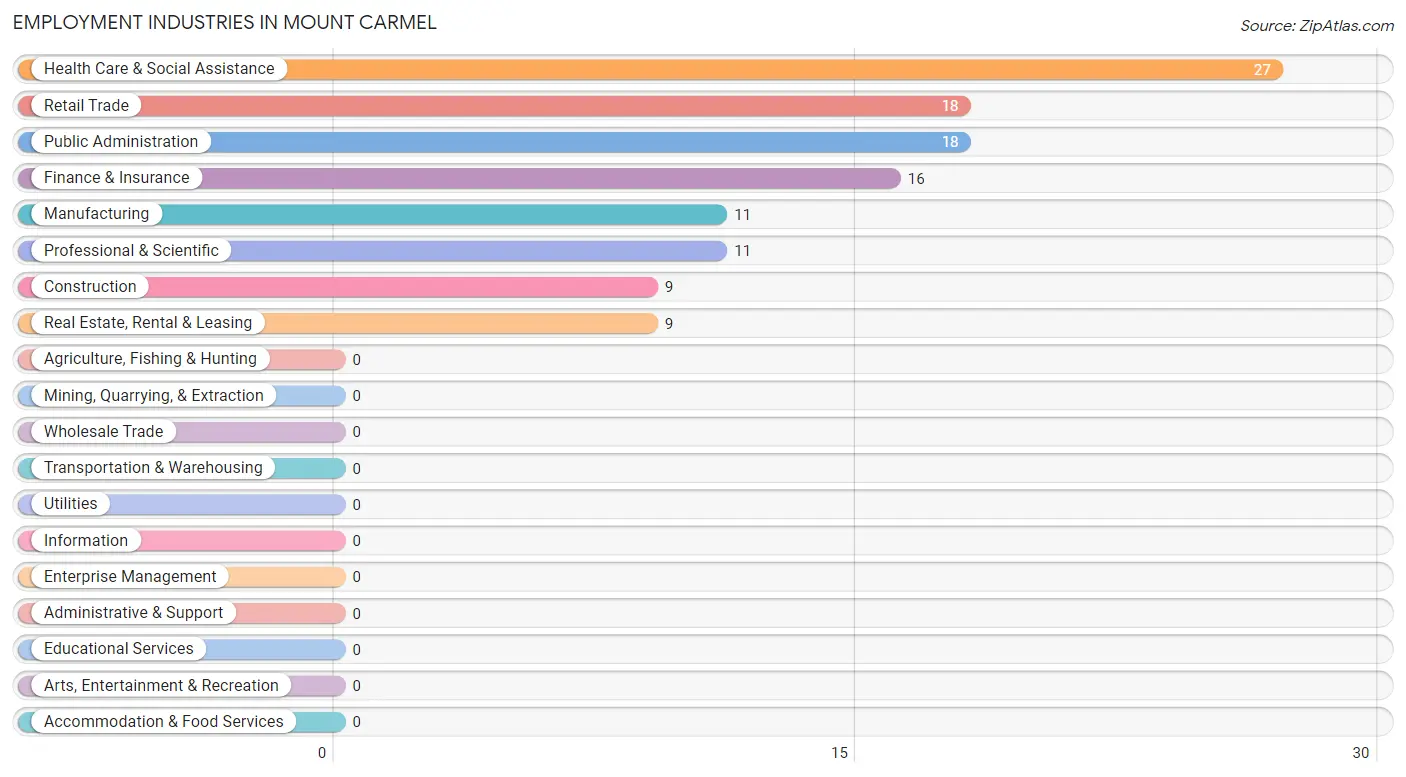
Employment Industries by Sex in Mount Carmel
Employment Industries in Mount Carmel
The major employment industries in Mount Carmel include Health Care & Social Assistance (27 | 22.7%), Retail Trade (18 | 15.1%), Public Administration (18 | 15.1%), Finance & Insurance (16 | 13.5%), and Manufacturing (11 | 9.2%).
Employment Industries by Sex in Mount Carmel
The Mount Carmel industries that see more men than women are Construction (100.0%), Manufacturing (100.0%), and Retail Trade (100.0%), whereas the industries that tend to have a higher number of women are Finance & Insurance (100.0%), Real Estate, Rental & Leasing (100.0%), and Professional & Scientific (100.0%).
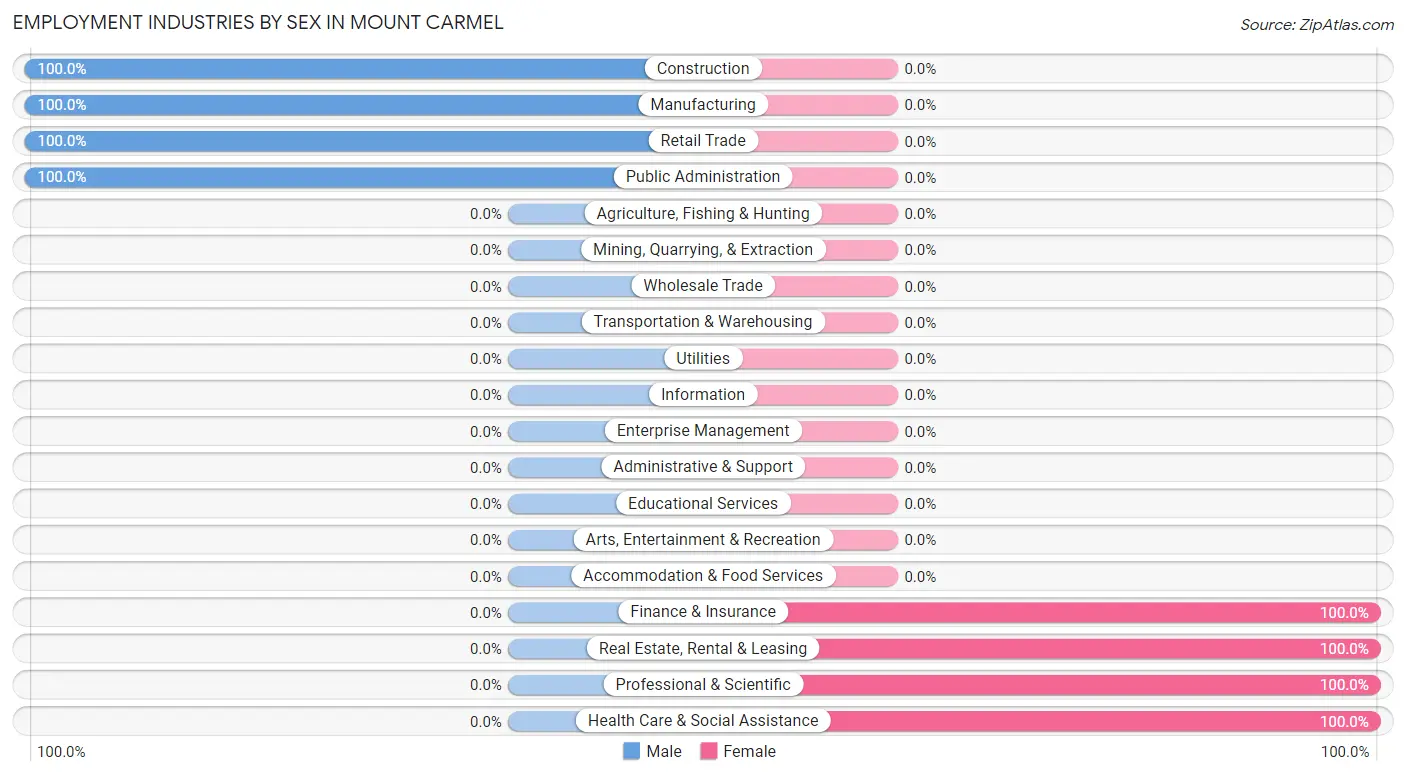
| Industry | Male | Female |
| Agriculture, Fishing & Hunting | 0 (0.0%) | 0 (0.0%) |
| Mining, Quarrying, & Extraction | 0 (0.0%) | 0 (0.0%) |
| Construction | 9 (100.0%) | 0 (0.0%) |
| Manufacturing | 11 (100.0%) | 0 (0.0%) |
| Wholesale Trade | 0 (0.0%) | 0 (0.0%) |
| Retail Trade | 18 (100.0%) | 0 (0.0%) |
| Transportation & Warehousing | 0 (0.0%) | 0 (0.0%) |
| Utilities | 0 (0.0%) | 0 (0.0%) |
| Information | 0 (0.0%) | 0 (0.0%) |
| Finance & Insurance | 0 (0.0%) | 16 (100.0%) |
| Real Estate, Rental & Leasing | 0 (0.0%) | 9 (100.0%) |
| Professional & Scientific | 0 (0.0%) | 11 (100.0%) |
| Enterprise Management | 0 (0.0%) | 0 (0.0%) |
| Administrative & Support | 0 (0.0%) | 0 (0.0%) |
| Educational Services | 0 (0.0%) | 0 (0.0%) |
| Health Care & Social Assistance | 0 (0.0%) | 27 (100.0%) |
| Arts, Entertainment & Recreation | 0 (0.0%) | 0 (0.0%) |
| Accommodation & Food Services | 0 (0.0%) | 0 (0.0%) |
| Public Administration | 18 (100.0%) | 0 (0.0%) |
| Total | 56 (47.1%) | 63 (52.9%) |
Education in Mount Carmel
School Enrollment in Mount Carmel
The most common levels of schooling among the 56 students in Mount Carmel are high school (38 | 67.9%), and middle school (18 | 32.1%).
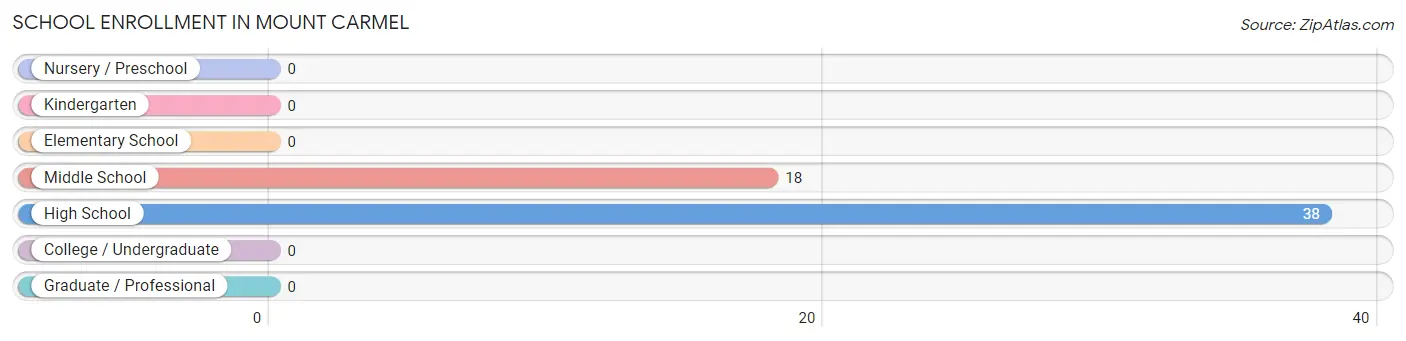
| School Level | # Students | % Students |
| Nursery / Preschool | 0 | 0.0% |
| Kindergarten | 0 | 0.0% |
| Elementary School | 0 | 0.0% |
| Middle School | 18 | 32.1% |
| High School | 38 | 67.9% |
| College / Undergraduate | 0 | 0.0% |
| Graduate / Professional | 0 | 0.0% |
| Total | 56 | 100.0% |
School Enrollment by Age by Funding Source in Mount Carmel
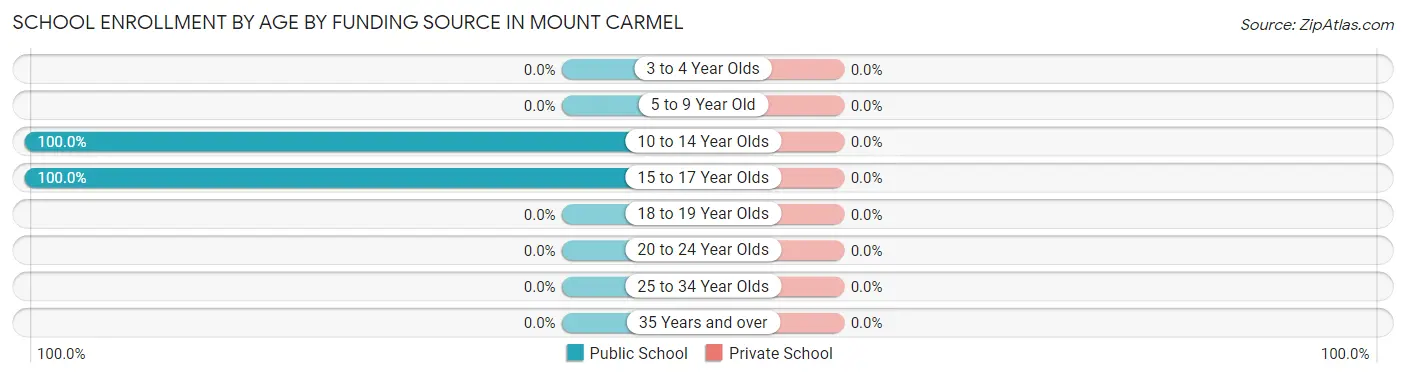
| Age Bracket | Public School | Private School |
| 3 to 4 Year Olds | 0 (0.0%) | 0 (0.0%) |
| 5 to 9 Year Old | 0 (0.0%) | 0 (0.0%) |
| 10 to 14 Year Olds | 18 (100.0%) | 0 (0.0%) |
| 15 to 17 Year Olds | 38 (100.0%) | 0 (0.0%) |
| 18 to 19 Year Olds | 0 (0.0%) | 0 (0.0%) |
| 20 to 24 Year Olds | 0 (0.0%) | 0 (0.0%) |
| 25 to 34 Year Olds | 0 (0.0%) | 0 (0.0%) |
| 35 Years and over | 0 (0.0%) | 0 (0.0%) |
| Total | 56 (100.0%) | 0 (0.0%) |
Educational Attainment by Field of Study in Mount Carmel
Business (25 | 58.1%), and bio, nature & agricultural (18 | 41.9%) are the most common fields of study among 43 individuals in Mount Carmel who have obtained a bachelor's degree or higher.
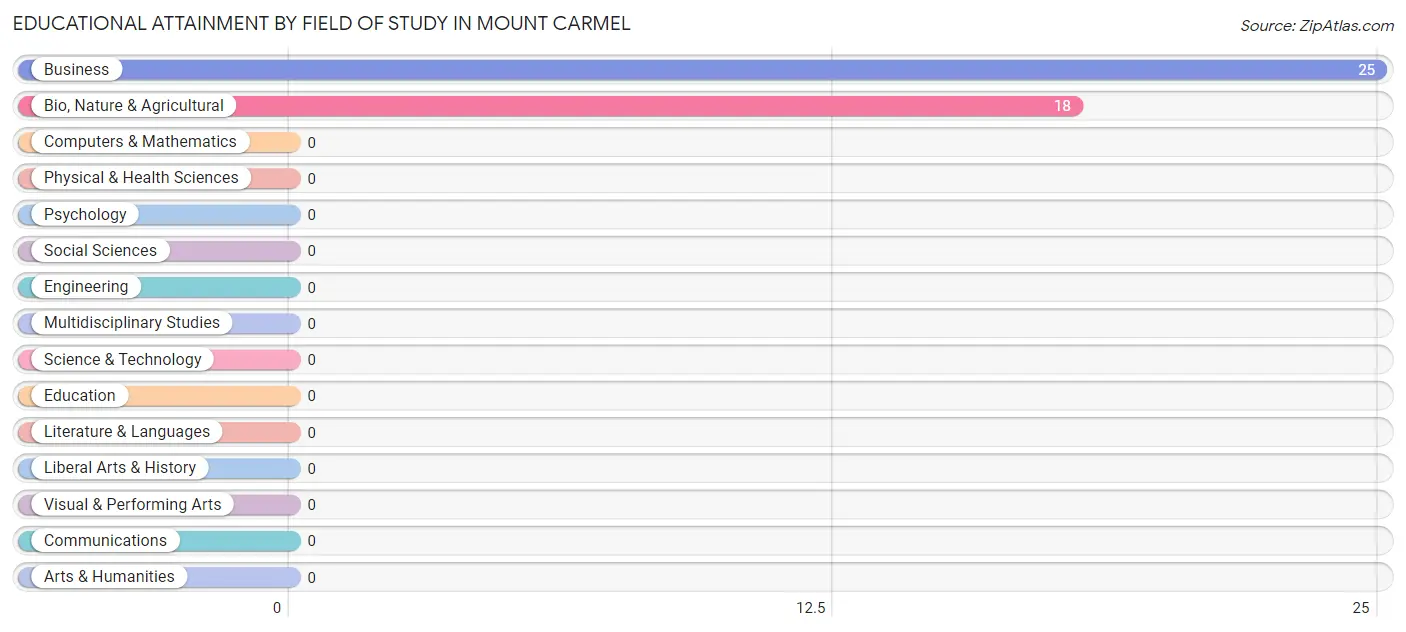
| Field of Study | # Graduates | % Graduates |
| Computers & Mathematics | 0 | 0.0% |
| Bio, Nature & Agricultural | 18 | 41.9% |
| Physical & Health Sciences | 0 | 0.0% |
| Psychology | 0 | 0.0% |
| Social Sciences | 0 | 0.0% |
| Engineering | 0 | 0.0% |
| Multidisciplinary Studies | 0 | 0.0% |
| Science & Technology | 0 | 0.0% |
| Business | 25 | 58.1% |
| Education | 0 | 0.0% |
| Literature & Languages | 0 | 0.0% |
| Liberal Arts & History | 0 | 0.0% |
| Visual & Performing Arts | 0 | 0.0% |
| Communications | 0 | 0.0% |
| Arts & Humanities | 0 | 0.0% |
| Total | 43 | 100.0% |
Transportation & Commute in Mount Carmel
Vehicle Availability by Sex in Mount Carmel
The most prevalent vehicle ownership categories in Mount Carmel are males with 2 vehicles (27, accounting for 48.2%) and females with 2 vehicles (38, making up 42.9%).
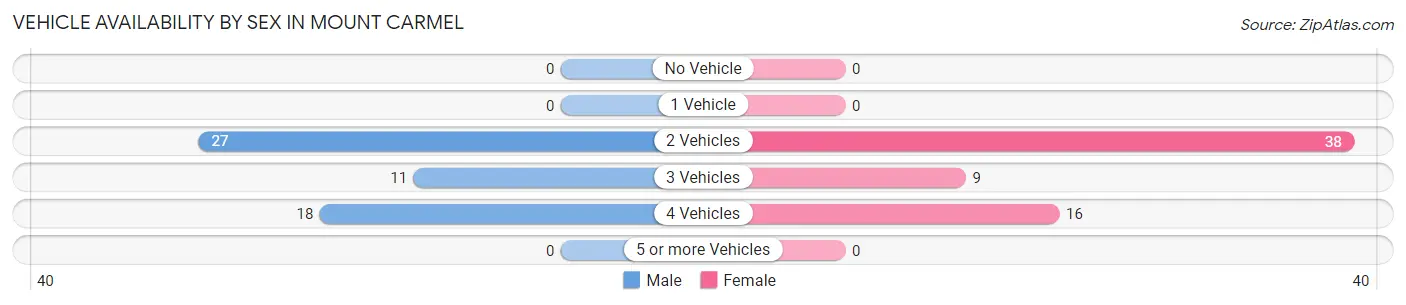
| Vehicles Available | Male | Female |
| No Vehicle | 0 (0.0%) | 0 (0.0%) |
| 1 Vehicle | 0 (0.0%) | 0 (0.0%) |
| 2 Vehicles | 27 (48.2%) | 38 (60.3%) |
| 3 Vehicles | 11 (19.6%) | 9 (14.3%) |
| 4 Vehicles | 18 (32.1%) | 16 (25.4%) |
| 5 or more Vehicles | 0 (0.0%) | 0 (0.0%) |
| Total | 56 (100.0%) | 63 (100.0%) |
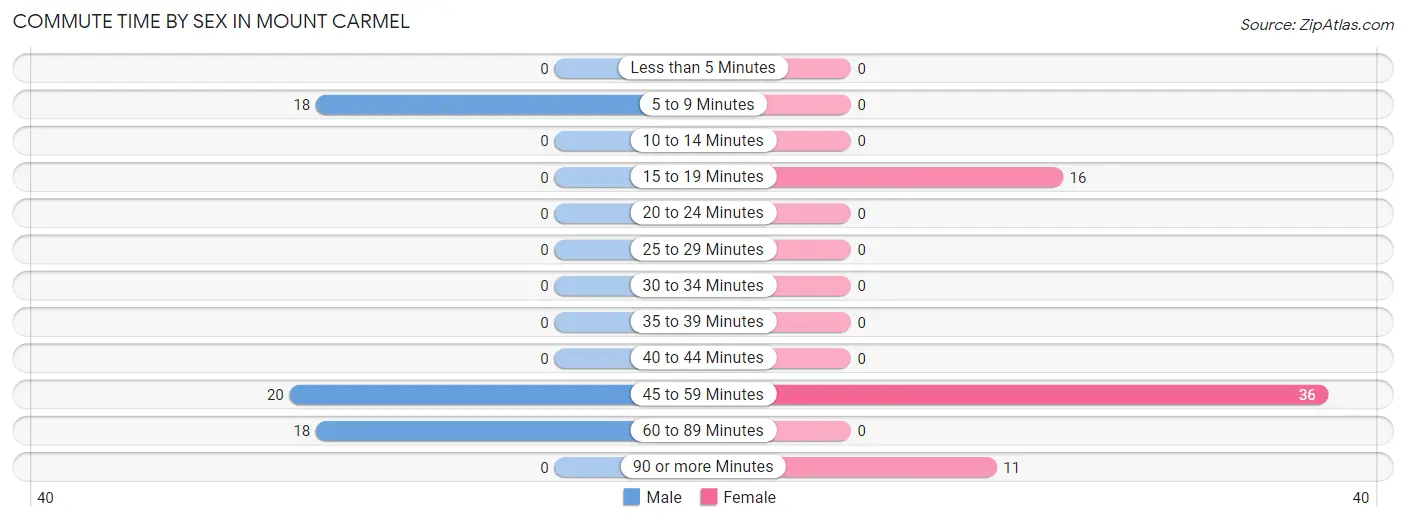
Commute Time in Mount Carmel
The most frequently occuring commute durations in Mount Carmel are 45 to 59 minutes (56 commuters, 47.1%), 5 to 9 minutes (18 commuters, 15.1%), and 60 to 89 minutes (18 commuters, 15.1%).
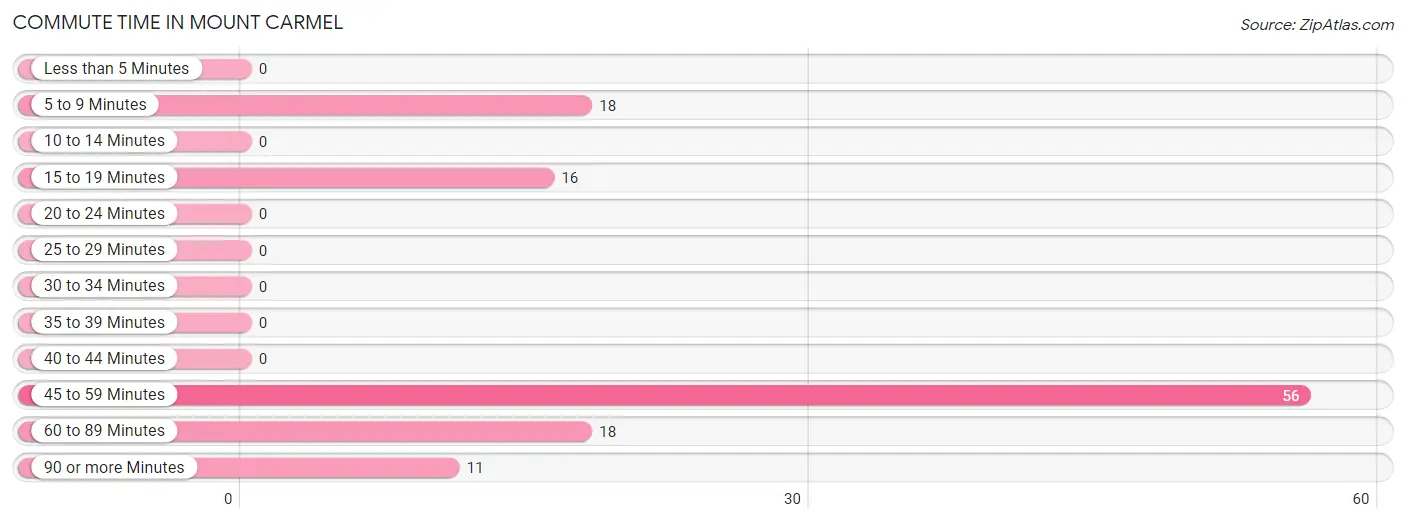
| Commute Time | # Commuters | % Commuters |
| Less than 5 Minutes | 0 | 0.0% |
| 5 to 9 Minutes | 18 | 15.1% |
| 10 to 14 Minutes | 0 | 0.0% |
| 15 to 19 Minutes | 16 | 13.5% |
| 20 to 24 Minutes | 0 | 0.0% |
| 25 to 29 Minutes | 0 | 0.0% |
| 30 to 34 Minutes | 0 | 0.0% |
| 35 to 39 Minutes | 0 | 0.0% |
| 40 to 44 Minutes | 0 | 0.0% |
| 45 to 59 Minutes | 56 | 47.1% |
| 60 to 89 Minutes | 18 | 15.1% |
| 90 or more Minutes | 11 | 9.2% |
Commute Time by Sex in Mount Carmel
The most common commute times in Mount Carmel are 45 to 59 minutes (20 commuters, 35.7%) for males and 45 to 59 minutes (36 commuters, 57.1%) for females.
| Commute Time | Male | Female |
| Less than 5 Minutes | 0 (0.0%) | 0 (0.0%) |
| 5 to 9 Minutes | 18 (32.1%) | 0 (0.0%) |
| 10 to 14 Minutes | 0 (0.0%) | 0 (0.0%) |
| 15 to 19 Minutes | 0 (0.0%) | 16 (25.4%) |
| 20 to 24 Minutes | 0 (0.0%) | 0 (0.0%) |
| 25 to 29 Minutes | 0 (0.0%) | 0 (0.0%) |
| 30 to 34 Minutes | 0 (0.0%) | 0 (0.0%) |
| 35 to 39 Minutes | 0 (0.0%) | 0 (0.0%) |
| 40 to 44 Minutes | 0 (0.0%) | 0 (0.0%) |
| 45 to 59 Minutes | 20 (35.7%) | 36 (57.1%) |
| 60 to 89 Minutes | 18 (32.1%) | 0 (0.0%) |
| 90 or more Minutes | 0 (0.0%) | 11 (17.5%) |
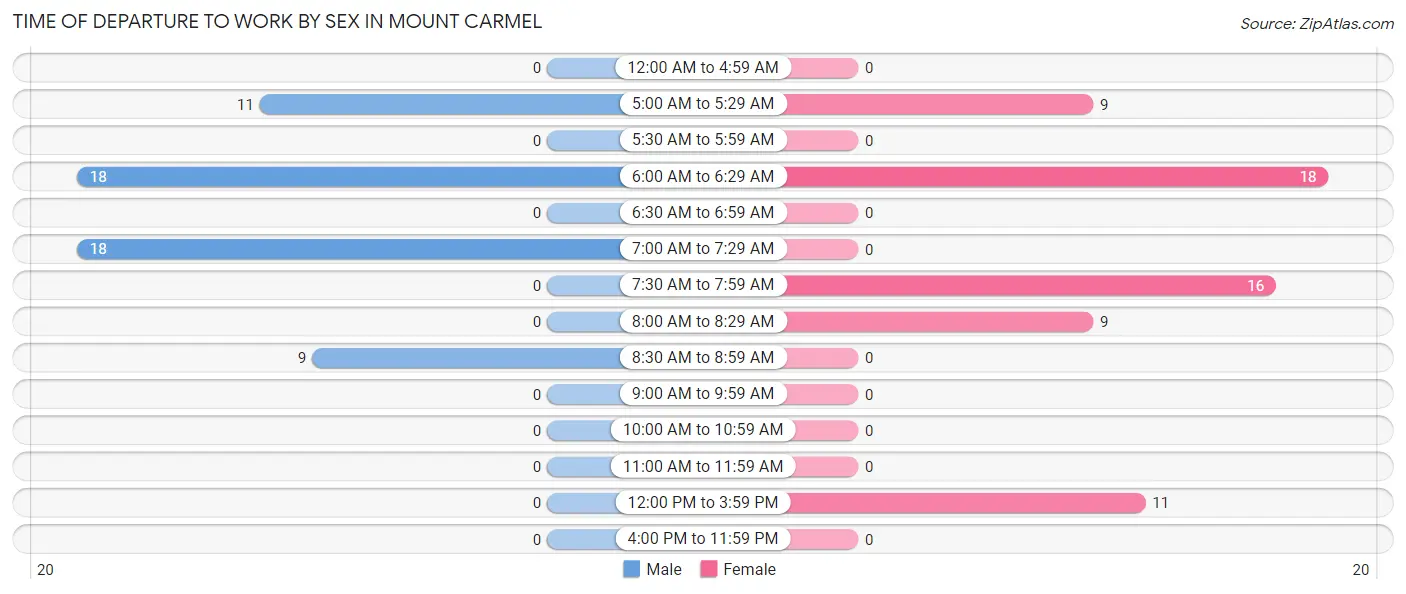
Time of Departure to Work by Sex in Mount Carmel
The most frequent times of departure to work in Mount Carmel are 6:00 AM to 6:29 AM (18, 32.1%) for males and 6:00 AM to 6:29 AM (18, 28.6%) for females.
| Time of Departure | Male | Female |
| 12:00 AM to 4:59 AM | 0 (0.0%) | 0 (0.0%) |
| 5:00 AM to 5:29 AM | 11 (19.6%) | 9 (14.3%) |
| 5:30 AM to 5:59 AM | 0 (0.0%) | 0 (0.0%) |
| 6:00 AM to 6:29 AM | 18 (32.1%) | 18 (28.6%) |
| 6:30 AM to 6:59 AM | 0 (0.0%) | 0 (0.0%) |
| 7:00 AM to 7:29 AM | 18 (32.1%) | 0 (0.0%) |
| 7:30 AM to 7:59 AM | 0 (0.0%) | 16 (25.4%) |
| 8:00 AM to 8:29 AM | 0 (0.0%) | 9 (14.3%) |
| 8:30 AM to 8:59 AM | 9 (16.1%) | 0 (0.0%) |
| 9:00 AM to 9:59 AM | 0 (0.0%) | 0 (0.0%) |
| 10:00 AM to 10:59 AM | 0 (0.0%) | 0 (0.0%) |
| 11:00 AM to 11:59 AM | 0 (0.0%) | 0 (0.0%) |
| 12:00 PM to 3:59 PM | 0 (0.0%) | 11 (17.5%) |
| 4:00 PM to 11:59 PM | 0 (0.0%) | 0 (0.0%) |
| Total | 56 (100.0%) | 63 (100.0%) |
Housing Occupancy in Mount Carmel
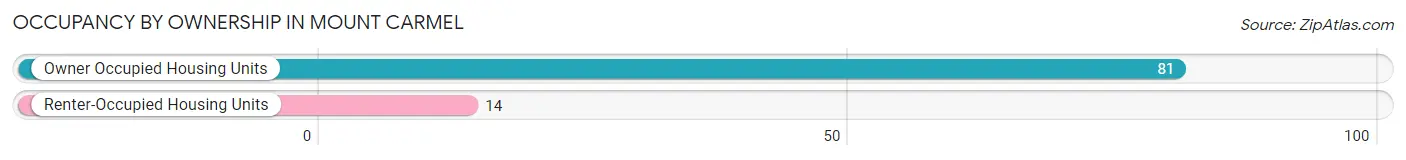
Occupancy by Ownership in Mount Carmel
Of the total 95 dwellings in Mount Carmel, owner-occupied units account for 81 (85.3%), while renter-occupied units make up 14 (14.7%).
| Occupancy | # Housing Units | % Housing Units |
| Owner Occupied Housing Units | 81 | 85.3% |
| Renter-Occupied Housing Units | 14 | 14.7% |
| Total Occupied Housing Units | 95 | 100.0% |
Occupancy by Household Size in Mount Carmel
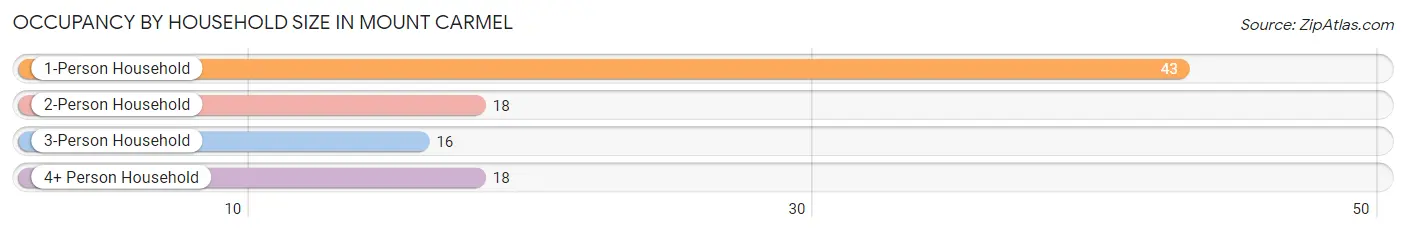
| Household Size | # Housing Units | % Housing Units |
| 1-Person Household | 43 | 45.3% |
| 2-Person Household | 18 | 19.0% |
| 3-Person Household | 16 | 16.8% |
| 4+ Person Household | 18 | 19.0% |
| Total Housing Units | 95 | 100.0% |
Occupancy by Ownership by Household Size in Mount Carmel
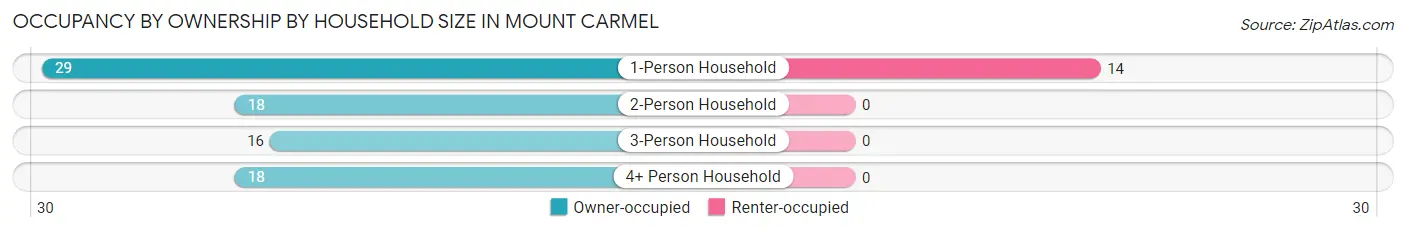
| Household Size | Owner-occupied | Renter-occupied |
| 1-Person Household | 29 (67.4%) | 14 (32.6%) |
| 2-Person Household | 18 (100.0%) | 0 (0.0%) |
| 3-Person Household | 16 (100.0%) | 0 (0.0%) |
| 4+ Person Household | 18 (100.0%) | 0 (0.0%) |
| Total Housing Units | 81 (85.3%) | 14 (14.7%) |
Occupancy by Educational Attainment in Mount Carmel
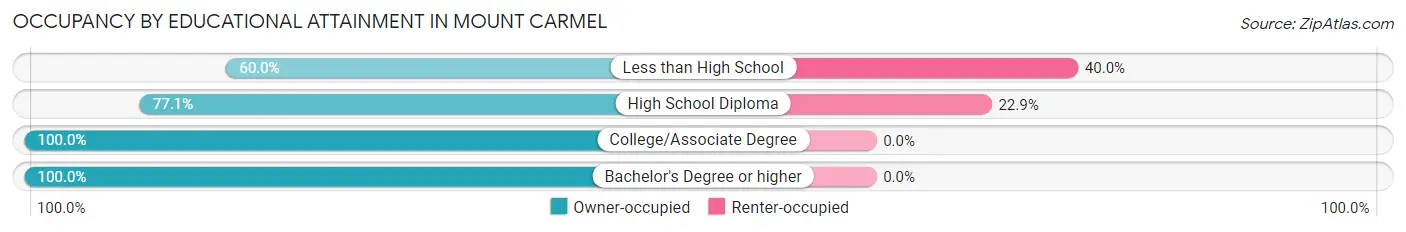
| Household Size | Owner-occupied | Renter-occupied |
| Less than High School | 9 (60.0%) | 6 (40.0%) |
| High School Diploma | 27 (77.1%) | 8 (22.9%) |
| College/Associate Degree | 29 (100.0%) | 0 (0.0%) |
| Bachelor's Degree or higher | 16 (100.0%) | 0 (0.0%) |
Occupancy by Age of Householder in Mount Carmel
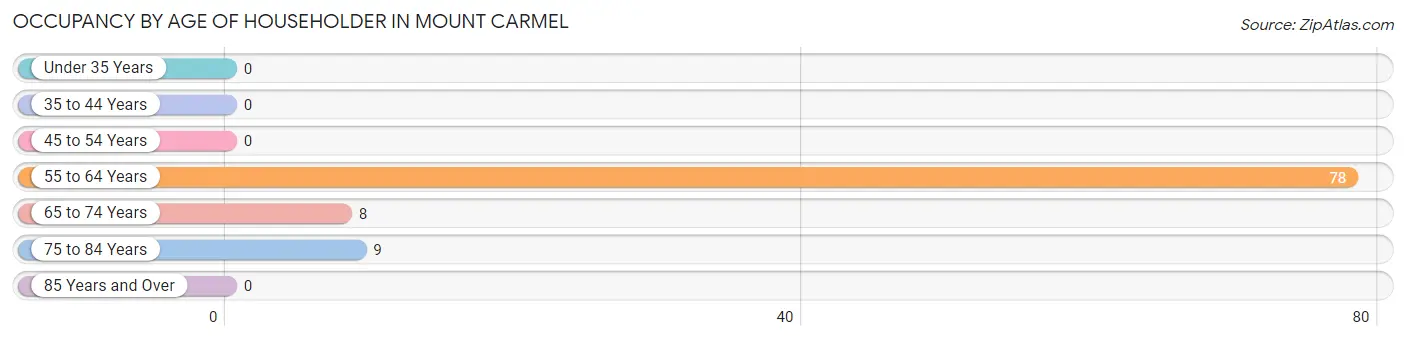
| Age Bracket | # Households | % Households |
| Under 35 Years | 0 | 0.0% |
| 35 to 44 Years | 0 | 0.0% |
| 45 to 54 Years | 0 | 0.0% |
| 55 to 64 Years | 78 | 82.1% |
| 65 to 74 Years | 8 | 8.4% |
| 75 to 84 Years | 9 | 9.5% |
| 85 Years and Over | 0 | 0.0% |
| Total | 95 | 100.0% |
Housing Finances in Mount Carmel
Median Income by Occupancy in Mount Carmel
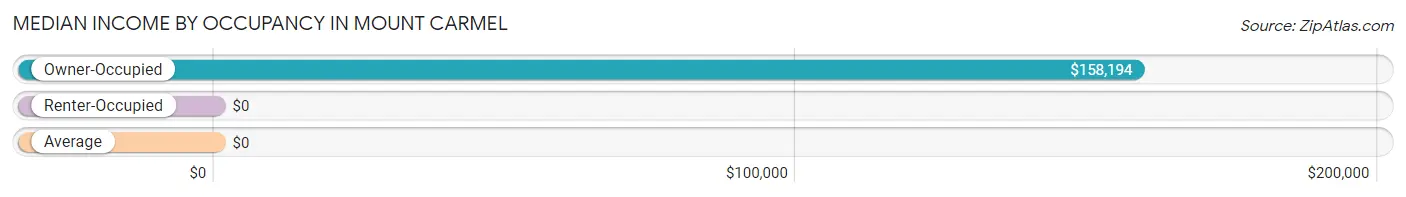
| Occupancy Type | # Households | Median Income |
| Owner-Occupied | 81 (85.3%) | $158,194 |
| Renter-Occupied | 14 (14.7%) | $0 |
| Average | 95 (100.0%) | $0 |
Occupancy by Householder Income Bracket in Mount Carmel
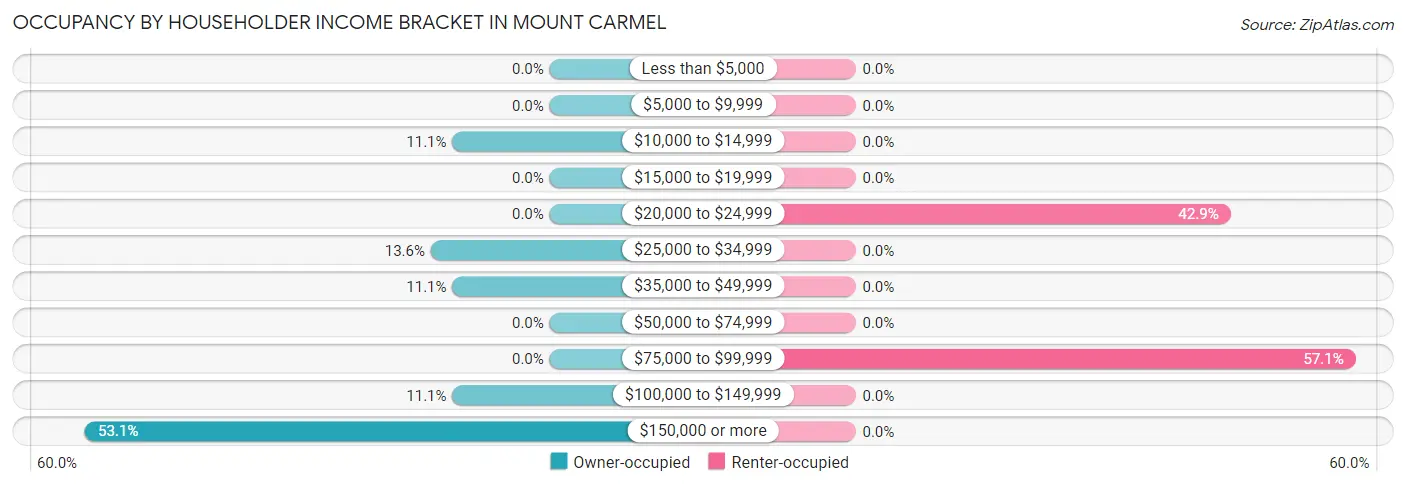
| Income Bracket | Owner-occupied | Renter-occupied |
| Less than $5,000 | 0 (0.0%) | 0 (0.0%) |
| $5,000 to $9,999 | 0 (0.0%) | 0 (0.0%) |
| $10,000 to $14,999 | 9 (11.1%) | 0 (0.0%) |
| $15,000 to $19,999 | 0 (0.0%) | 0 (0.0%) |
| $20,000 to $24,999 | 0 (0.0%) | 6 (42.9%) |
| $25,000 to $34,999 | 11 (13.6%) | 0 (0.0%) |
| $35,000 to $49,999 | 9 (11.1%) | 0 (0.0%) |
| $50,000 to $74,999 | 0 (0.0%) | 0 (0.0%) |
| $75,000 to $99,999 | 0 (0.0%) | 8 (57.1%) |
| $100,000 to $149,999 | 9 (11.1%) | 0 (0.0%) |
| $150,000 or more | 43 (53.1%) | 0 (0.0%) |
| Total | 81 (100.0%) | 14 (100.0%) |
Monthly Housing Cost Tiers in Mount Carmel
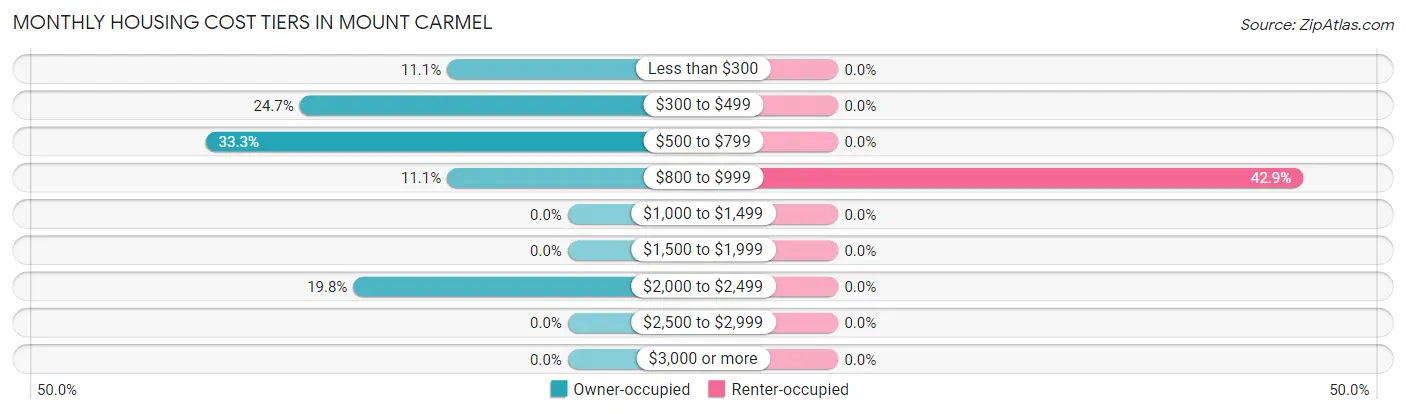
| Monthly Cost | Owner-occupied | Renter-occupied |
| Less than $300 | 9 (11.1%) | 0 (0.0%) |
| $300 to $499 | 20 (24.7%) | 0 (0.0%) |
| $500 to $799 | 27 (33.3%) | 0 (0.0%) |
| $800 to $999 | 9 (11.1%) | 6 (42.9%) |
| $1,000 to $1,499 | 0 (0.0%) | 0 (0.0%) |
| $1,500 to $1,999 | 0 (0.0%) | 0 (0.0%) |
| $2,000 to $2,499 | 16 (19.8%) | 0 (0.0%) |
| $2,500 to $2,999 | 0 (0.0%) | 0 (0.0%) |
| $3,000 or more | 0 (0.0%) | 0 (0.0%) |
| Total | 81 (100.0%) | 14 (100.0%) |
Physical Housing Characteristics in Mount Carmel
Housing Structures in Mount Carmel
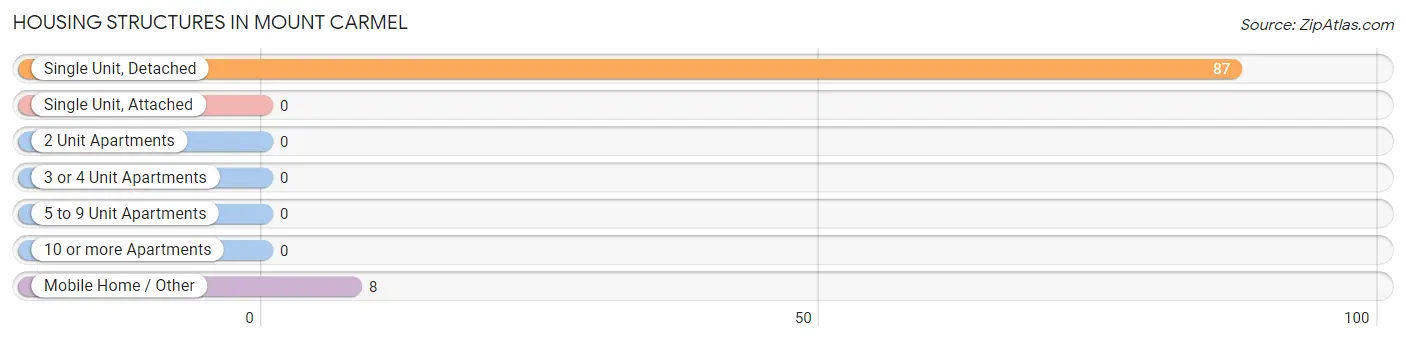
| Structure Type | # Housing Units | % Housing Units |
| Single Unit, Detached | 87 | 91.6% |
| Single Unit, Attached | 0 | 0.0% |
| 2 Unit Apartments | 0 | 0.0% |
| 3 or 4 Unit Apartments | 0 | 0.0% |
| 5 to 9 Unit Apartments | 0 | 0.0% |
| 10 or more Apartments | 0 | 0.0% |
| Mobile Home / Other | 8 | 8.4% |
| Total | 95 | 100.0% |
Housing Structures by Occupancy in Mount Carmel
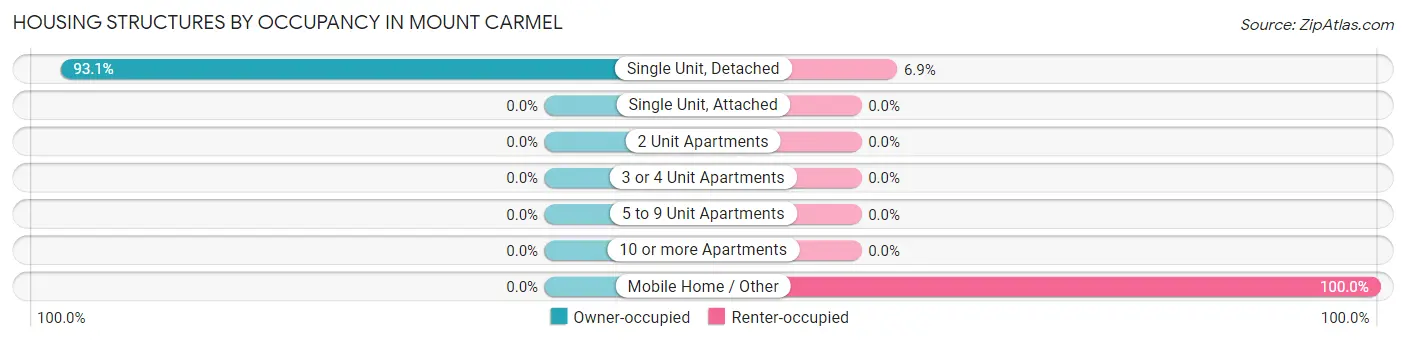
| Structure Type | Owner-occupied | Renter-occupied |
| Single Unit, Detached | 81 (93.1%) | 6 (6.9%) |
| Single Unit, Attached | 0 (0.0%) | 0 (0.0%) |
| 2 Unit Apartments | 0 (0.0%) | 0 (0.0%) |
| 3 or 4 Unit Apartments | 0 (0.0%) | 0 (0.0%) |
| 5 to 9 Unit Apartments | 0 (0.0%) | 0 (0.0%) |
| 10 or more Apartments | 0 (0.0%) | 0 (0.0%) |
| Mobile Home / Other | 0 (0.0%) | 8 (100.0%) |
| Total | 81 (85.3%) | 14 (14.7%) |
Housing Structures by Number of Rooms in Mount Carmel
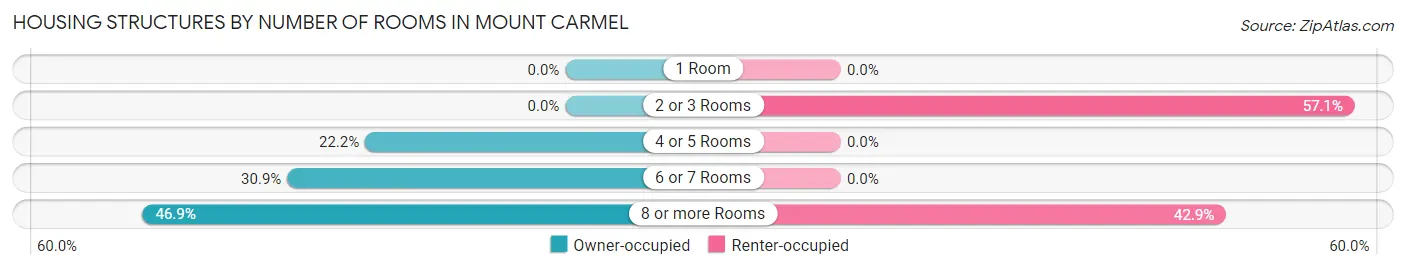
| Number of Rooms | Owner-occupied | Renter-occupied |
| 1 Room | 0 (0.0%) | 0 (0.0%) |
| 2 or 3 Rooms | 0 (0.0%) | 8 (57.1%) |
| 4 or 5 Rooms | 18 (22.2%) | 0 (0.0%) |
| 6 or 7 Rooms | 25 (30.9%) | 0 (0.0%) |
| 8 or more Rooms | 38 (46.9%) | 6 (42.9%) |
| Total | 81 (100.0%) | 14 (100.0%) |
Housing Structure by Heating Type in Mount Carmel
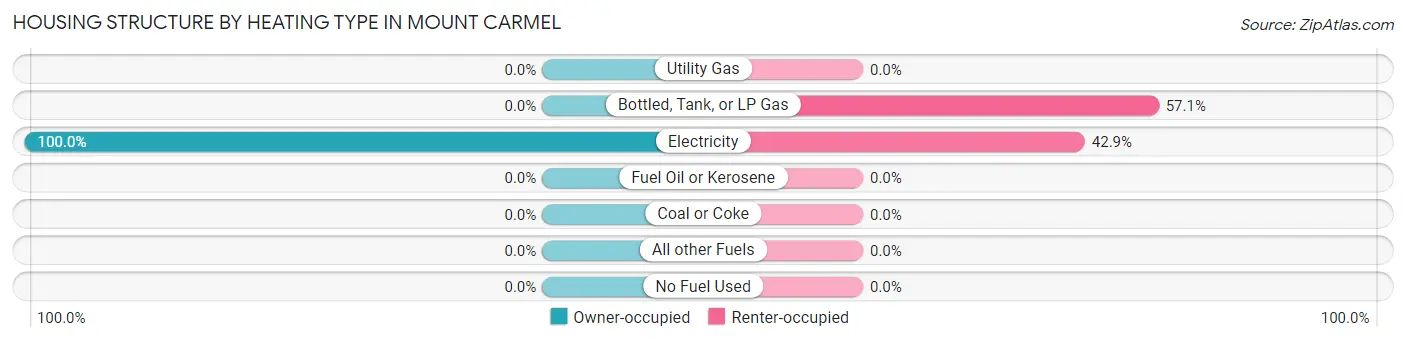
| Heating Type | Owner-occupied | Renter-occupied |
| Utility Gas | 0 (0.0%) | 0 (0.0%) |
| Bottled, Tank, or LP Gas | 0 (0.0%) | 8 (57.1%) |
| Electricity | 81 (100.0%) | 6 (42.9%) |
| Fuel Oil or Kerosene | 0 (0.0%) | 0 (0.0%) |
| Coal or Coke | 0 (0.0%) | 0 (0.0%) |
| All other Fuels | 0 (0.0%) | 0 (0.0%) |
| No Fuel Used | 0 (0.0%) | 0 (0.0%) |
| Total | 81 (100.0%) | 14 (100.0%) |
Household Vehicle Usage in Mount Carmel
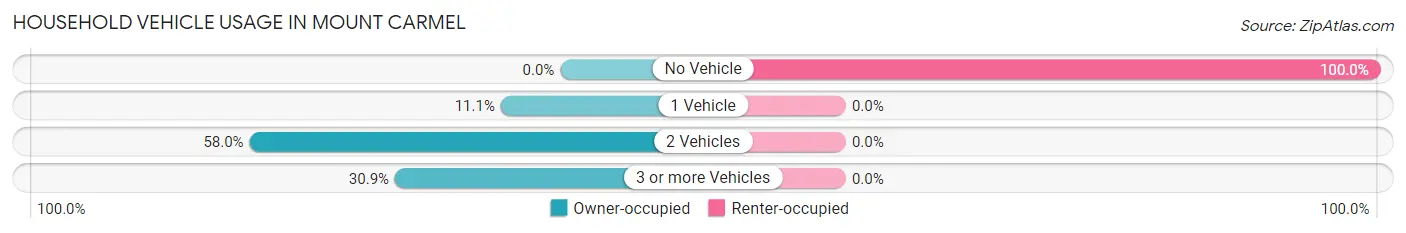
| Vehicles per Household | Owner-occupied | Renter-occupied |
| No Vehicle | 0 (0.0%) | 14 (100.0%) |
| 1 Vehicle | 9 (11.1%) | 0 (0.0%) |
| 2 Vehicles | 47 (58.0%) | 0 (0.0%) |
| 3 or more Vehicles | 25 (30.9%) | 0 (0.0%) |
| Total | 81 (100.0%) | 14 (100.0%) |
Real Estate & Mortgages in Mount Carmel
Real Estate and Mortgage Overview in Mount Carmel
| Characteristic | Without Mortgage | With Mortgage |
| Housing Units | 56 | 25 |
| Median Property Value | $180,600 | $0 |
| Median Household Income | - | - |
| Monthly Housing Costs | $495 | $0 |
| Real Estate Taxes | $1,222 | $0 |
Property Value by Mortgage Status in Mount Carmel
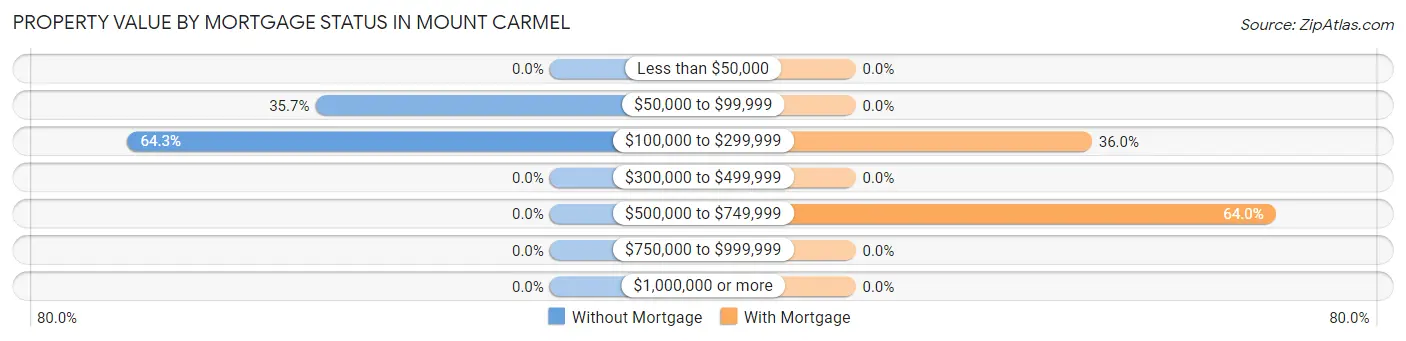
| Property Value | Without Mortgage | With Mortgage |
| Less than $50,000 | 0 (0.0%) | 0 (0.0%) |
| $50,000 to $99,999 | 20 (35.7%) | 0 (0.0%) |
| $100,000 to $299,999 | 36 (64.3%) | 9 (36.0%) |
| $300,000 to $499,999 | 0 (0.0%) | 0 (0.0%) |
| $500,000 to $749,999 | 0 (0.0%) | 16 (64.0%) |
| $750,000 to $999,999 | 0 (0.0%) | 0 (0.0%) |
| $1,000,000 or more | 0 (0.0%) | 0 (0.0%) |
| Total | 56 (100.0%) | 25 (100.0%) |
Household Income by Mortgage Status in Mount Carmel
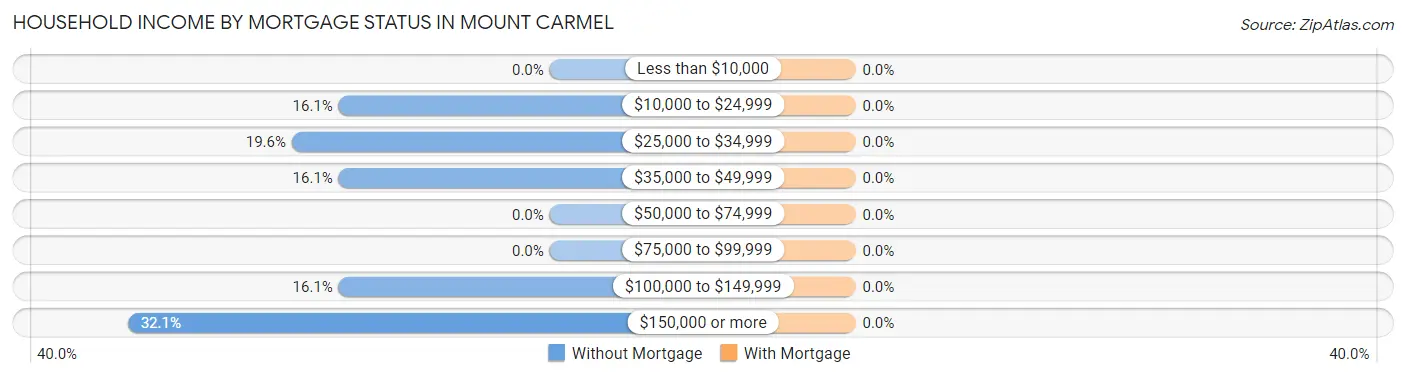
| Household Income | Without Mortgage | With Mortgage |
| Less than $10,000 | 0 (0.0%) | 0 (0.0%) |
| $10,000 to $24,999 | 9 (16.1%) | 0 (0.0%) |
| $25,000 to $34,999 | 11 (19.6%) | 0 (0.0%) |
| $35,000 to $49,999 | 9 (16.1%) | 0 (0.0%) |
| $50,000 to $74,999 | 0 (0.0%) | 0 (0.0%) |
| $75,000 to $99,999 | 0 (0.0%) | 0 (0.0%) |
| $100,000 to $149,999 | 9 (16.1%) | 0 (0.0%) |
| $150,000 or more | 18 (32.1%) | 0 (0.0%) |
| Total | 56 (100.0%) | 25 (100.0%) |
Property Value to Household Income Ratio in Mount Carmel
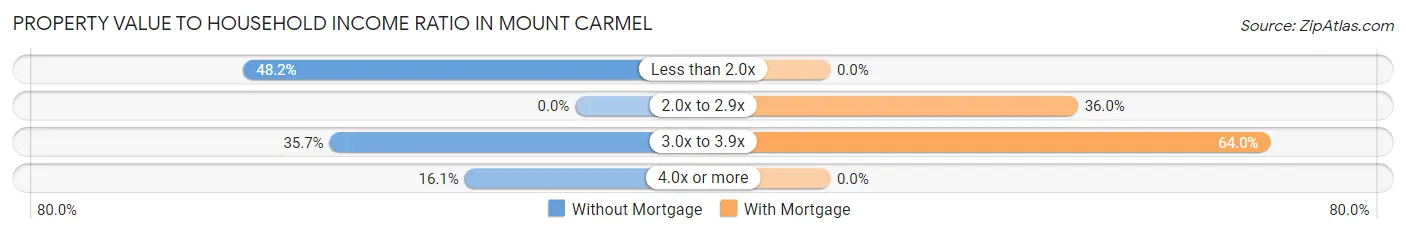
| Value-to-Income Ratio | Without Mortgage | With Mortgage |
| Less than 2.0x | 27 (48.2%) | 0 (0.0%) |
| 2.0x to 2.9x | 0 (0.0%) | 9 (36.0%) |
| 3.0x to 3.9x | 20 (35.7%) | 16 (64.0%) |
| 4.0x or more | 9 (16.1%) | 0 (0.0%) |
| Total | 56 (100.0%) | 25 (100.0%) |
Real Estate Taxes by Mortgage Status in Mount Carmel
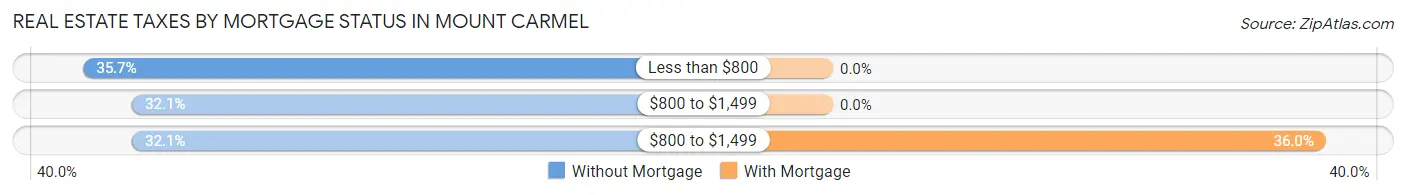
| Property Taxes | Without Mortgage | With Mortgage |
| Less than $800 | 20 (35.7%) | 0 (0.0%) |
| $800 to $1,499 | 18 (32.1%) | 0 (0.0%) |
| $800 to $1,499 | 18 (32.1%) | 9 (36.0%) |
| Total | 56 (100.0%) | 25 (100.0%) |
Health & Disability in Mount Carmel
Health Insurance Coverage by Age in Mount Carmel
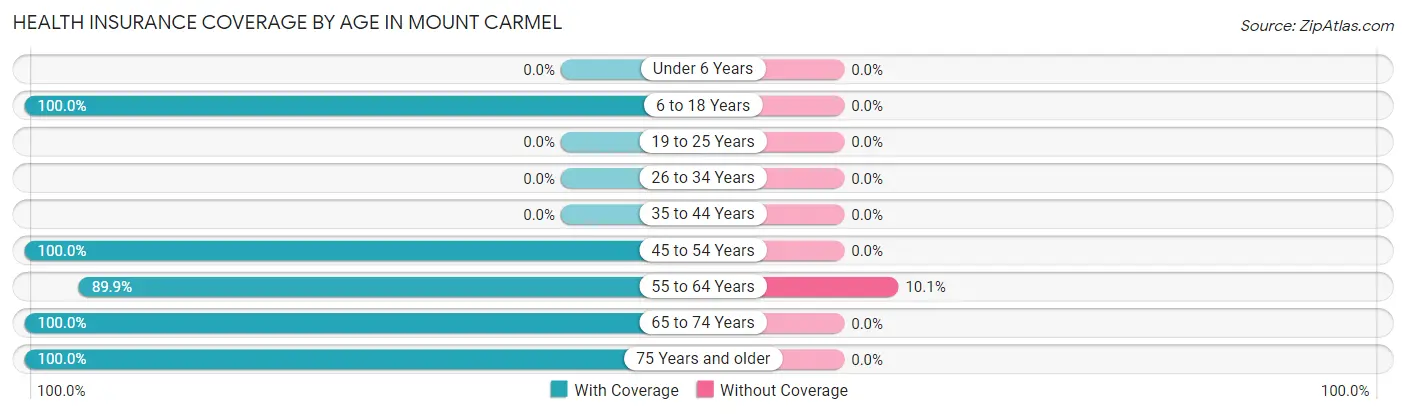
| Age Bracket | With Coverage | Without Coverage |
| Under 6 Years | 0 (0.0%) | 0 (0.0%) |
| 6 to 18 Years | 56 (100.0%) | 0 (0.0%) |
| 19 to 25 Years | 0 (0.0%) | 0 (0.0%) |
| 26 to 34 Years | 0 (0.0%) | 0 (0.0%) |
| 35 to 44 Years | 0 (0.0%) | 0 (0.0%) |
| 45 to 54 Years | 45 (100.0%) | 0 (0.0%) |
| 55 to 64 Years | 80 (89.9%) | 9 (10.1%) |
| 65 to 74 Years | 8 (100.0%) | 0 (0.0%) |
| 75 Years and older | 9 (100.0%) | 0 (0.0%) |
| Total | 198 (95.7%) | 9 (4.3%) |
Health Insurance Coverage by Citizenship Status in Mount Carmel
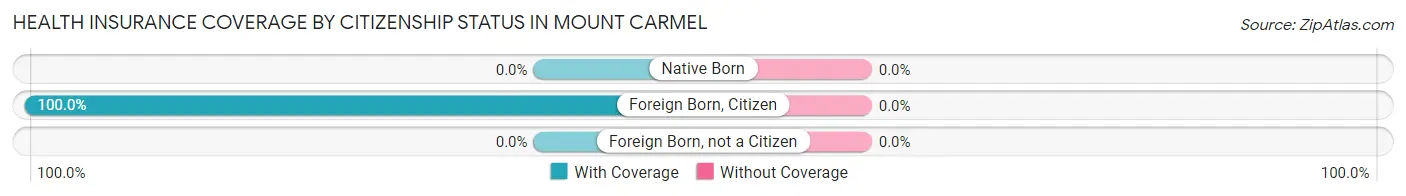
| Citizenship Status | With Coverage | Without Coverage |
| Native Born | 0 (0.0%) | 0 (0.0%) |
| Foreign Born, Citizen | 56 (100.0%) | 0 (0.0%) |
| Foreign Born, not a Citizen | 0 (0.0%) | 0 (0.0%) |
Health Insurance Coverage by Household Income in Mount Carmel
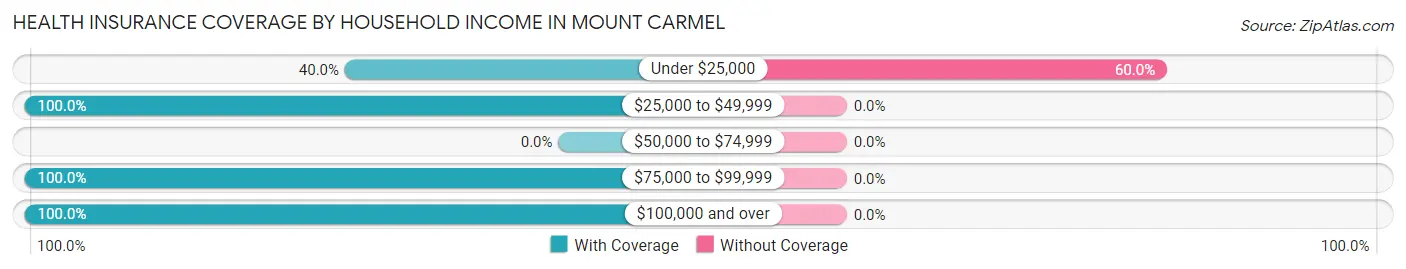
| Household Income | With Coverage | Without Coverage |
| Under $25,000 | 6 (40.0%) | 9 (60.0%) |
| $25,000 to $49,999 | 20 (100.0%) | 0 (0.0%) |
| $50,000 to $74,999 | 0 (0.0%) | 0 (0.0%) |
| $75,000 to $99,999 | 8 (100.0%) | 0 (0.0%) |
| $100,000 and over | 164 (100.0%) | 0 (0.0%) |
Public vs Private Health Insurance Coverage by Age in Mount Carmel
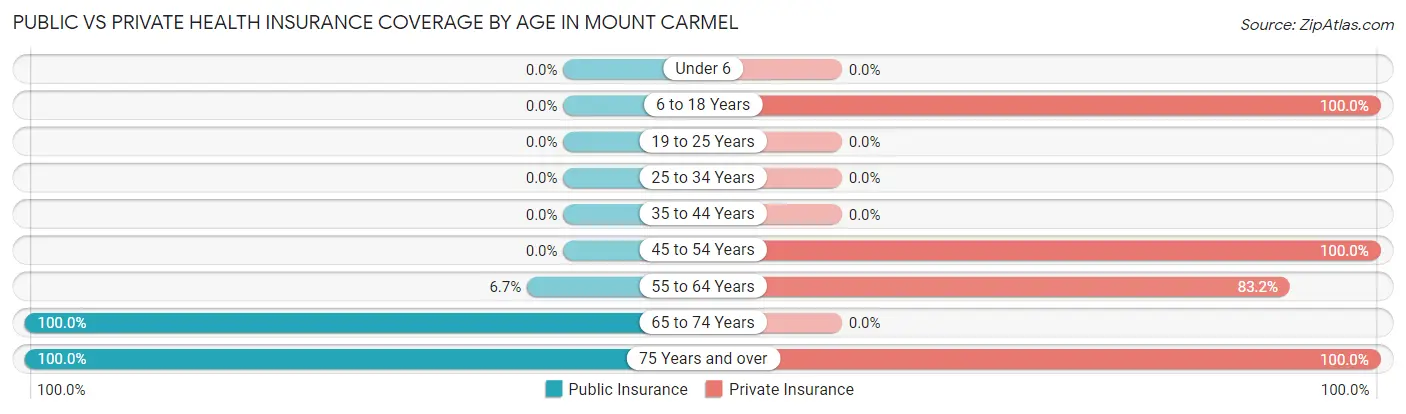
| Age Bracket | Public Insurance | Private Insurance |
| Under 6 | 0 (0.0%) | 0 (0.0%) |
| 6 to 18 Years | 0 (0.0%) | 56 (100.0%) |
| 19 to 25 Years | 0 (0.0%) | 0 (0.0%) |
| 25 to 34 Years | 0 (0.0%) | 0 (0.0%) |
| 35 to 44 Years | 0 (0.0%) | 0 (0.0%) |
| 45 to 54 Years | 0 (0.0%) | 45 (100.0%) |
| 55 to 64 Years | 6 (6.7%) | 74 (83.2%) |
| 65 to 74 Years | 8 (100.0%) | 0 (0.0%) |
| 75 Years and over | 9 (100.0%) | 9 (100.0%) |
| Total | 23 (11.1%) | 184 (88.9%) |
Disability Status by Sex by Age in Mount Carmel
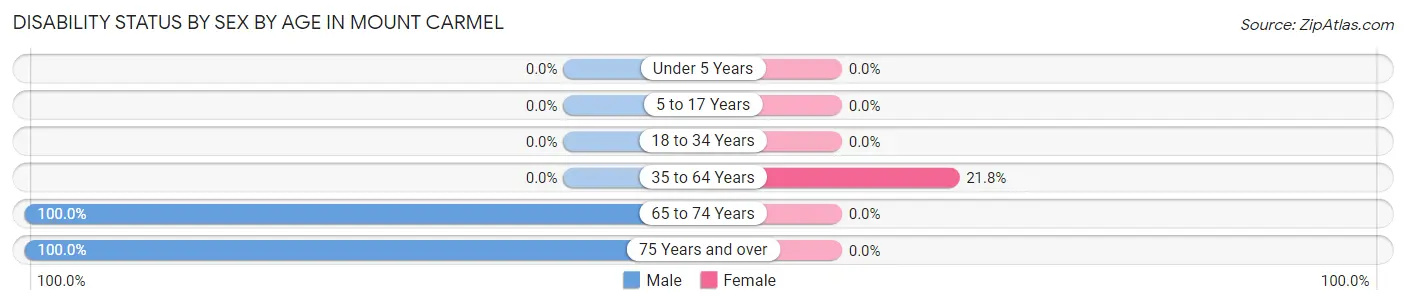
| Age Bracket | Male | Female |
| Under 5 Years | 0 (0.0%) | 0 (0.0%) |
| 5 to 17 Years | 0 (0.0%) | 0 (0.0%) |
| 18 to 34 Years | 0 (0.0%) | 0 (0.0%) |
| 35 to 64 Years | 0 (0.0%) | 17 (21.8%) |
| 65 to 74 Years | 8 (100.0%) | 0 (0.0%) |
| 75 Years and over | 9 (100.0%) | 0 (0.0%) |
Disability Class by Sex by Age in Mount Carmel
Disability Class: Hearing Difficulty
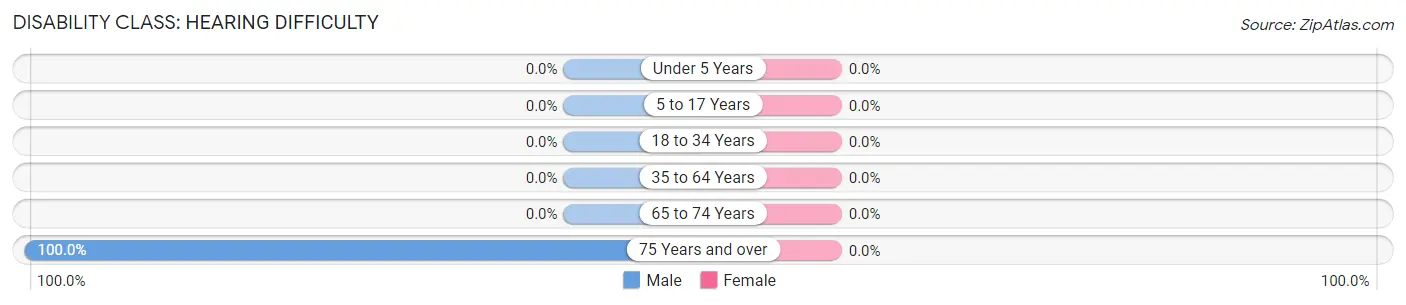
| Age Bracket | Male | Female |
| Under 5 Years | 0 (0.0%) | 0 (0.0%) |
| 5 to 17 Years | 0 (0.0%) | 0 (0.0%) |
| 18 to 34 Years | 0 (0.0%) | 0 (0.0%) |
| 35 to 64 Years | 0 (0.0%) | 0 (0.0%) |
| 65 to 74 Years | 0 (0.0%) | 0 (0.0%) |
| 75 Years and over | 9 (100.0%) | 0 (0.0%) |
Disability Class: Vision Difficulty
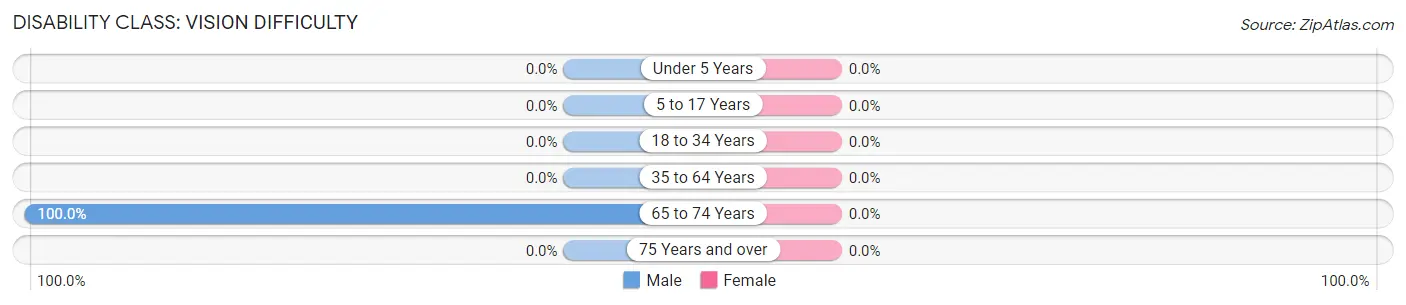
| Age Bracket | Male | Female |
| Under 5 Years | 0 (0.0%) | 0 (0.0%) |
| 5 to 17 Years | 0 (0.0%) | 0 (0.0%) |
| 18 to 34 Years | 0 (0.0%) | 0 (0.0%) |
| 35 to 64 Years | 0 (0.0%) | 0 (0.0%) |
| 65 to 74 Years | 8 (100.0%) | 0 (0.0%) |
| 75 Years and over | 0 (0.0%) | 0 (0.0%) |
Disability Class: Cognitive Difficulty
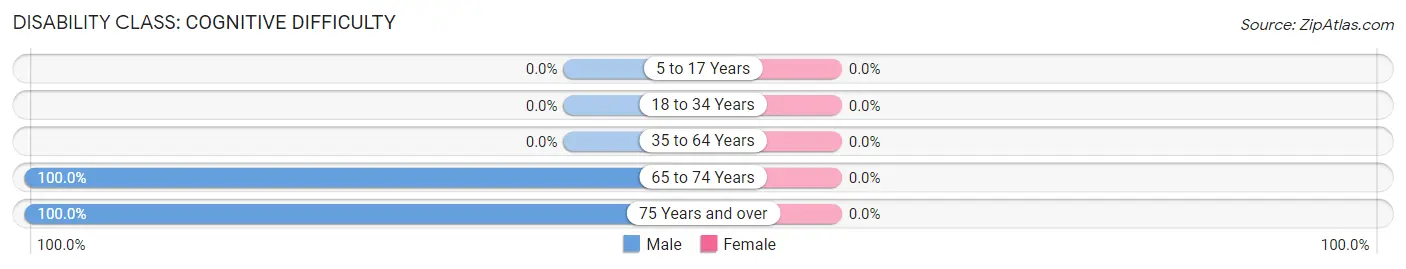
| Age Bracket | Male | Female |
| 5 to 17 Years | 0 (0.0%) | 0 (0.0%) |
| 18 to 34 Years | 0 (0.0%) | 0 (0.0%) |
| 35 to 64 Years | 0 (0.0%) | 0 (0.0%) |
| 65 to 74 Years | 8 (100.0%) | 0 (0.0%) |
| 75 Years and over | 9 (100.0%) | 0 (0.0%) |
Disability Class: Ambulatory Difficulty
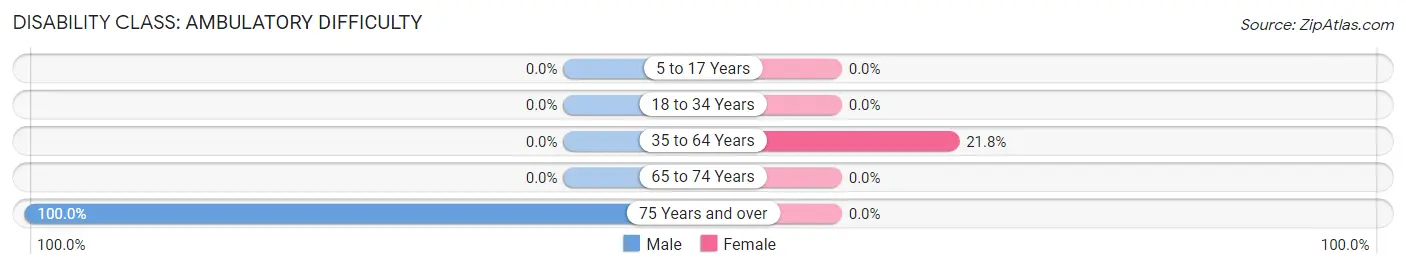
| Age Bracket | Male | Female |
| 5 to 17 Years | 0 (0.0%) | 0 (0.0%) |
| 18 to 34 Years | 0 (0.0%) | 0 (0.0%) |
| 35 to 64 Years | 0 (0.0%) | 17 (21.8%) |
| 65 to 74 Years | 0 (0.0%) | 0 (0.0%) |
| 75 Years and over | 9 (100.0%) | 0 (0.0%) |
Disability Class: Self-Care Difficulty
| Age Bracket | Male | Female |
| 5 to 17 Years | 0 (0.0%) | 0 (0.0%) |
| 18 to 34 Years | 0 (0.0%) | 0 (0.0%) |
| 35 to 64 Years | 0 (0.0%) | 0 (0.0%) |
| 65 to 74 Years | 0 (0.0%) | 0 (0.0%) |
| 75 Years and over | 0 (0.0%) | 0 (0.0%) |
Technology Access in Mount Carmel
Computing Device Access in Mount Carmel
| Device Type | # Households | % Households |
| Desktop or Laptop | 63 | 66.3% |
| Smartphone | 68 | 71.6% |
| Tablet | 52 | 54.7% |
| No Computing Device | 18 | 19.0% |
| Total | 95 | 100.0% |
Internet Access in Mount Carmel
| Internet Type | # Households | % Households |
| Dial-Up Internet | 0 | 0.0% |
| Broadband Home | 9 | 9.5% |
| Cellular Data Only | 14 | 14.7% |
| Satellite Internet | 45 | 47.4% |
| No Internet | 27 | 28.4% |
| Total | 95 | 100.0% |
Mount Carmel Summary
Carmel, Florida is a small town located in the panhandle of Florida, in the county of Franklin. It is situated on the banks of the Apalachicola River, and is bordered by the towns of Apalachicola, Eastpoint, and Carrabelle. The town has a population of approximately 1,000 people, and is a popular tourist destination due to its proximity to the Gulf of Mexico.
History
The area that is now Carmel was first settled in the early 1800s by settlers from the nearby town of Apalachicola. The town was originally known as “Carmel Hill”, and was named after the biblical Mount Carmel. The town was officially incorporated in 1887, and was initially a farming community. The town was also home to a number of sawmills, which provided lumber for the local economy.
In the early 1900s, the town began to experience a period of growth, as the timber industry began to expand. The town was also home to a number of small businesses, such as general stores, blacksmiths, and a post office. The town was also home to a number of churches, including the First Baptist Church of Carmel, which was founded in 1887.
In the late 1940s, the town began to experience a period of decline, as the timber industry began to decline. The town was also hit hard by the Great Depression, and many of the businesses in the town closed. The town was also hit hard by Hurricane Eloise in 1975, which caused extensive damage to the town.
Geography
Carmel is located in the panhandle of Florida, in the county of Franklin. It is situated on the banks of the Apalachicola River, and is bordered by the towns of Apalachicola, Eastpoint, and Carrabelle. The town has a total area of 1.2 square miles, all of which is land. The town is located at an elevation of 10 feet above sea level.
The climate in Carmel is classified as humid subtropical, with hot, humid summers and mild winters. The average temperature in the summer is around 90 degrees Fahrenheit, and the average temperature in the winter is around 60 degrees Fahrenheit. The town receives an average of 54 inches of precipitation per year.
Economy
The economy of Carmel is largely based on tourism, as the town is a popular destination for visitors from all over the world. The town is home to a number of hotels, restaurants, and other tourist attractions. The town is also home to a number of small businesses, such as general stores, antique shops, and art galleries.
The town is also home to a number of fishing charters, which provide visitors with the opportunity to fish in the nearby Apalachicola Bay. The town is also home to a number of marinas, which provide visitors with access to the Gulf of Mexico.
Demographics
As of the 2010 census, the population of Carmel was 1,000 people. The racial makeup of the town was 97.2% White, 0.7% African American, 0.2% Native American, 0.2% Asian, 0.2% from other races, and 1.7% from two or more races. The median household income in the town was $31,250, and the median family income was $37,500. The per capita income in the town was $17,500.
Common Questions
What is Per Capita Income in Mount Carmel?
Per Capita income in Mount Carmel is $52,823.
What is the Median Family Income in Mount Carmel?
Median Family Income in Mount Carmel is $178,611.
What is Income or Wage Gap in Mount Carmel?
Income or Wage Gap in Mount Carmel is 0.6%.
Women in Mount Carmel earn 99.4 cents for every dollar earned by a man.
What is Inequality or Gini Index in Mount Carmel?
Inequality or Gini Index in Mount Carmel is 0.34.
What is the Total Population of Mount Carmel?
Total Population of Mount Carmel is 207.
What is the Total Male Population of Mount Carmel?
Total Male Population of Mount Carmel is 91.
What is the Total Female Population of Mount Carmel?
Total Female Population of Mount Carmel is 116.
What is the Ratio of Males per 100 Females in Mount Carmel?
There are 78.45 Males per 100 Females in Mount Carmel.
What is the Ratio of Females per 100 Males in Mount Carmel?
There are 127.47 Females per 100 Males in Mount Carmel.
What is the Median Population Age in Mount Carmel?
Median Population Age in Mount Carmel is 55.4 Years.
What is the Average Family Size in Mount Carmel
Average Family Size in Mount Carmel is 3.1 People.
What is the Average Household Size in Mount Carmel
Average Household Size in Mount Carmel is 2.2 People.
How Large is the Labor Force in Mount Carmel?
There are 119 People in the Labor Forcein in Mount Carmel.
What is the Percentage of People in the Labor Force in Mount Carmel?
70.0% of People are in the Labor Force in Mount Carmel.