Monticello, FL Map & Demographics
Monticello Map
Monticello Overview
$26,359
PER CAPITA INCOME
$66,471
AVG FAMILY INCOME
$48,043
AVG HOUSEHOLD INCOME
18.1%
WAGE / INCOME GAP [ % ]
81.9¢/ $1
WAGE / INCOME GAP [ $ ]
0.43
INEQUALITY / GINI INDEX
2,589
TOTAL POPULATION
1,165
MALE POPULATION
1,424
FEMALE POPULATION
81.81
MALES / 100 FEMALES
122.23
FEMALES / 100 MALES
55.5
MEDIAN AGE
2.8
AVG FAMILY SIZE
2.2
AVG HOUSEHOLD SIZE
1,094
LABOR FORCE [ PEOPLE ]
50.8%
PERCENT IN LABOR FORCE
2.0%
UNEMPLOYMENT RATE
Monticello Zip Codes
Monticello Area Codes
Income in Monticello
Income Overview in Monticello
Per Capita Income in Monticello is $26,359, while median incomes of families and households are $66,471 and $48,043 respectively.
| Characteristic | Number | Measure |
| Per Capita Income | 2,589 | $26,359 |
| Median Family Income | 727 | $66,471 |
| Mean Family Income | 727 | $77,331 |
| Median Household Income | 1,128 | $48,043 |
| Mean Household Income | 1,128 | $61,790 |
| Income Deficit | 727 | $0 |
| Wage / Income Gap (%) | 2,589 | 18.11% |
| Wage / Income Gap ($) | 2,589 | 81.89¢ per $1 |
| Gini / Inequality Index | 2,589 | 0.43 |
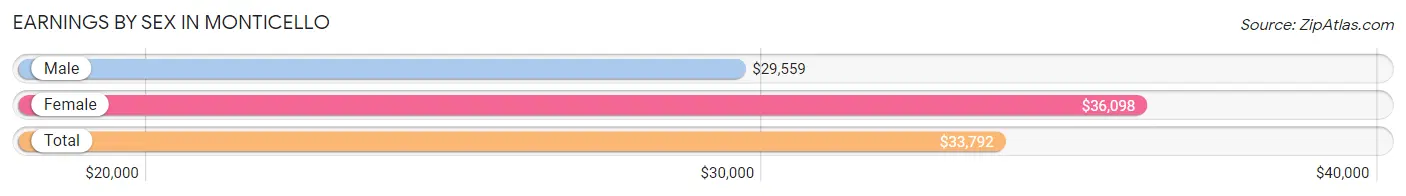
Earnings by Sex in Monticello
Average Earnings in Monticello are $33,792, $29,559 for men and $36,098 for women, a difference of 18.1%.
| Sex | Number | Average Earnings |
| Male | 558 (51.1%) | $29,559 |
| Female | 534 (48.9%) | $36,098 |
| Total | 1,092 (100.0%) | $33,792 |
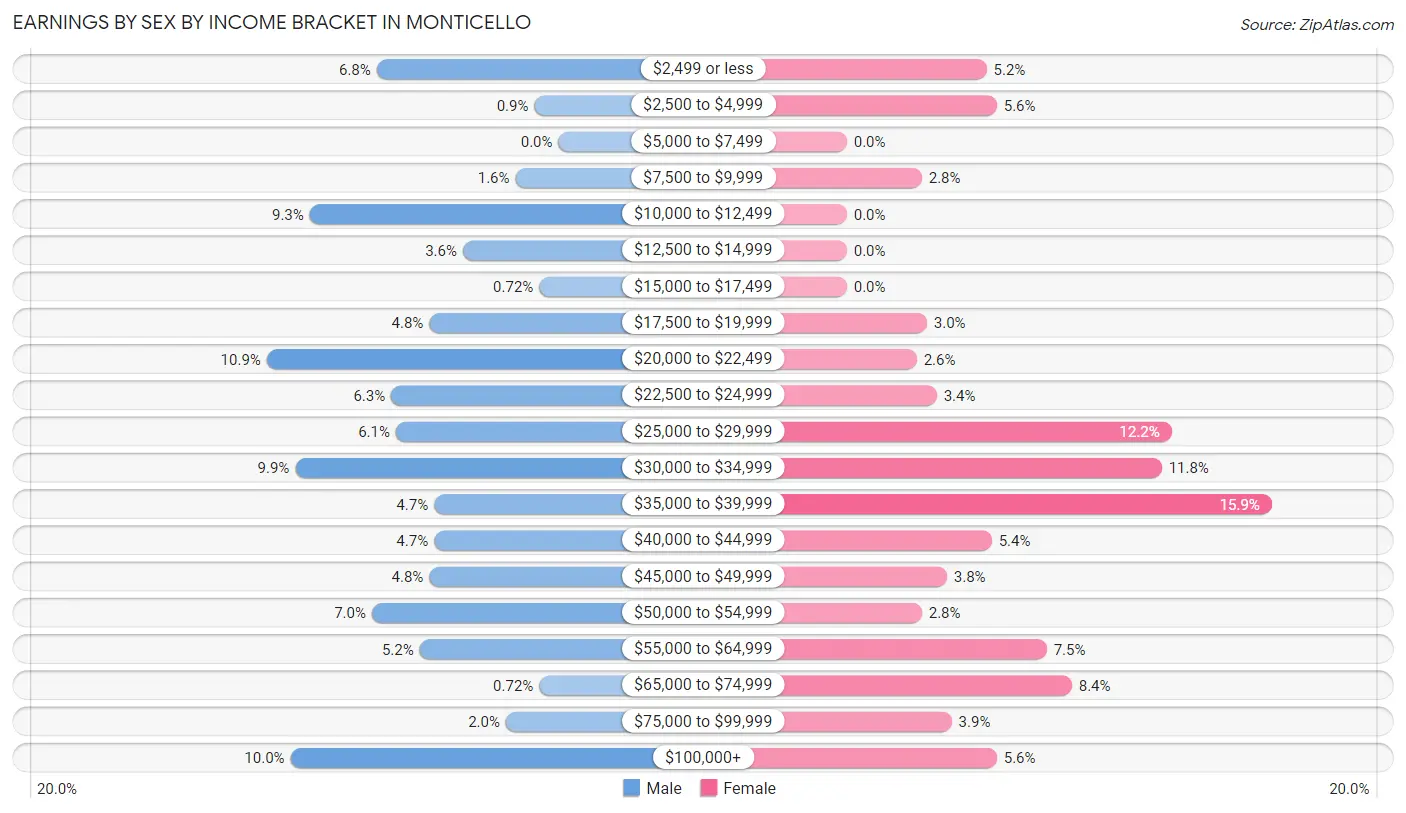
Earnings by Sex by Income Bracket in Monticello
The most common earnings brackets in Monticello are $20,000 to $22,499 for men (61 | 10.9%) and $35,000 to $39,999 for women (85 | 15.9%).
| Income | Male | Female |
| $2,499 or less | 38 (6.8%) | 28 (5.2%) |
| $2,500 to $4,999 | 5 (0.9%) | 30 (5.6%) |
| $5,000 to $7,499 | 0 (0.0%) | 0 (0.0%) |
| $7,500 to $9,999 | 9 (1.6%) | 15 (2.8%) |
| $10,000 to $12,499 | 52 (9.3%) | 0 (0.0%) |
| $12,500 to $14,999 | 20 (3.6%) | 0 (0.0%) |
| $15,000 to $17,499 | 4 (0.7%) | 0 (0.0%) |
| $17,500 to $19,999 | 27 (4.8%) | 16 (3.0%) |
| $20,000 to $22,499 | 61 (10.9%) | 14 (2.6%) |
| $22,500 to $24,999 | 35 (6.3%) | 18 (3.4%) |
| $25,000 to $29,999 | 34 (6.1%) | 65 (12.2%) |
| $30,000 to $34,999 | 55 (9.9%) | 63 (11.8%) |
| $35,000 to $39,999 | 26 (4.7%) | 85 (15.9%) |
| $40,000 to $44,999 | 26 (4.7%) | 29 (5.4%) |
| $45,000 to $49,999 | 27 (4.8%) | 20 (3.7%) |
| $50,000 to $54,999 | 39 (7.0%) | 15 (2.8%) |
| $55,000 to $64,999 | 29 (5.2%) | 40 (7.5%) |
| $65,000 to $74,999 | 4 (0.7%) | 45 (8.4%) |
| $75,000 to $99,999 | 11 (2.0%) | 21 (3.9%) |
| $100,000+ | 56 (10.0%) | 30 (5.6%) |
| Total | 558 (100.0%) | 534 (100.0%) |
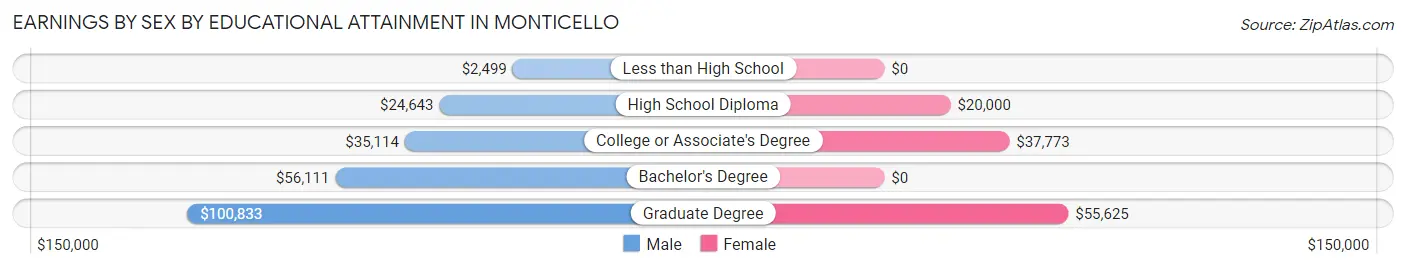
Earnings by Sex by Educational Attainment in Monticello
Average earnings in Monticello are $32,024 for men and $36,738 for women, a difference of 12.8%. Men with an educational attainment of graduate degree enjoy the highest average annual earnings of $100,833, while those with less than high school education earn the least with $2,499. Women with an educational attainment of graduate degree earn the most with the average annual earnings of $55,625, while those with high school diploma education have the smallest earnings of $20,000.
| Educational Attainment | Male Income | Female Income |
| Less than High School | $2,499 | $0 |
| High School Diploma | $24,643 | $20,000 |
| College or Associate's Degree | $35,114 | $37,773 |
| Bachelor's Degree | $56,111 | $0 |
| Graduate Degree | $100,833 | $55,625 |
| Total | $32,024 | $36,738 |
Family Income in Monticello
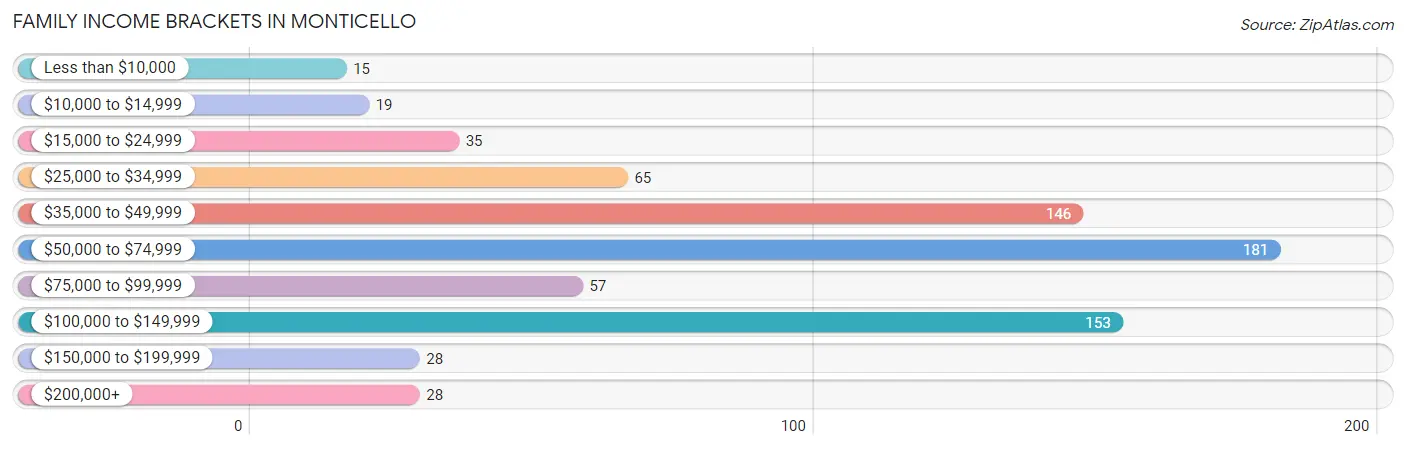
Family Income Brackets in Monticello
According to the Monticello family income data, there are 181 families falling into the $50,000 to $74,999 income range, which is the most common income bracket and makes up 24.9% of all families. Conversely, the less than $10,000 income bracket is the least frequent group with only 15 families (2.1%) belonging to this category.
| Income Bracket | # Families | % Families |
| Less than $10,000 | 15 | 2.1% |
| $10,000 to $14,999 | 19 | 2.6% |
| $15,000 to $24,999 | 35 | 4.8% |
| $25,000 to $34,999 | 65 | 8.9% |
| $35,000 to $49,999 | 146 | 20.1% |
| $50,000 to $74,999 | 181 | 24.9% |
| $75,000 to $99,999 | 57 | 7.8% |
| $100,000 to $149,999 | 153 | 21.0% |
| $150,000 to $199,999 | 28 | 3.9% |
| $200,000+ | 28 | 3.9% |
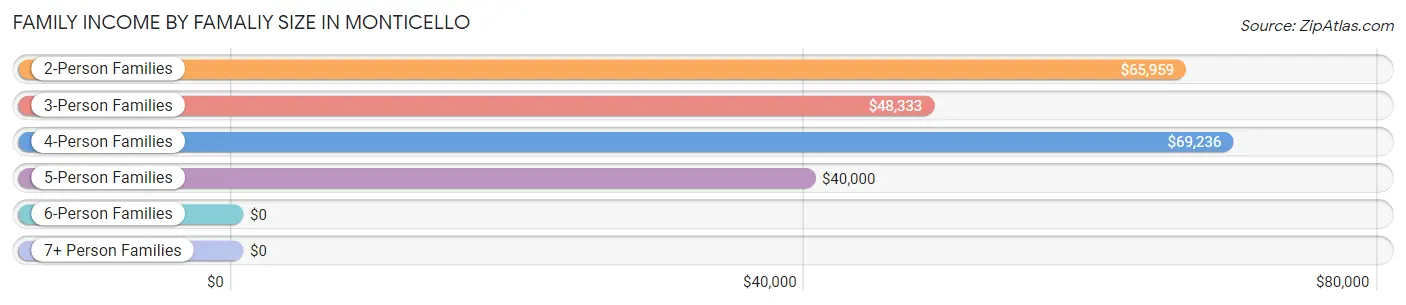
Family Income by Famaliy Size in Monticello
4-person families (156 | 21.5%) account for the highest median family income in Monticello with $69,236 per family, while 2-person families (438 | 60.3%) have the highest median income of $32,980 per family member.
| Income Bracket | # Families | Median Income |
| 2-Person Families | 438 (60.3%) | $65,959 |
| 3-Person Families | 100 (13.8%) | $48,333 |
| 4-Person Families | 156 (21.5%) | $69,236 |
| 5-Person Families | 16 (2.2%) | $40,000 |
| 6-Person Families | 17 (2.3%) | $0 |
| 7+ Person Families | 0 (0.0%) | $0 |
| Total | 727 (100.0%) | $66,471 |
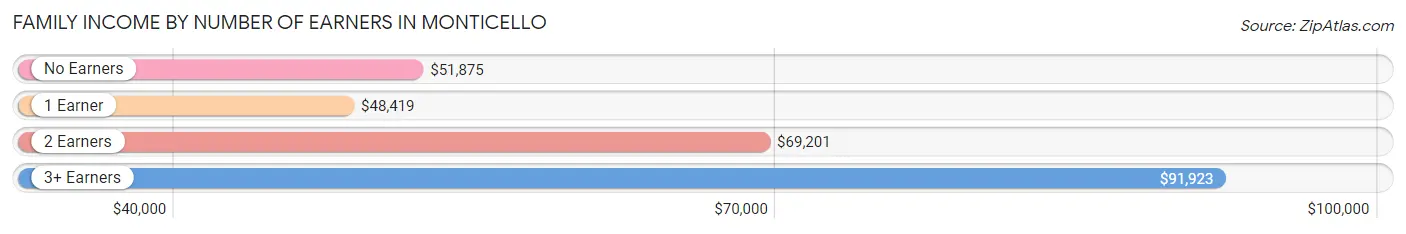
Family Income by Number of Earners in Monticello
The median family income in Monticello is $66,471, with families comprising 3+ earners (60) having the highest median family income of $91,923, while families with 1 earner (275) have the lowest median family income of $48,419, accounting for 8.3% and 37.8% of families, respectively.
| Number of Earners | # Families | Median Income |
| No Earners | 129 (17.7%) | $51,875 |
| 1 Earner | 275 (37.8%) | $48,419 |
| 2 Earners | 263 (36.2%) | $69,201 |
| 3+ Earners | 60 (8.3%) | $91,923 |
| Total | 727 (100.0%) | $66,471 |
Household Income in Monticello
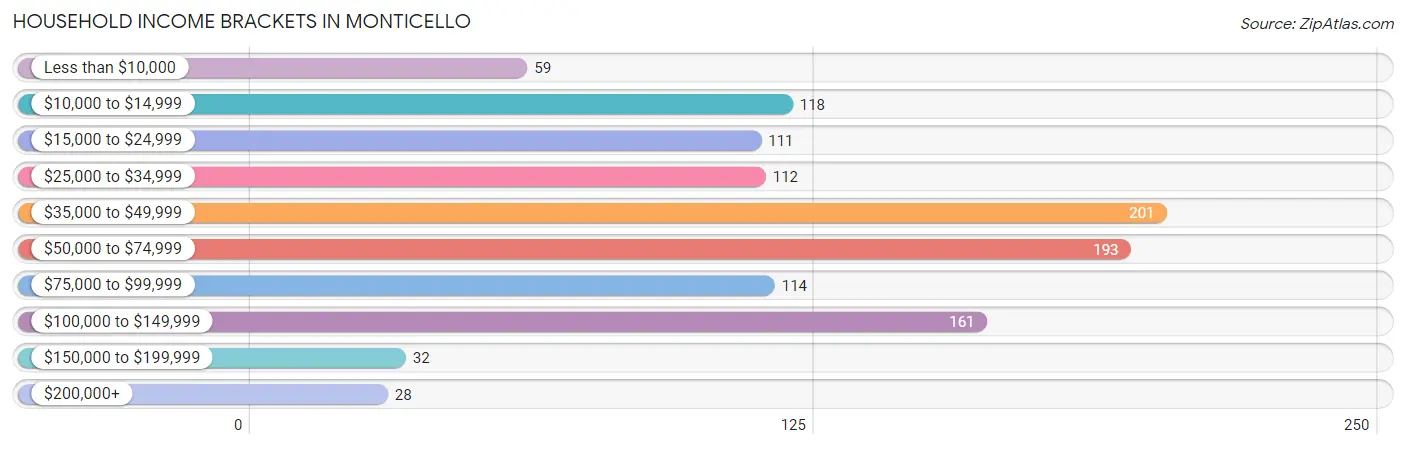
Household Income Brackets in Monticello
With 201 households falling in the category, the $35,000 to $49,999 income range is the most frequent in Monticello, accounting for 17.8% of all households. In contrast, only 28 households (2.5%) fall into the $200,000+ income bracket, making it the least populous group.
| Income Bracket | # Households | % Households |
| Less than $10,000 | 59 | 5.2% |
| $10,000 to $14,999 | 118 | 10.5% |
| $15,000 to $24,999 | 111 | 9.8% |
| $25,000 to $34,999 | 112 | 9.9% |
| $35,000 to $49,999 | 201 | 17.8% |
| $50,000 to $74,999 | 193 | 17.1% |
| $75,000 to $99,999 | 114 | 10.1% |
| $100,000 to $149,999 | 161 | 14.3% |
| $150,000 to $199,999 | 32 | 2.8% |
| $200,000+ | 28 | 2.5% |
Household Income by Householder Age in Monticello
The median household income in Monticello is $48,043, with the highest median household income of $61,250 found in the 65+ years age bracket for the primary householder. A total of 470 households (41.7%) fall into this category. Meanwhile, the 15 to 24 years age bracket for the primary householder has the lowest median household income of $0, with 27 households (2.4%) in this group.
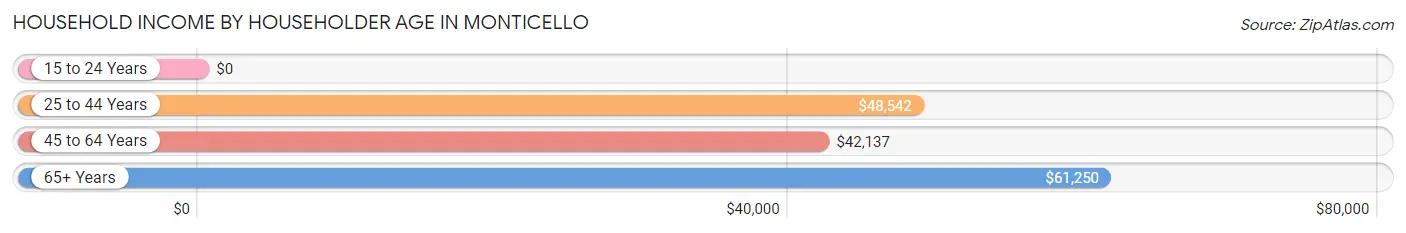
| Income Bracket | # Households | Median Income |
| 15 to 24 Years | 27 (2.4%) | $0 |
| 25 to 44 Years | 168 (14.9%) | $48,542 |
| 45 to 64 Years | 463 (41.0%) | $42,137 |
| 65+ Years | 470 (41.7%) | $61,250 |
| Total | 1,128 (100.0%) | $48,043 |
Poverty in Monticello
Income Below Poverty by Sex and Age in Monticello
With 14.4% poverty level for males and 22.4% for females among the residents of Monticello, 5 year old males and 45 to 54 year old females are the most vulnerable to poverty, with 20 males (100.0%) and 69 females (72.6%) in their respective age groups living below the poverty level.
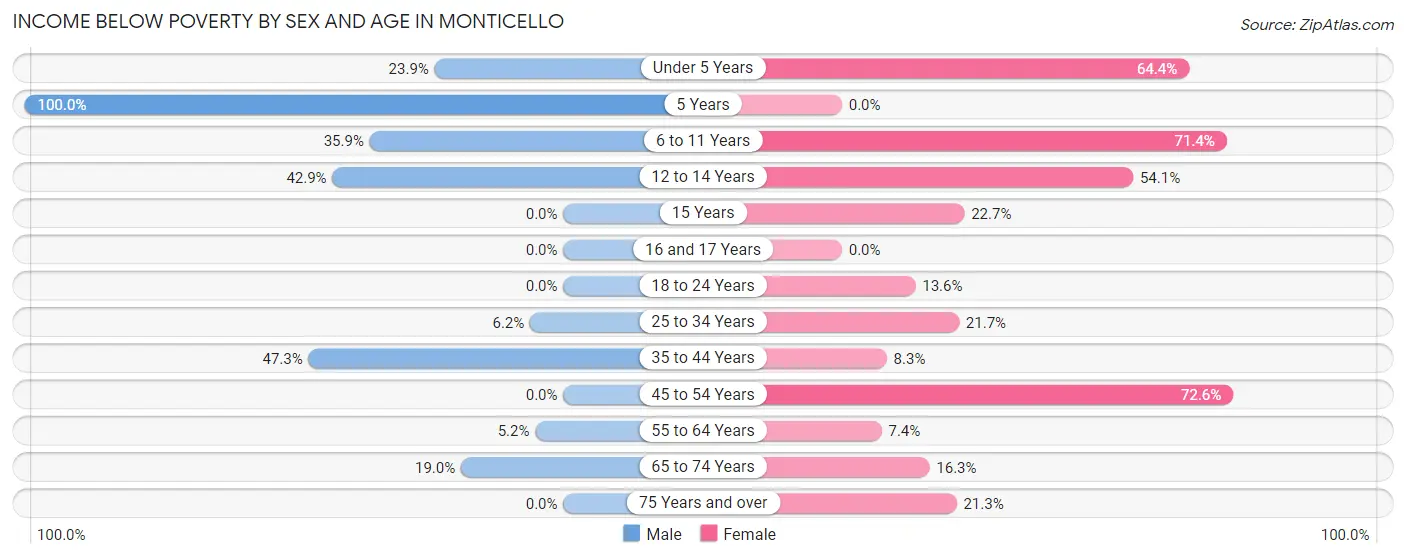
| Age Bracket | Male | Female |
| Under 5 Years | 27 (23.9%) | 29 (64.4%) |
| 5 Years | 20 (100.0%) | 0 (0.0%) |
| 6 to 11 Years | 23 (35.9%) | 40 (71.4%) |
| 12 to 14 Years | 6 (42.9%) | 20 (54.0%) |
| 15 Years | 0 (0.0%) | 5 (22.7%) |
| 16 and 17 Years | 0 (0.0%) | 0 (0.0%) |
| 18 to 24 Years | 0 (0.0%) | 12 (13.6%) |
| 25 to 34 Years | 10 (6.2%) | 20 (21.7%) |
| 35 to 44 Years | 35 (47.3%) | 10 (8.3%) |
| 45 to 54 Years | 0 (0.0%) | 69 (72.6%) |
| 55 to 64 Years | 11 (5.2%) | 24 (7.4%) |
| 65 to 74 Years | 30 (19.0%) | 39 (16.3%) |
| 75 Years and over | 0 (0.0%) | 33 (21.3%) |
| Total | 162 (14.4%) | 301 (22.4%) |
Income Above Poverty by Sex and Age in Monticello
According to the poverty statistics in Monticello, males aged 18 to 24 years and females aged 5 years are the age groups that are most secure financially, with 100.0% of males and 100.0% of females in these age groups living above the poverty line.
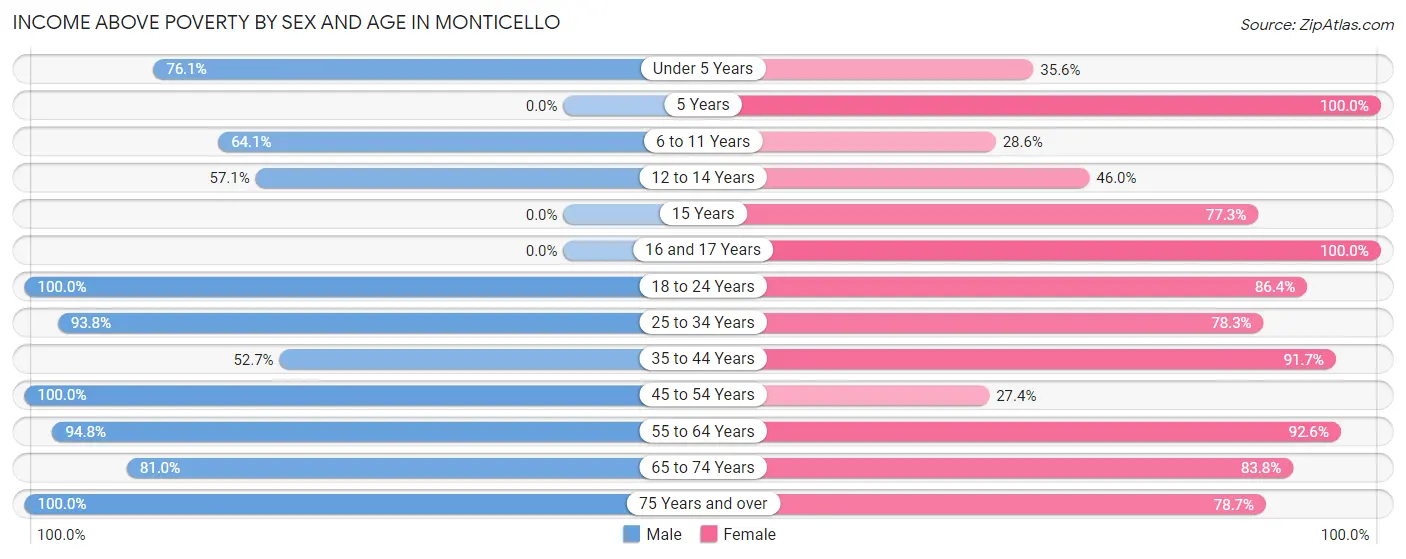
| Age Bracket | Male | Female |
| Under 5 Years | 86 (76.1%) | 16 (35.6%) |
| 5 Years | 0 (0.0%) | 55 (100.0%) |
| 6 to 11 Years | 41 (64.1%) | 16 (28.6%) |
| 12 to 14 Years | 8 (57.1%) | 17 (46.0%) |
| 15 Years | 0 (0.0%) | 17 (77.3%) |
| 16 and 17 Years | 0 (0.0%) | 13 (100.0%) |
| 18 to 24 Years | 91 (100.0%) | 76 (86.4%) |
| 25 to 34 Years | 152 (93.8%) | 72 (78.3%) |
| 35 to 44 Years | 39 (52.7%) | 110 (91.7%) |
| 45 to 54 Years | 101 (100.0%) | 26 (27.4%) |
| 55 to 64 Years | 200 (94.8%) | 301 (92.6%) |
| 65 to 74 Years | 128 (81.0%) | 201 (83.8%) |
| 75 Years and over | 119 (100.0%) | 122 (78.7%) |
| Total | 965 (85.6%) | 1,042 (77.6%) |
Income Below Poverty Among Married-Couple Families in Monticello
The poverty statistics for married-couple families in Monticello show that 5.4% or 25 of the total 463 families live below the poverty line. Families with 3 or 4 children have the highest poverty rate of 28.6%, comprising of 4 families. On the other hand, families with no children have the lowest poverty rate of 0.0%, which includes 0 families.
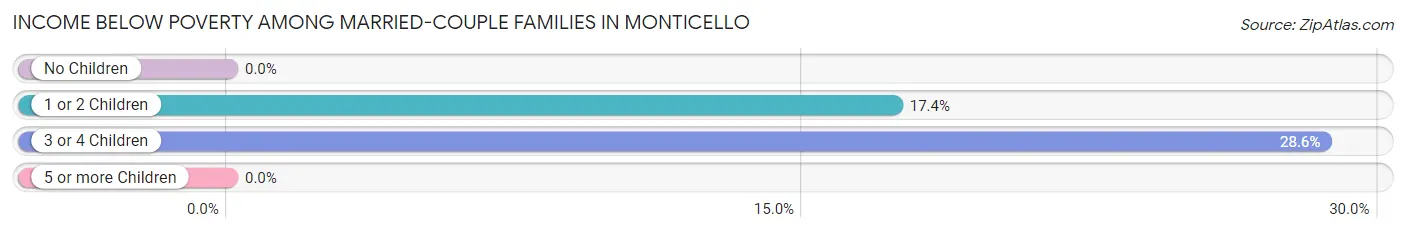
| Children | Above Poverty | Below Poverty |
| No Children | 328 (100.0%) | 0 (0.0%) |
| 1 or 2 Children | 100 (82.6%) | 21 (17.4%) |
| 3 or 4 Children | 10 (71.4%) | 4 (28.6%) |
| 5 or more Children | 0 (0.0%) | 0 (0.0%) |
| Total | 438 (94.6%) | 25 (5.4%) |
Income Below Poverty Among Single-Parent Households in Monticello
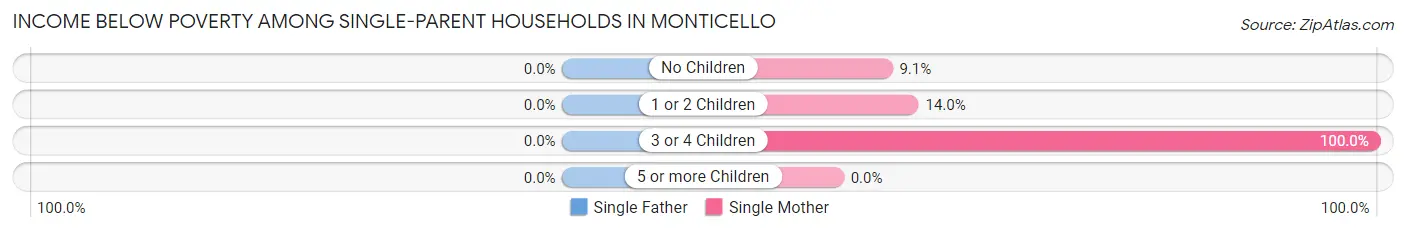
| Children | Single Father | Single Mother |
| No Children | 0 (0.0%) | 16 (9.1%) |
| 1 or 2 Children | 0 (0.0%) | 6 (14.0%) |
| 3 or 4 Children | 0 (0.0%) | 18 (100.0%) |
| 5 or more Children | 0 (0.0%) | 0 (0.0%) |
| Total | 0 (0.0%) | 40 (16.9%) |
Income Below Poverty Among Married-Couple vs Single-Parent Households in Monticello
The poverty data for Monticello shows that 25 of the married-couple family households (5.4%) and 40 of the single-parent households (15.1%) are living below the poverty level. Within the married-couple family households, those with 3 or 4 children have the highest poverty rate, with 4 households (28.6%) falling below the poverty line. Among the single-parent households, those with 3 or 4 children have the highest poverty rate, with 18 household (100.0%) living below poverty.
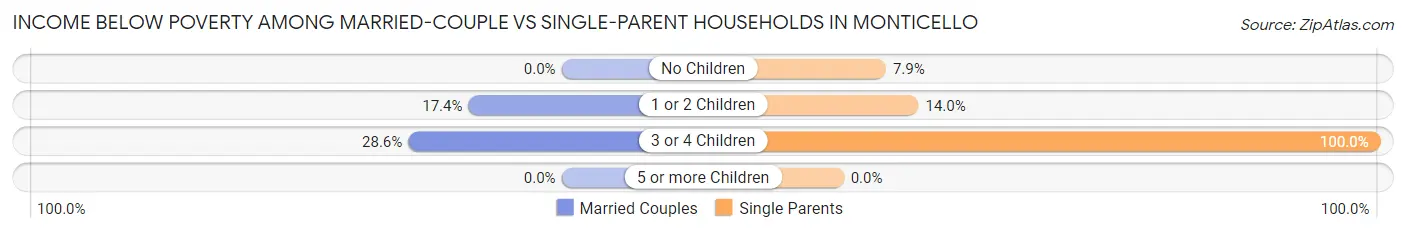
| Children | Married-Couple Families | Single-Parent Households |
| No Children | 0 (0.0%) | 16 (7.9%) |
| 1 or 2 Children | 21 (17.4%) | 6 (14.0%) |
| 3 or 4 Children | 4 (28.6%) | 18 (100.0%) |
| 5 or more Children | 0 (0.0%) | 0 (0.0%) |
| Total | 25 (5.4%) | 40 (15.1%) |
Race in Monticello
The most populous races in Monticello are White / Caucasian (1,332 | 51.4%), Black / African American (1,212 | 46.8%), and Two or more Races (43 | 1.7%).
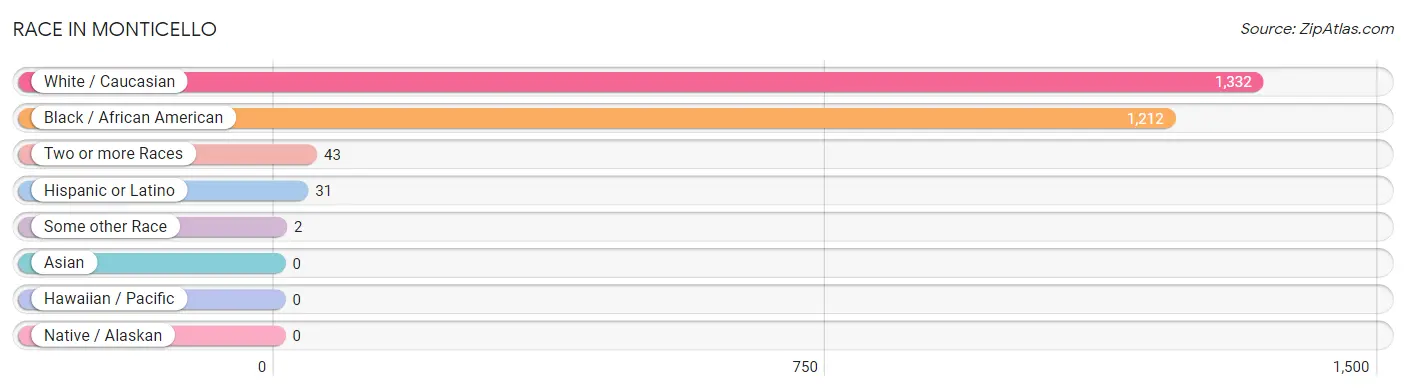
| Race | # Population | % Population |
| Asian | 0 | 0.0% |
| Black / African American | 1,212 | 46.8% |
| Hawaiian / Pacific | 0 | 0.0% |
| Hispanic or Latino | 31 | 1.2% |
| Native / Alaskan | 0 | 0.0% |
| White / Caucasian | 1,332 | 51.4% |
| Two or more Races | 43 | 1.7% |
| Some other Race | 2 | 0.1% |
| Total | 2,589 | 100.0% |
Ancestry in Monticello
The most populous ancestries reported in Monticello are American (333 | 12.9%), English (173 | 6.7%), Irish (136 | 5.2%), German (109 | 4.2%), and Italian (90 | 3.5%), together accounting for 32.5% of all Monticello residents.
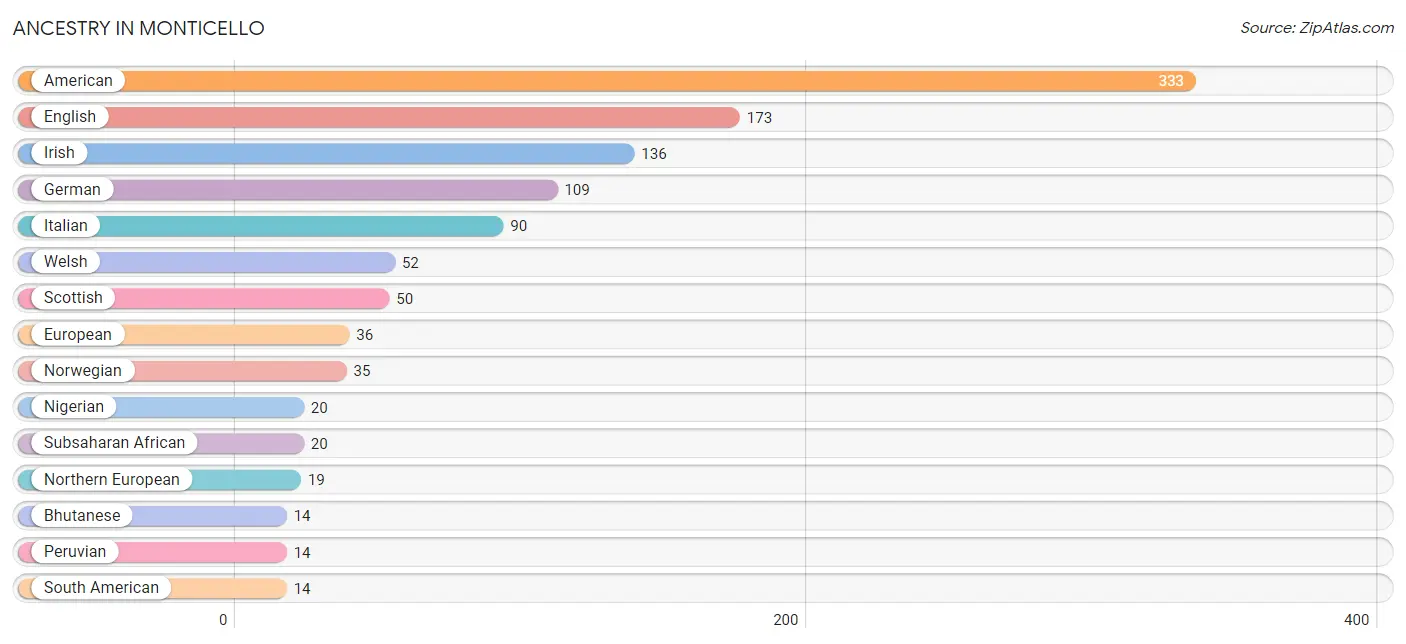
| Ancestry | # Population | % Population |
| American | 333 | 12.9% |
| Bhutanese | 14 | 0.5% |
| British | 6 | 0.2% |
| Cherokee | 7 | 0.3% |
| Cuban | 9 | 0.4% |
| English | 173 | 6.7% |
| European | 36 | 1.4% |
| French | 11 | 0.4% |
| French Canadian | 4 | 0.2% |
| German | 109 | 4.2% |
| Haitian | 11 | 0.4% |
| Irish | 136 | 5.2% |
| Italian | 90 | 3.5% |
| Korean | 13 | 0.5% |
| Mexican | 6 | 0.2% |
| Nigerian | 20 | 0.8% |
| Northern European | 19 | 0.7% |
| Norwegian | 35 | 1.3% |
| Peruvian | 14 | 0.5% |
| Puerto Rican | 2 | 0.1% |
| Russian | 9 | 0.4% |
| Scotch-Irish | 4 | 0.2% |
| Scottish | 50 | 1.9% |
| South American | 14 | 0.5% |
| Subsaharan African | 20 | 0.8% |
| Welsh | 52 | 2.0% | View All 26 Rows |
Immigrants in Monticello
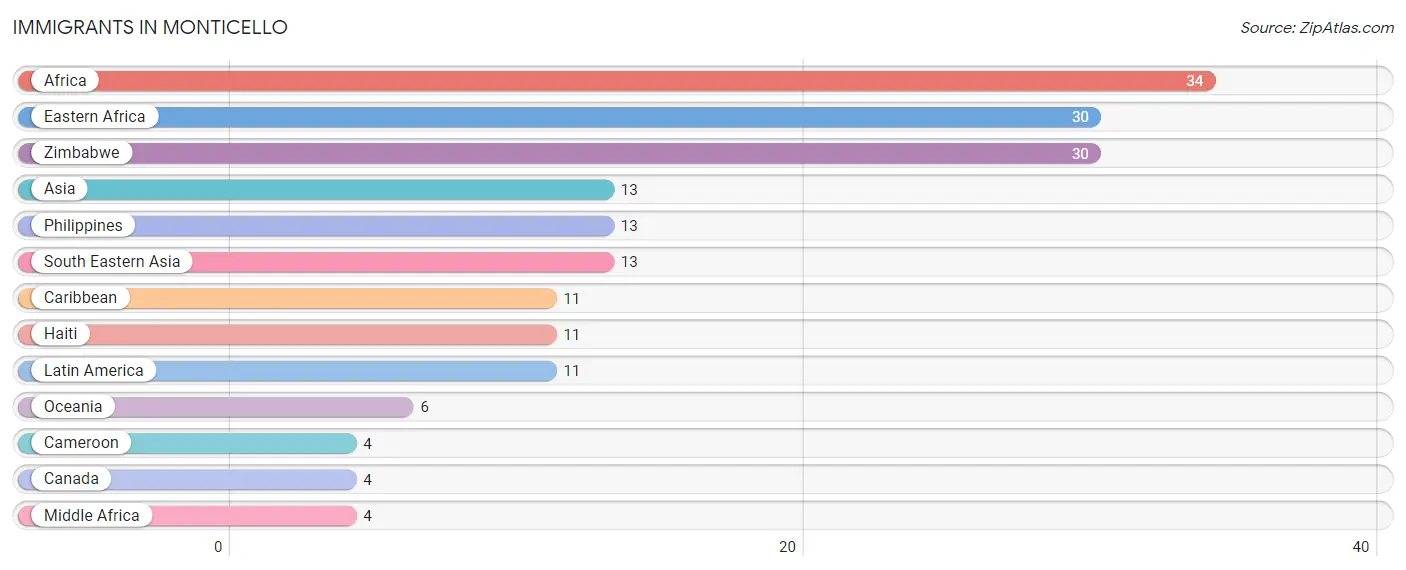
The most numerous immigrant groups reported in Monticello came from Africa (34 | 1.3%), Eastern Africa (30 | 1.2%), Zimbabwe (30 | 1.2%), Asia (13 | 0.5%), and Philippines (13 | 0.5%), together accounting for 4.6% of all Monticello residents.
| Immigration Origin | # Population | % Population |
| Africa | 34 | 1.3% |
| Asia | 13 | 0.5% |
| Cameroon | 4 | 0.2% |
| Canada | 4 | 0.2% |
| Caribbean | 11 | 0.4% |
| Eastern Africa | 30 | 1.2% |
| Haiti | 11 | 0.4% |
| Latin America | 11 | 0.4% |
| Middle Africa | 4 | 0.2% |
| Oceania | 6 | 0.2% |
| Philippines | 13 | 0.5% |
| South Eastern Asia | 13 | 0.5% |
| Zimbabwe | 30 | 1.2% | View All 13 Rows |
Sex and Age in Monticello
Sex and Age in Monticello
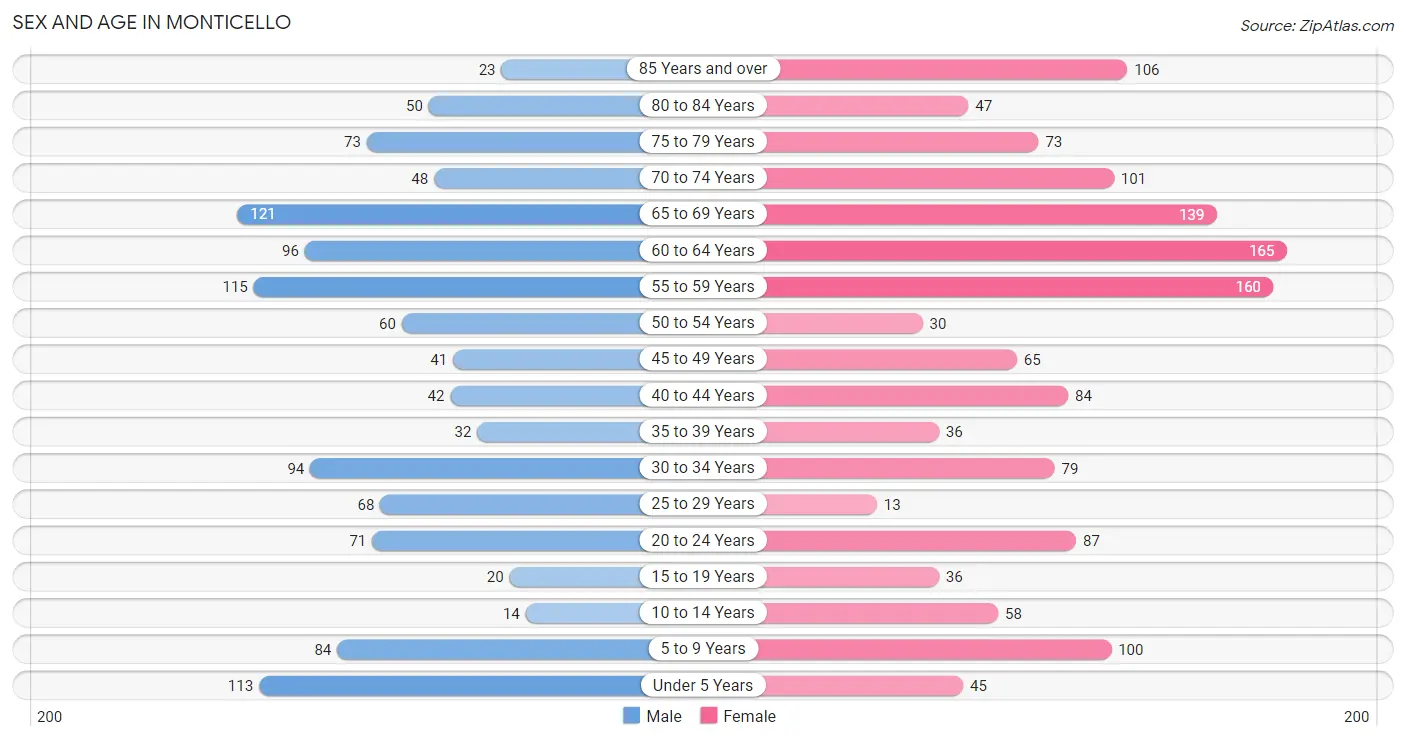
The most populous age groups in Monticello are 65 to 69 Years (121 | 10.4%) for men and 60 to 64 Years (165 | 11.6%) for women.
| Age Bracket | Male | Female |
| Under 5 Years | 113 (9.7%) | 45 (3.2%) |
| 5 to 9 Years | 84 (7.2%) | 100 (7.0%) |
| 10 to 14 Years | 14 (1.2%) | 58 (4.1%) |
| 15 to 19 Years | 20 (1.7%) | 36 (2.5%) |
| 20 to 24 Years | 71 (6.1%) | 87 (6.1%) |
| 25 to 29 Years | 68 (5.8%) | 13 (0.9%) |
| 30 to 34 Years | 94 (8.1%) | 79 (5.6%) |
| 35 to 39 Years | 32 (2.8%) | 36 (2.5%) |
| 40 to 44 Years | 42 (3.6%) | 84 (5.9%) |
| 45 to 49 Years | 41 (3.5%) | 65 (4.6%) |
| 50 to 54 Years | 60 (5.1%) | 30 (2.1%) |
| 55 to 59 Years | 115 (9.9%) | 160 (11.2%) |
| 60 to 64 Years | 96 (8.2%) | 165 (11.6%) |
| 65 to 69 Years | 121 (10.4%) | 139 (9.8%) |
| 70 to 74 Years | 48 (4.1%) | 101 (7.1%) |
| 75 to 79 Years | 73 (6.3%) | 73 (5.1%) |
| 80 to 84 Years | 50 (4.3%) | 47 (3.3%) |
| 85 Years and over | 23 (2.0%) | 106 (7.4%) |
| Total | 1,165 (100.0%) | 1,424 (100.0%) |
Families and Households in Monticello
Median Family Size in Monticello
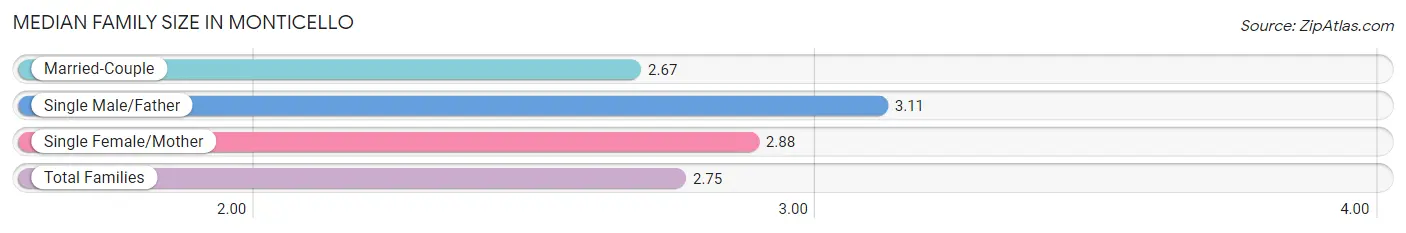
The median family size in Monticello is 2.75 persons per family, with single male/father families (27 | 3.7%) accounting for the largest median family size of 3.11 persons per family. On the other hand, married-couple families (463 | 63.7%) represent the smallest median family size with 2.67 persons per family.
| Family Type | # Families | Family Size |
| Married-Couple | 463 (63.7%) | 2.67 |
| Single Male/Father | 27 (3.7%) | 3.11 |
| Single Female/Mother | 237 (32.6%) | 2.88 |
| Total Families | 727 (100.0%) | 2.75 |
Median Household Size in Monticello
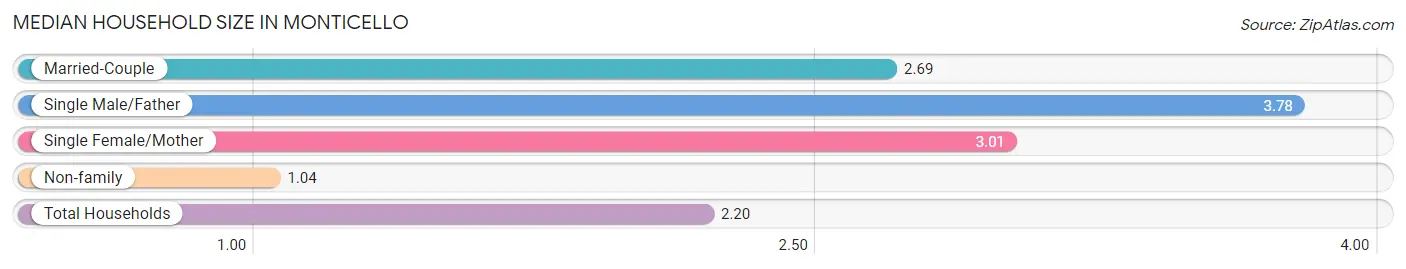
The median household size in Monticello is 2.20 persons per household, with single male/father households (27 | 2.4%) accounting for the largest median household size of 3.78 persons per household. non-family households (401 | 35.5%) represent the smallest median household size with 1.04 persons per household.
| Household Type | # Households | Household Size |
| Married-Couple | 463 (41.0%) | 2.69 |
| Single Male/Father | 27 (2.4%) | 3.78 |
| Single Female/Mother | 237 (21.0%) | 3.01 |
| Non-family | 401 (35.5%) | 1.04 |
| Total Households | 1,128 (100.0%) | 2.20 |
Household Size by Marriage Status in Monticello
Out of a total of 1,128 households in Monticello, 727 (64.4%) are family households, while 401 (35.5%) are nonfamily households. The most numerous type of family households are 2-person households, comprising 438, and the most common type of nonfamily households are 1-person households, comprising 384.
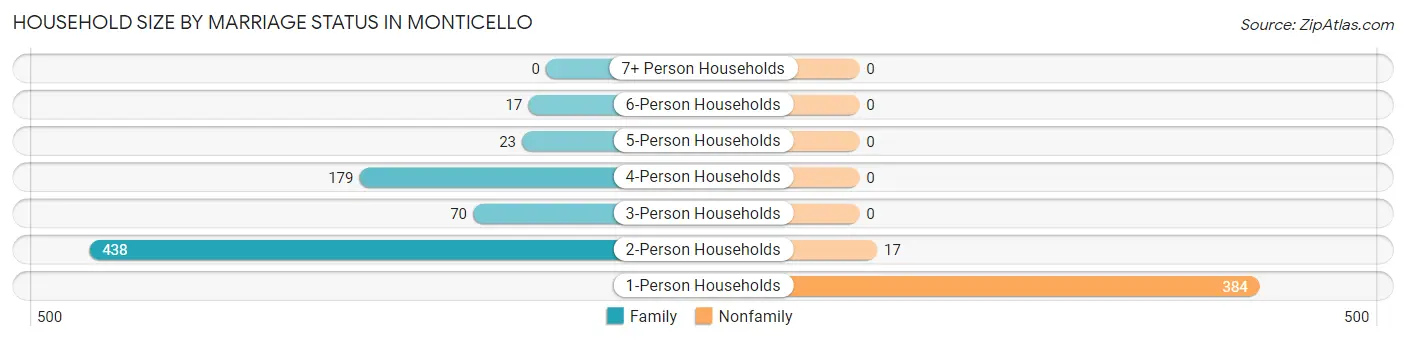
| Household Size | Family Households | Nonfamily Households |
| 1-Person Households | - | 384 (34.0%) |
| 2-Person Households | 438 (38.8%) | 17 (1.5%) |
| 3-Person Households | 70 (6.2%) | 0 (0.0%) |
| 4-Person Households | 179 (15.9%) | 0 (0.0%) |
| 5-Person Households | 23 (2.0%) | 0 (0.0%) |
| 6-Person Households | 17 (1.5%) | 0 (0.0%) |
| 7+ Person Households | 0 (0.0%) | 0 (0.0%) |
| Total | 727 (64.4%) | 401 (35.5%) |
Female Fertility in Monticello
Fertility by Age in Monticello
Average fertility rate in Monticello is 63.0 births per 1,000 women. Women in the age bracket of 20 to 34 years have the highest fertility rate with 140.0 births per 1,000 women. Women in the age bracket of 20 to 34 years acount for 100.0% of all women with births.
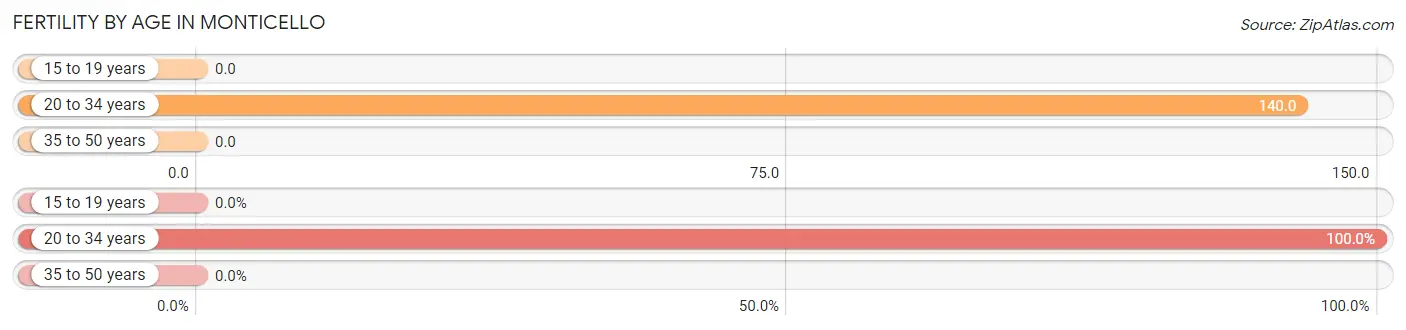
| Age Bracket | Women with Births | Births / 1,000 Women |
| 15 to 19 years | 0 (0.0%) | 0.0 |
| 20 to 34 years | 25 (100.0%) | 140.0 |
| 35 to 50 years | 0 (0.0%) | 0.0 |
| Total | 25 (100.0%) | 63.0 |
Fertility by Age by Marriage Status in Monticello
52.0% of women with births (25) in Monticello are married. The highest percentage of unmarried women with births falls into 20 to 34 years age bracket with 48.0% of them unmarried at the time of birth, while the lowest percentage of unmarried women with births belong to 20 to 34 years age bracket with 48.0% of them unmarried.
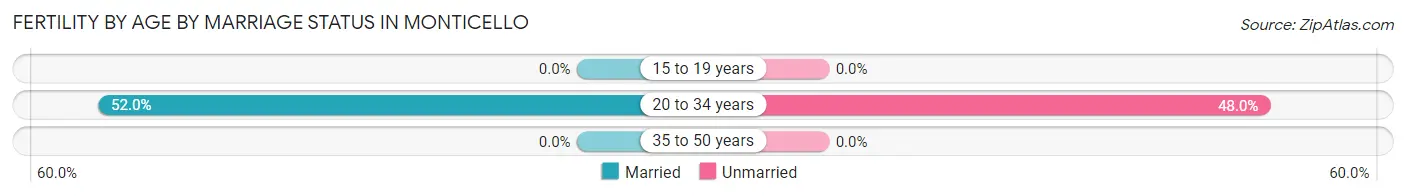
| Age Bracket | Married | Unmarried |
| 15 to 19 years | 0 (0.0%) | 0 (0.0%) |
| 20 to 34 years | 13 (52.0%) | 12 (48.0%) |
| 35 to 50 years | 0 (0.0%) | 0 (0.0%) |
| Total | 13 (52.0%) | 12 (48.0%) |
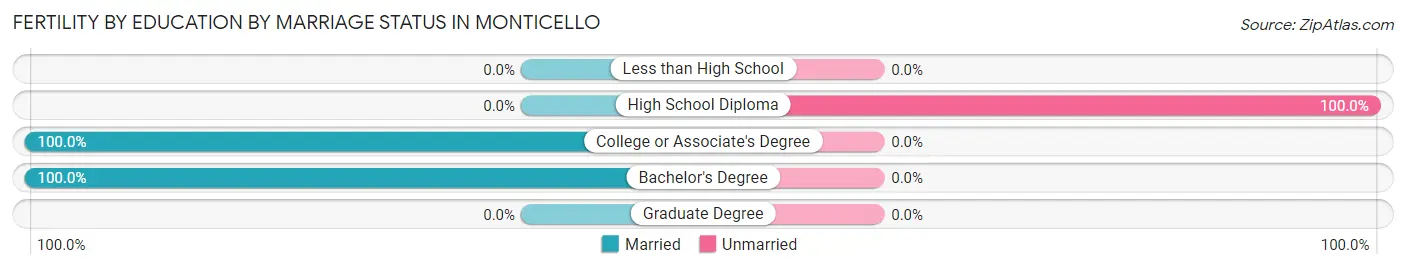
Fertility by Education in Monticello
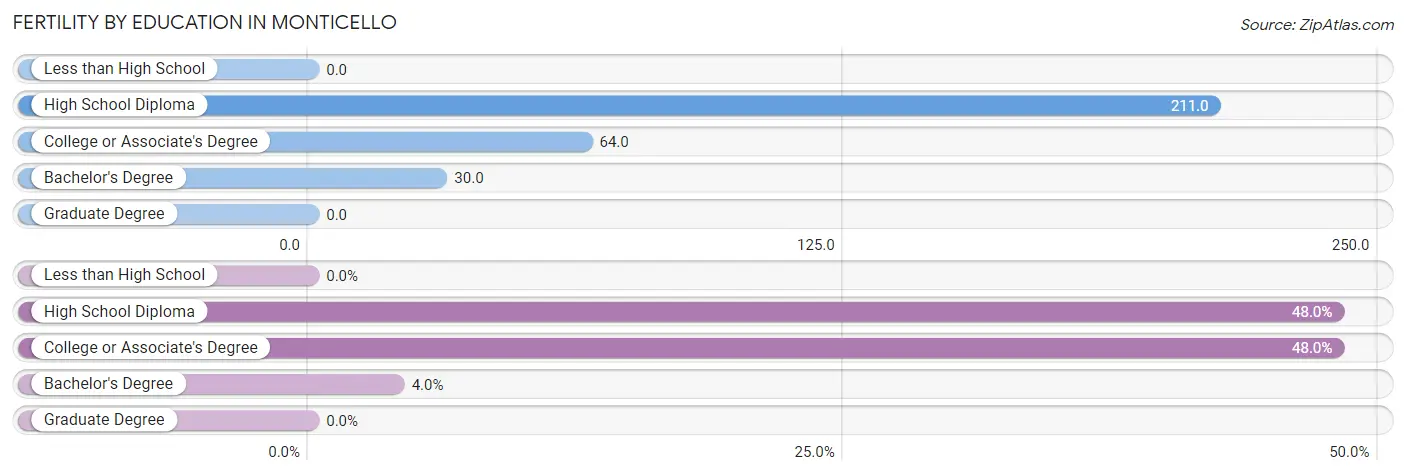
| Educational Attainment | Women with Births | Births / 1,000 Women |
| Less than High School | 0 (0.0%) | 0.0 |
| High School Diploma | 12 (48.0%) | 211.0 |
| College or Associate's Degree | 12 (48.0%) | 64.0 |
| Bachelor's Degree | 1 (4.0%) | 30.0 |
| Graduate Degree | 0 (0.0%) | 0.0 |
| Total | 25 (100.0%) | 63.0 |
Fertility by Education by Marriage Status in Monticello
48.0% of women with births in Monticello are unmarried. Women with the educational attainment of college or associate's degree are most likely to be married with 100.0% of them married at childbirth, while women with the educational attainment of high school diploma are least likely to be married with 100.0% of them unmarried at childbirth.
| Educational Attainment | Married | Unmarried |
| Less than High School | 0 (0.0%) | 0 (0.0%) |
| High School Diploma | 0 (0.0%) | 12 (100.0%) |
| College or Associate's Degree | 12 (100.0%) | 0 (0.0%) |
| Bachelor's Degree | 1 (100.0%) | 0 (0.0%) |
| Graduate Degree | 0 (0.0%) | 0 (0.0%) |
| Total | 13 (52.0%) | 12 (48.0%) |
Employment Characteristics in Monticello
Employment by Class of Employer in Monticello
Among the 1,072 employed individuals in Monticello, private company employees (607 | 56.6%), state government employees (189 | 17.6%), and local government employees (120 | 11.2%) make up the most common classes of employment.
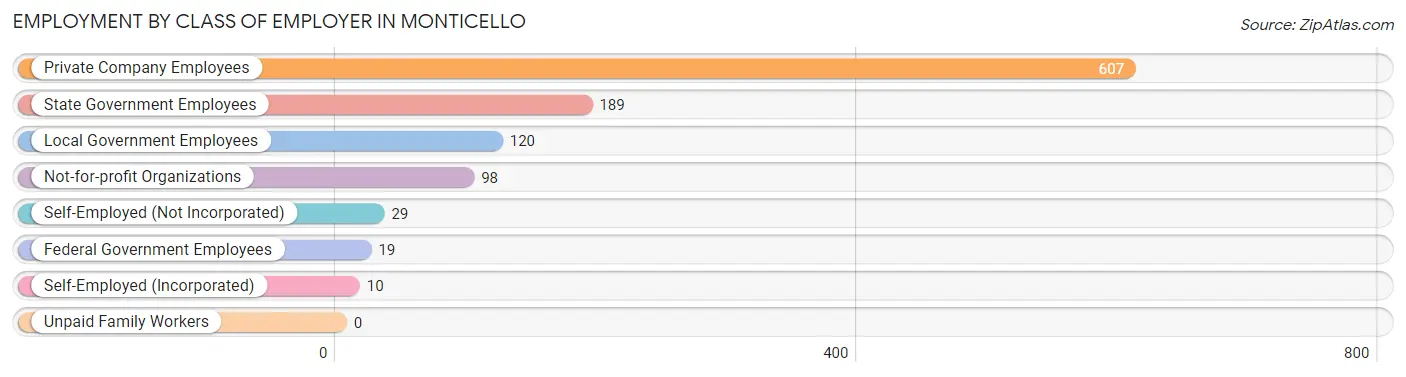
| Employer Class | # Employees | % Employees |
| Private Company Employees | 607 | 56.6% |
| Self-Employed (Incorporated) | 10 | 0.9% |
| Self-Employed (Not Incorporated) | 29 | 2.7% |
| Not-for-profit Organizations | 98 | 9.1% |
| Local Government Employees | 120 | 11.2% |
| State Government Employees | 189 | 17.6% |
| Federal Government Employees | 19 | 1.8% |
| Unpaid Family Workers | 0 | 0.0% |
| Total | 1,072 | 100.0% |
Employment Status by Age in Monticello
According to the labor force statistics for Monticello, out of the total population over 16 years of age (2,153), 50.8% or 1,094 individuals are in the labor force, with 2.0% or 22 of them unemployed. The age group with the highest labor force participation rate is 25 to 29 years, with 85.2% or 69 individuals in the labor force. Within the labor force, the 16 to 19 years age range has the highest percentage of unemployed individuals, with 38.9% or 7 of them being unemployed.
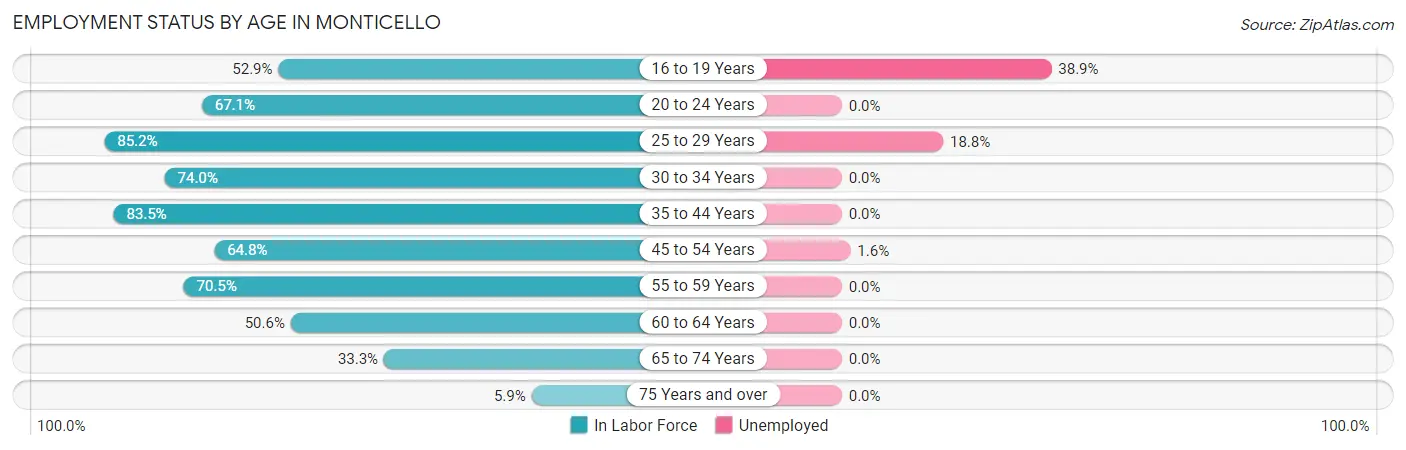
| Age Bracket | In Labor Force | Unemployed |
| 16 to 19 Years | 18 (52.9%) | 7 (38.9%) |
| 20 to 24 Years | 106 (67.1%) | 0 (0.0%) |
| 25 to 29 Years | 69 (85.2%) | 13 (18.8%) |
| 30 to 34 Years | 128 (74.0%) | 0 (0.0%) |
| 35 to 44 Years | 162 (83.5%) | 0 (0.0%) |
| 45 to 54 Years | 127 (64.8%) | 2 (1.6%) |
| 55 to 59 Years | 194 (70.5%) | 0 (0.0%) |
| 60 to 64 Years | 132 (50.6%) | 0 (0.0%) |
| 65 to 74 Years | 136 (33.3%) | 0 (0.0%) |
| 75 Years and over | 22 (5.9%) | 0 (0.0%) |
| Total | 1,094 (50.8%) | 22 (2.0%) |
Employment Status by Educational Attainment in Monticello
According to labor force statistics for Monticello, 68.8% of individuals (812) out of the total population between 25 and 64 years of age (1,180) are in the labor force, with 1.8% or 15 of them being unemployed. The group with the highest labor force participation rate are those with the educational attainment of high school diploma, with 78.9% or 261 individuals in the labor force. Within the labor force, individuals with less than high school education have the highest percentage of unemployment, with 18.2% or 2 of them being unemployed.
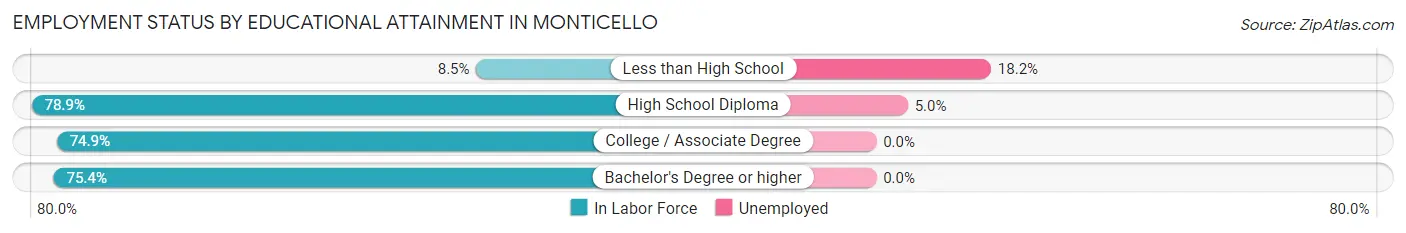
| Educational Attainment | In Labor Force | Unemployed |
| Less than High School | 11 (8.5%) | 24 (18.2%) |
| High School Diploma | 261 (78.9%) | 17 (5.0%) |
| College / Associate Degree | 271 (74.9%) | 0 (0.0%) |
| Bachelor's Degree or higher | 269 (75.4%) | 0 (0.0%) |
| Total | 812 (68.8%) | 21 (1.8%) |
Employment Occupations by Sex in Monticello
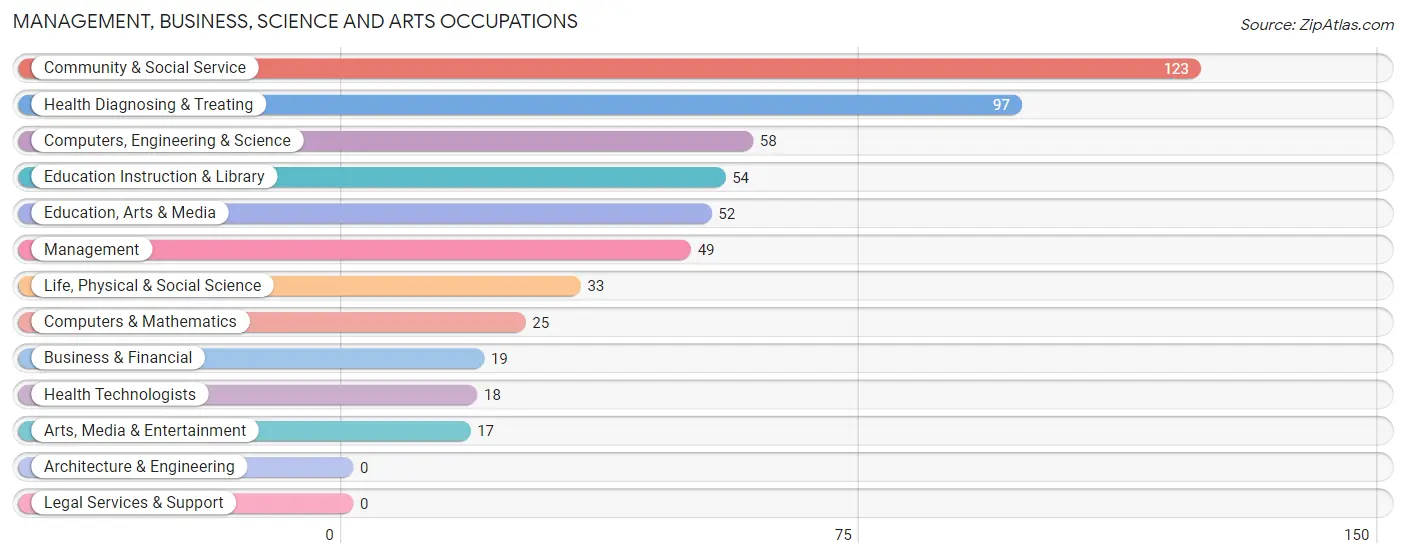
Management, Business, Science and Arts Occupations
The most common Management, Business, Science and Arts occupations in Monticello are Community & Social Service (123 | 11.5%), Health Diagnosing & Treating (97 | 9.0%), Computers, Engineering & Science (58 | 5.4%), Education Instruction & Library (54 | 5.0%), and Education, Arts & Media (52 | 4.9%).
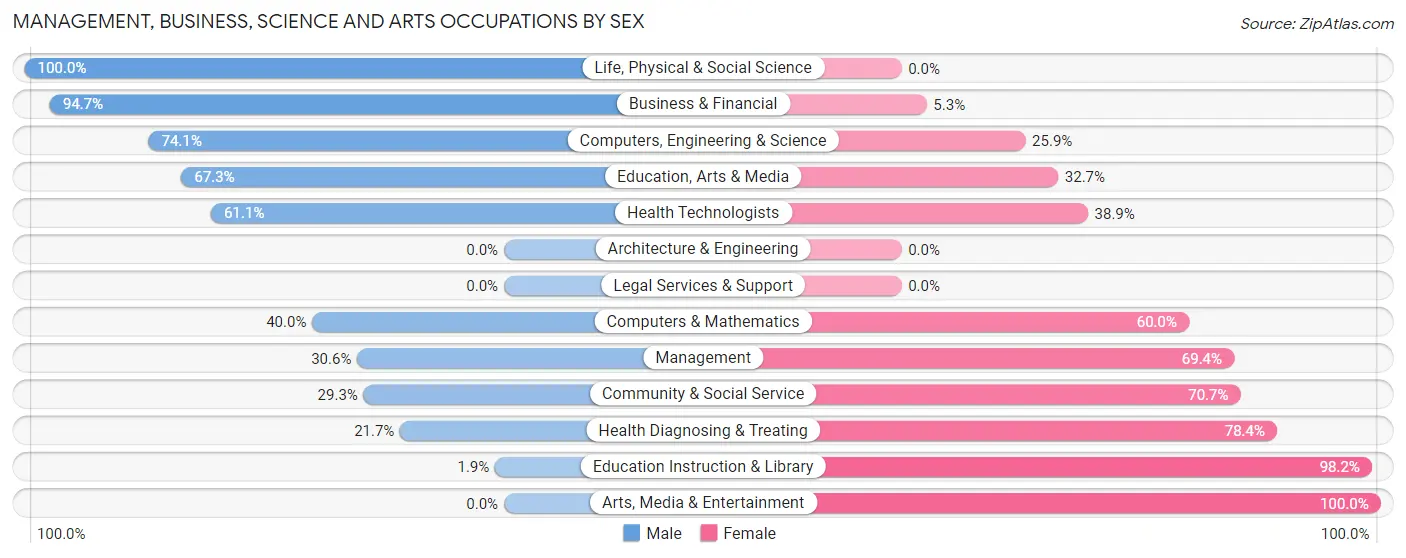
Management, Business, Science and Arts Occupations by Sex
Within the Management, Business, Science and Arts occupations in Monticello, the most male-oriented occupations are Life, Physical & Social Science (100.0%), Business & Financial (94.7%), and Computers, Engineering & Science (74.1%), while the most female-oriented occupations are Arts, Media & Entertainment (100.0%), Education Instruction & Library (98.2%), and Health Diagnosing & Treating (78.3%).
| Occupation | Male | Female |
| Management | 15 (30.6%) | 34 (69.4%) |
| Business & Financial | 18 (94.7%) | 1 (5.3%) |
| Computers, Engineering & Science | 43 (74.1%) | 15 (25.9%) |
| Computers & Mathematics | 10 (40.0%) | 15 (60.0%) |
| Architecture & Engineering | 0 (0.0%) | 0 (0.0%) |
| Life, Physical & Social Science | 33 (100.0%) | 0 (0.0%) |
| Community & Social Service | 36 (29.3%) | 87 (70.7%) |
| Education, Arts & Media | 35 (67.3%) | 17 (32.7%) |
| Legal Services & Support | 0 (0.0%) | 0 (0.0%) |
| Education Instruction & Library | 1 (1.8%) | 53 (98.2%) |
| Arts, Media & Entertainment | 0 (0.0%) | 17 (100.0%) |
| Health Diagnosing & Treating | 21 (21.6%) | 76 (78.3%) |
| Health Technologists | 11 (61.1%) | 7 (38.9%) |
| Total (Category) | 133 (38.4%) | 213 (61.6%) |
| Total (Overall) | 556 (51.9%) | 516 (48.1%) |
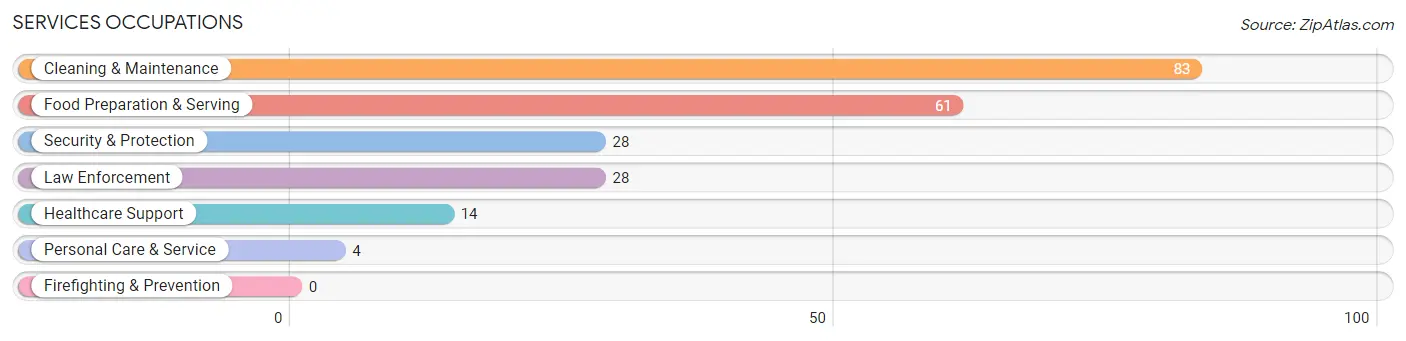
Services Occupations
The most common Services occupations in Monticello are Cleaning & Maintenance (83 | 7.7%), Food Preparation & Serving (61 | 5.7%), Security & Protection (28 | 2.6%), Law Enforcement (28 | 2.6%), and Healthcare Support (14 | 1.3%).
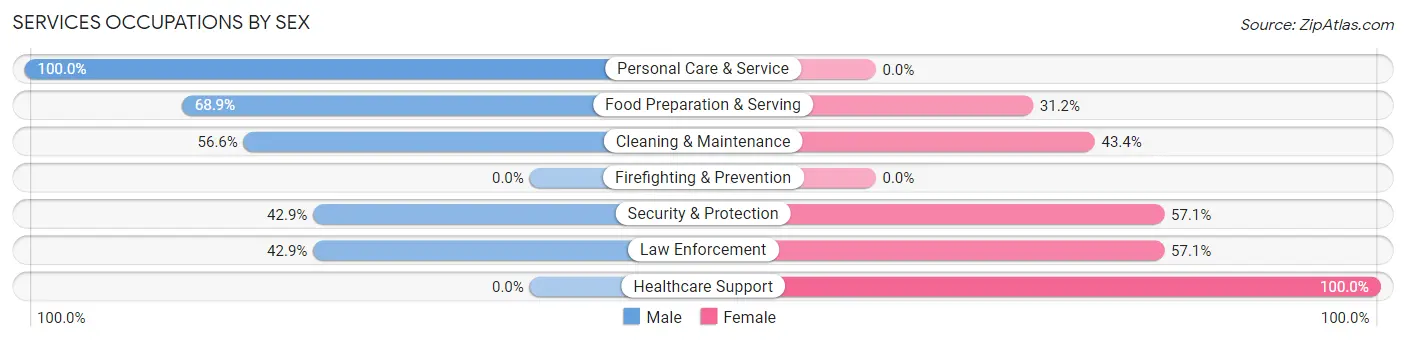
Services Occupations by Sex
Within the Services occupations in Monticello, the most male-oriented occupations are Personal Care & Service (100.0%), Food Preparation & Serving (68.9%), and Cleaning & Maintenance (56.6%), while the most female-oriented occupations are Healthcare Support (100.0%), Security & Protection (57.1%), and Law Enforcement (57.1%).
| Occupation | Male | Female |
| Healthcare Support | 0 (0.0%) | 14 (100.0%) |
| Security & Protection | 12 (42.9%) | 16 (57.1%) |
| Firefighting & Prevention | 0 (0.0%) | 0 (0.0%) |
| Law Enforcement | 12 (42.9%) | 16 (57.1%) |
| Food Preparation & Serving | 42 (68.9%) | 19 (31.1%) |
| Cleaning & Maintenance | 47 (56.6%) | 36 (43.4%) |
| Personal Care & Service | 4 (100.0%) | 0 (0.0%) |
| Total (Category) | 105 (55.3%) | 85 (44.7%) |
| Total (Overall) | 556 (51.9%) | 516 (48.1%) |
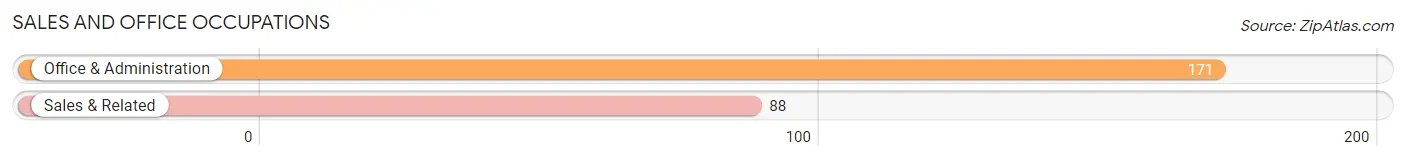
Sales and Office Occupations
The most common Sales and Office occupations in Monticello are Office & Administration (171 | 16.0%), and Sales & Related (88 | 8.2%).
Sales and Office Occupations by Sex
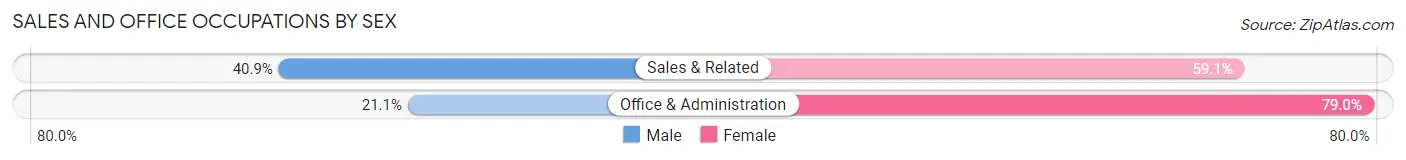
| Occupation | Male | Female |
| Sales & Related | 36 (40.9%) | 52 (59.1%) |
| Office & Administration | 36 (21.0%) | 135 (78.9%) |
| Total (Category) | 72 (27.8%) | 187 (72.2%) |
| Total (Overall) | 556 (51.9%) | 516 (48.1%) |
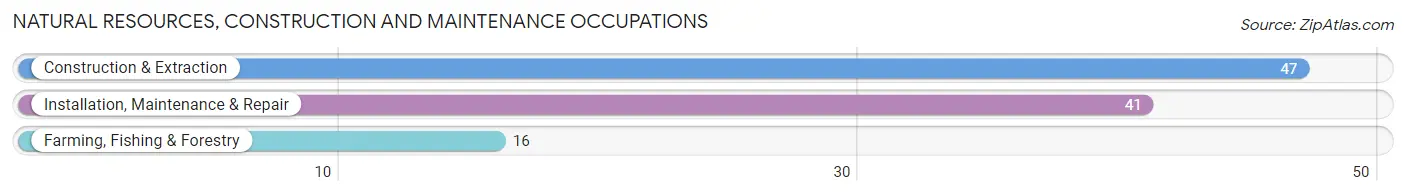
Natural Resources, Construction and Maintenance Occupations
The most common Natural Resources, Construction and Maintenance occupations in Monticello are Construction & Extraction (47 | 4.4%), Installation, Maintenance & Repair (41 | 3.8%), and Farming, Fishing & Forestry (16 | 1.5%).
Natural Resources, Construction and Maintenance Occupations by Sex
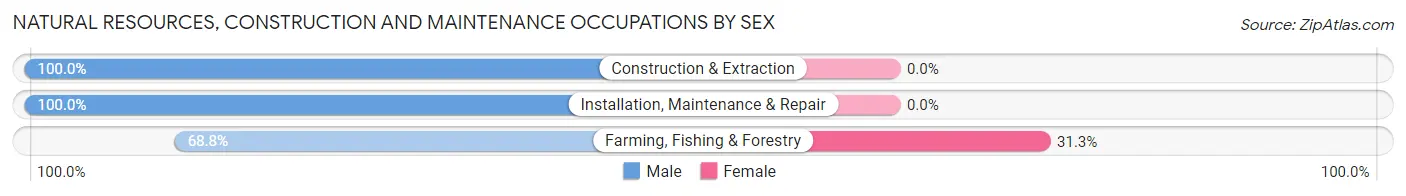
| Occupation | Male | Female |
| Farming, Fishing & Forestry | 11 (68.8%) | 5 (31.2%) |
| Construction & Extraction | 47 (100.0%) | 0 (0.0%) |
| Installation, Maintenance & Repair | 41 (100.0%) | 0 (0.0%) |
| Total (Category) | 99 (95.2%) | 5 (4.8%) |
| Total (Overall) | 556 (51.9%) | 516 (48.1%) |
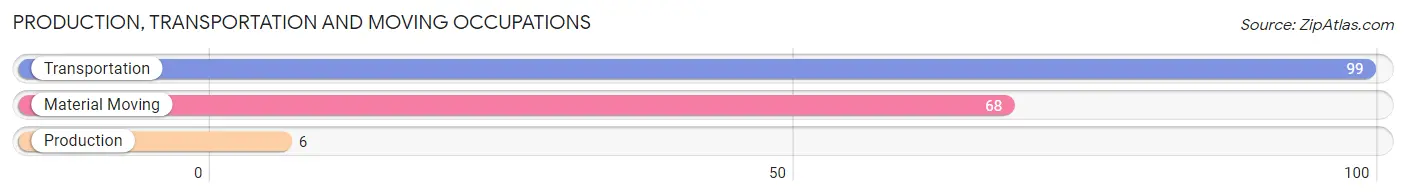
Production, Transportation and Moving Occupations
The most common Production, Transportation and Moving occupations in Monticello are Transportation (99 | 9.2%), Material Moving (68 | 6.3%), and Production (6 | 0.6%).
Production, Transportation and Moving Occupations by Sex
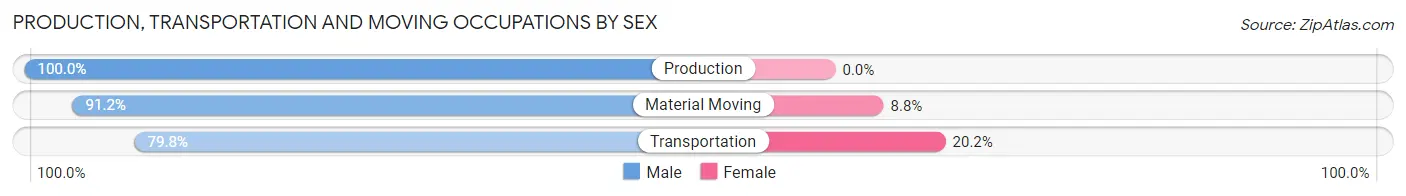
| Occupation | Male | Female |
| Production | 6 (100.0%) | 0 (0.0%) |
| Transportation | 79 (79.8%) | 20 (20.2%) |
| Material Moving | 62 (91.2%) | 6 (8.8%) |
| Total (Category) | 147 (85.0%) | 26 (15.0%) |
| Total (Overall) | 556 (51.9%) | 516 (48.1%) |
Employment Industries by Sex in Monticello
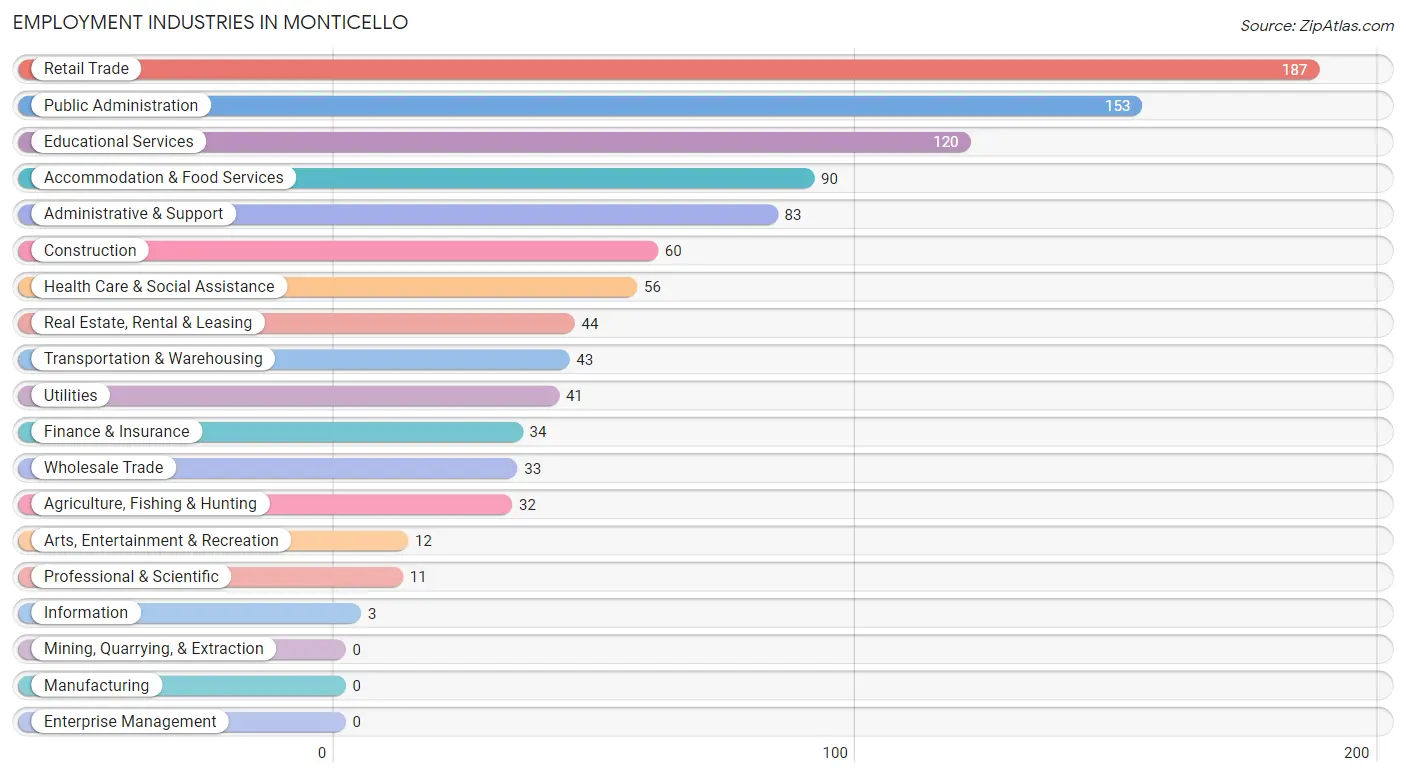
Employment Industries in Monticello
The major employment industries in Monticello include Retail Trade (187 | 17.4%), Public Administration (153 | 14.3%), Educational Services (120 | 11.2%), Accommodation & Food Services (90 | 8.4%), and Administrative & Support (83 | 7.7%).
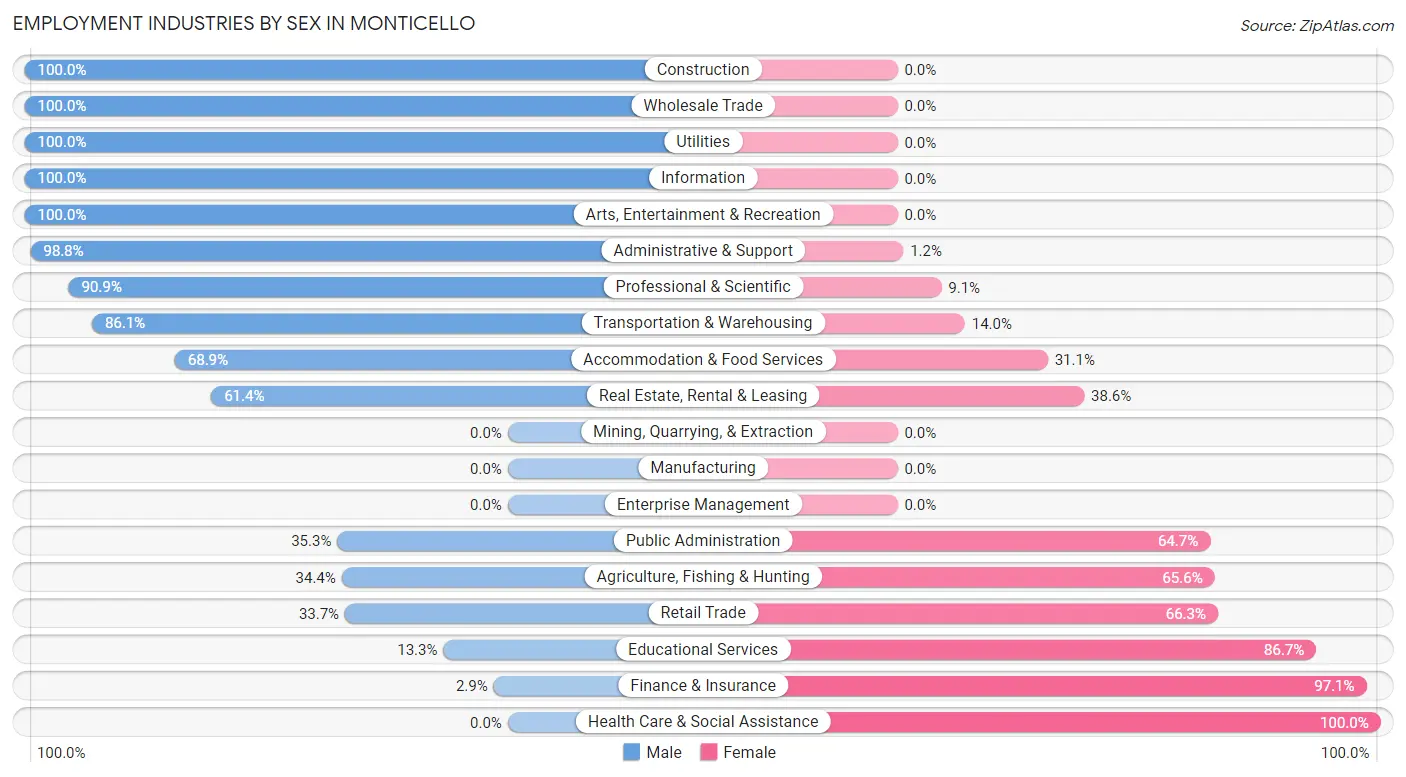
Employment Industries by Sex in Monticello
The Monticello industries that see more men than women are Construction (100.0%), Wholesale Trade (100.0%), and Utilities (100.0%), whereas the industries that tend to have a higher number of women are Health Care & Social Assistance (100.0%), Finance & Insurance (97.1%), and Educational Services (86.7%).
| Industry | Male | Female |
| Agriculture, Fishing & Hunting | 11 (34.4%) | 21 (65.6%) |
| Mining, Quarrying, & Extraction | 0 (0.0%) | 0 (0.0%) |
| Construction | 60 (100.0%) | 0 (0.0%) |
| Manufacturing | 0 (0.0%) | 0 (0.0%) |
| Wholesale Trade | 33 (100.0%) | 0 (0.0%) |
| Retail Trade | 63 (33.7%) | 124 (66.3%) |
| Transportation & Warehousing | 37 (86.1%) | 6 (14.0%) |
| Utilities | 41 (100.0%) | 0 (0.0%) |
| Information | 3 (100.0%) | 0 (0.0%) |
| Finance & Insurance | 1 (2.9%) | 33 (97.1%) |
| Real Estate, Rental & Leasing | 27 (61.4%) | 17 (38.6%) |
| Professional & Scientific | 10 (90.9%) | 1 (9.1%) |
| Enterprise Management | 0 (0.0%) | 0 (0.0%) |
| Administrative & Support | 82 (98.8%) | 1 (1.2%) |
| Educational Services | 16 (13.3%) | 104 (86.7%) |
| Health Care & Social Assistance | 0 (0.0%) | 56 (100.0%) |
| Arts, Entertainment & Recreation | 12 (100.0%) | 0 (0.0%) |
| Accommodation & Food Services | 62 (68.9%) | 28 (31.1%) |
| Public Administration | 54 (35.3%) | 99 (64.7%) |
| Total | 556 (51.9%) | 516 (48.1%) |
Education in Monticello
School Enrollment in Monticello
The most common levels of schooling among the 434 students in Monticello are elementary school (101 | 23.3%), high school (74 | 17.1%), and middle school (62 | 14.3%).
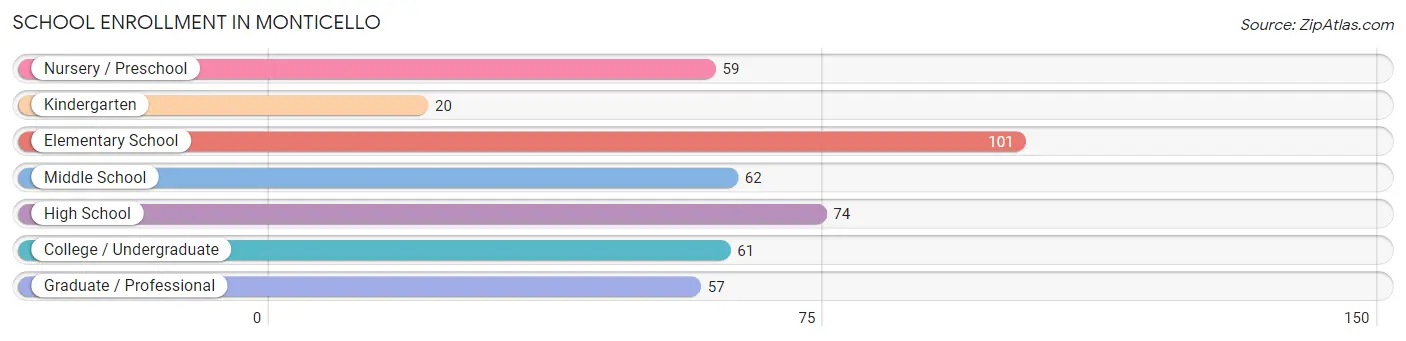
| School Level | # Students | % Students |
| Nursery / Preschool | 59 | 13.6% |
| Kindergarten | 20 | 4.6% |
| Elementary School | 101 | 23.3% |
| Middle School | 62 | 14.3% |
| High School | 74 | 17.1% |
| College / Undergraduate | 61 | 14.1% |
| Graduate / Professional | 57 | 13.1% |
| Total | 434 | 100.0% |
School Enrollment by Age by Funding Source in Monticello
Out of a total of 434 students who are enrolled in schools in Monticello, 166 (38.2%) attend a private institution, while the remaining 268 (61.8%) are enrolled in public schools. The age group of 18 to 19 year olds has the highest likelihood of being enrolled in private schools, with 10 (90.9% in the age bracket) enrolled. Conversely, the age group of 25 to 34 year olds has the lowest likelihood of being enrolled in a private school, with 31 (100.0% in the age bracket) attending a public institution.
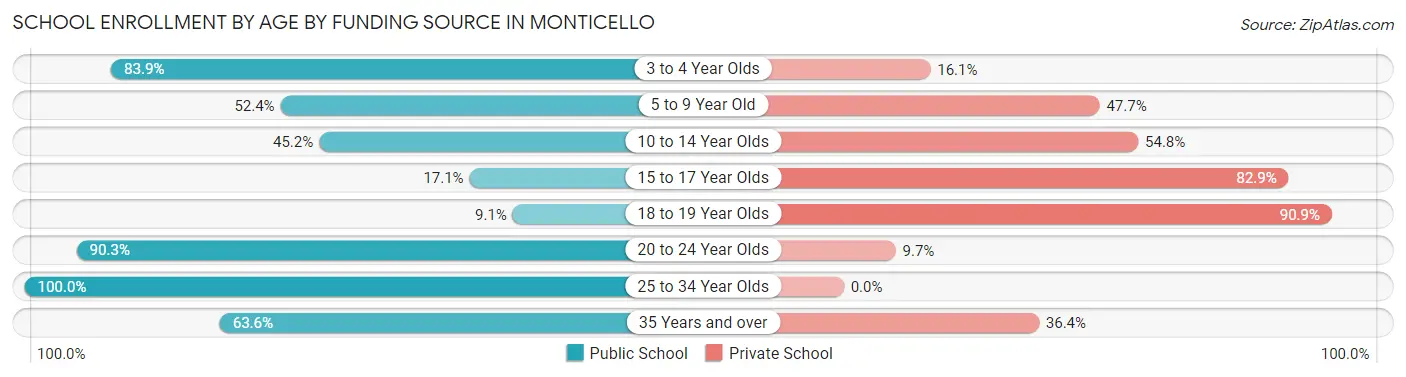
| Age Bracket | Public School | Private School |
| 3 to 4 Year Olds | 26 (83.9%) | 5 (16.1%) |
| 5 to 9 Year Old | 78 (52.3%) | 71 (47.6%) |
| 10 to 14 Year Olds | 28 (45.2%) | 34 (54.8%) |
| 15 to 17 Year Olds | 6 (17.1%) | 29 (82.9%) |
| 18 to 19 Year Olds | 1 (9.1%) | 10 (90.9%) |
| 20 to 24 Year Olds | 84 (90.3%) | 9 (9.7%) |
| 25 to 34 Year Olds | 31 (100.0%) | 0 (0.0%) |
| 35 Years and over | 14 (63.6%) | 8 (36.4%) |
| Total | 268 (61.8%) | 166 (38.2%) |
Educational Attainment by Field of Study in Monticello
Education (98 | 17.2%), business (84 | 14.8%), social sciences (78 | 13.7%), psychology (65 | 11.4%), and science & technology (49 | 8.6%) are the most common fields of study among 568 individuals in Monticello who have obtained a bachelor's degree or higher.
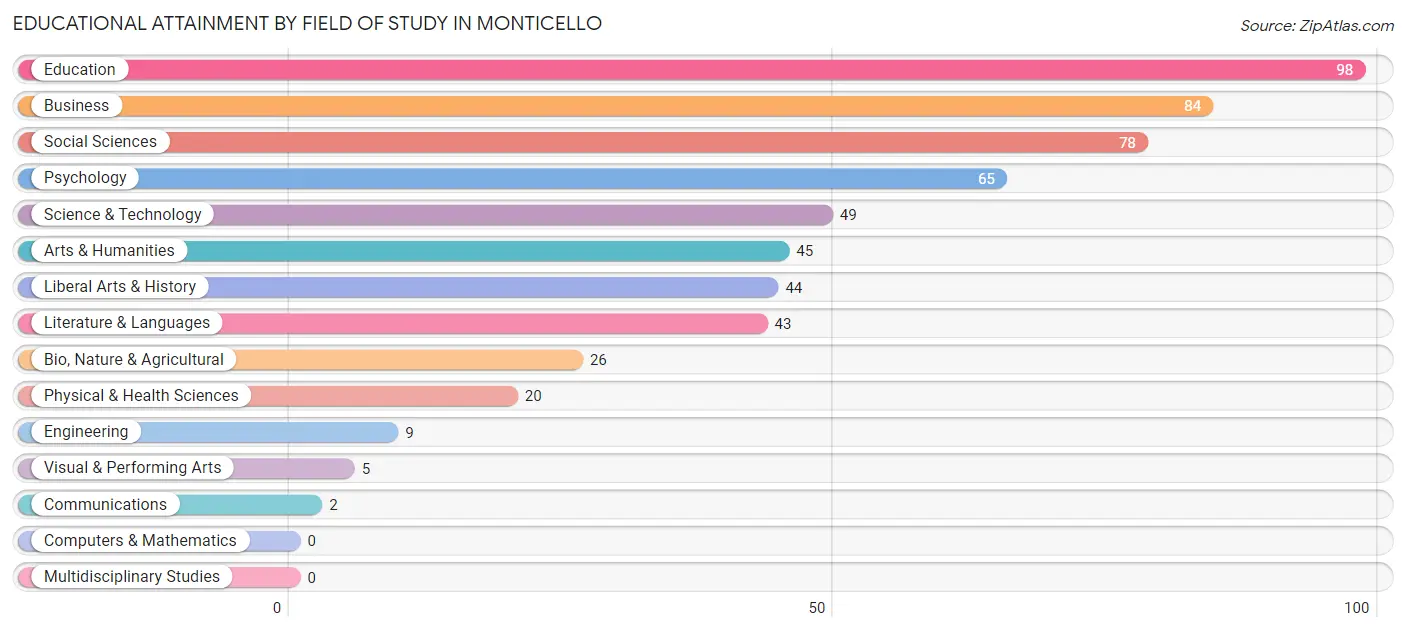
| Field of Study | # Graduates | % Graduates |
| Computers & Mathematics | 0 | 0.0% |
| Bio, Nature & Agricultural | 26 | 4.6% |
| Physical & Health Sciences | 20 | 3.5% |
| Psychology | 65 | 11.4% |
| Social Sciences | 78 | 13.7% |
| Engineering | 9 | 1.6% |
| Multidisciplinary Studies | 0 | 0.0% |
| Science & Technology | 49 | 8.6% |
| Business | 84 | 14.8% |
| Education | 98 | 17.2% |
| Literature & Languages | 43 | 7.6% |
| Liberal Arts & History | 44 | 7.7% |
| Visual & Performing Arts | 5 | 0.9% |
| Communications | 2 | 0.4% |
| Arts & Humanities | 45 | 7.9% |
| Total | 568 | 100.0% |
Transportation & Commute in Monticello
Vehicle Availability by Sex in Monticello
The most prevalent vehicle ownership categories in Monticello are males with 1 vehicle (183, accounting for 32.9%) and females with 1 vehicle (153, making up 35.5%).
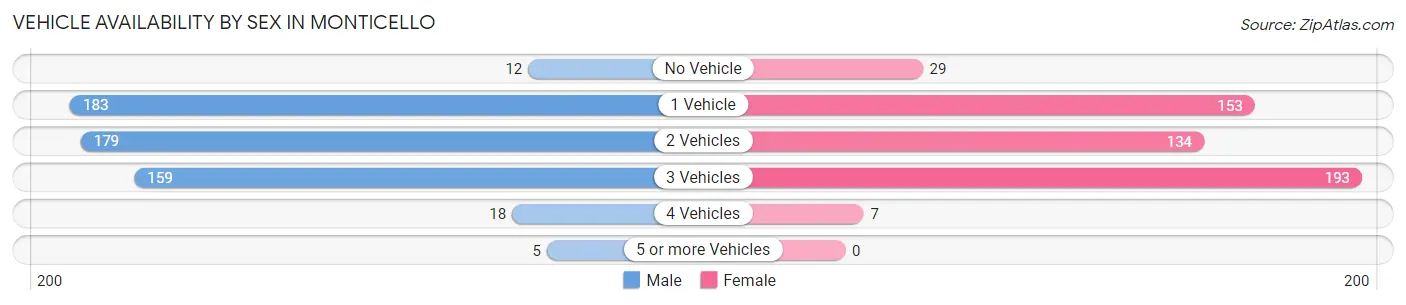
| Vehicles Available | Male | Female |
| No Vehicle | 12 (2.2%) | 29 (5.6%) |
| 1 Vehicle | 183 (32.9%) | 153 (29.6%) |
| 2 Vehicles | 179 (32.2%) | 134 (26.0%) |
| 3 Vehicles | 159 (28.6%) | 193 (37.4%) |
| 4 Vehicles | 18 (3.2%) | 7 (1.4%) |
| 5 or more Vehicles | 5 (0.9%) | 0 (0.0%) |
| Total | 556 (100.0%) | 516 (100.0%) |
Commute Time in Monticello
The most frequently occuring commute durations in Monticello are 45 to 59 minutes (253 commuters, 25.8%), 10 to 14 minutes (167 commuters, 17.0%), and 30 to 34 minutes (105 commuters, 10.7%).
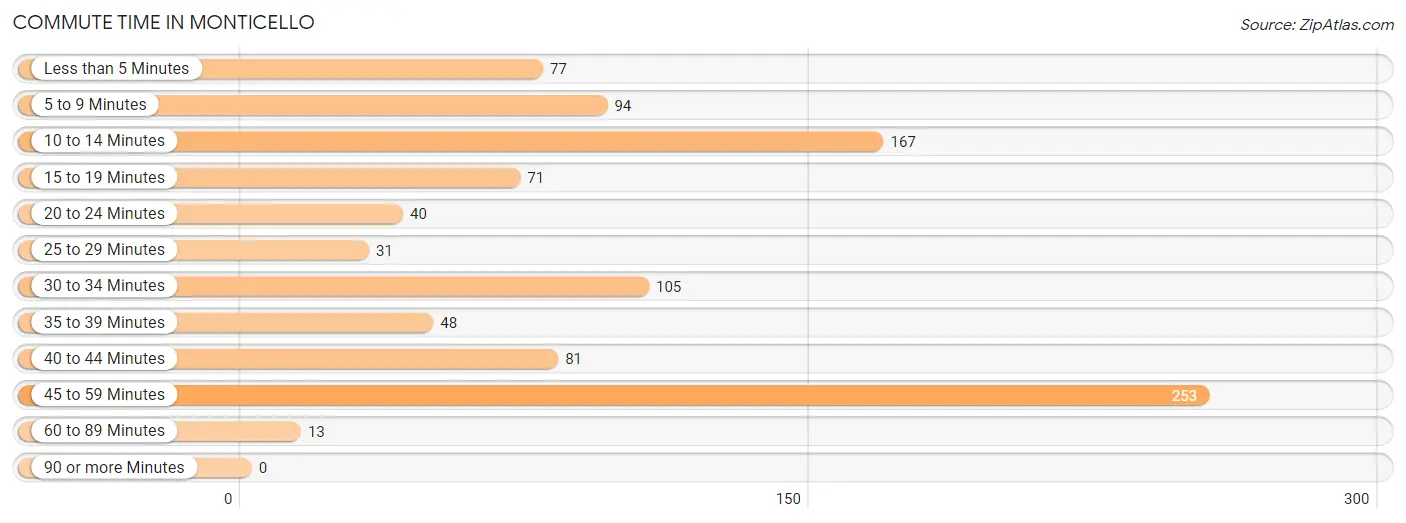
| Commute Time | # Commuters | % Commuters |
| Less than 5 Minutes | 77 | 7.9% |
| 5 to 9 Minutes | 94 | 9.6% |
| 10 to 14 Minutes | 167 | 17.0% |
| 15 to 19 Minutes | 71 | 7.2% |
| 20 to 24 Minutes | 40 | 4.1% |
| 25 to 29 Minutes | 31 | 3.2% |
| 30 to 34 Minutes | 105 | 10.7% |
| 35 to 39 Minutes | 48 | 4.9% |
| 40 to 44 Minutes | 81 | 8.3% |
| 45 to 59 Minutes | 253 | 25.8% |
| 60 to 89 Minutes | 13 | 1.3% |
| 90 or more Minutes | 0 | 0.0% |
Commute Time by Sex in Monticello
The most common commute times in Monticello are 45 to 59 minutes (113 commuters, 20.9%) for males and 45 to 59 minutes (140 commuters, 31.9%) for females.
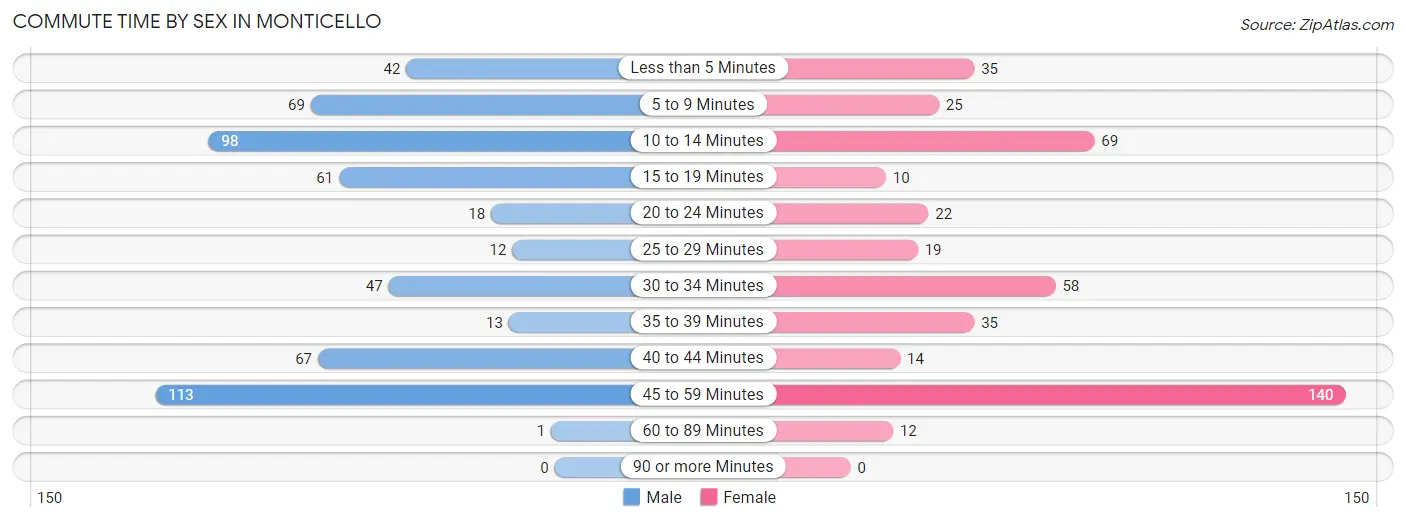
| Commute Time | Male | Female |
| Less than 5 Minutes | 42 (7.8%) | 35 (8.0%) |
| 5 to 9 Minutes | 69 (12.8%) | 25 (5.7%) |
| 10 to 14 Minutes | 98 (18.1%) | 69 (15.7%) |
| 15 to 19 Minutes | 61 (11.3%) | 10 (2.3%) |
| 20 to 24 Minutes | 18 (3.3%) | 22 (5.0%) |
| 25 to 29 Minutes | 12 (2.2%) | 19 (4.3%) |
| 30 to 34 Minutes | 47 (8.7%) | 58 (13.2%) |
| 35 to 39 Minutes | 13 (2.4%) | 35 (8.0%) |
| 40 to 44 Minutes | 67 (12.4%) | 14 (3.2%) |
| 45 to 59 Minutes | 113 (20.9%) | 140 (31.9%) |
| 60 to 89 Minutes | 1 (0.2%) | 12 (2.7%) |
| 90 or more Minutes | 0 (0.0%) | 0 (0.0%) |
Time of Departure to Work by Sex in Monticello
The most frequent times of departure to work in Monticello are 7:00 AM to 7:29 AM (126, 23.3%) for males and 7:00 AM to 7:29 AM (99, 22.6%) for females.
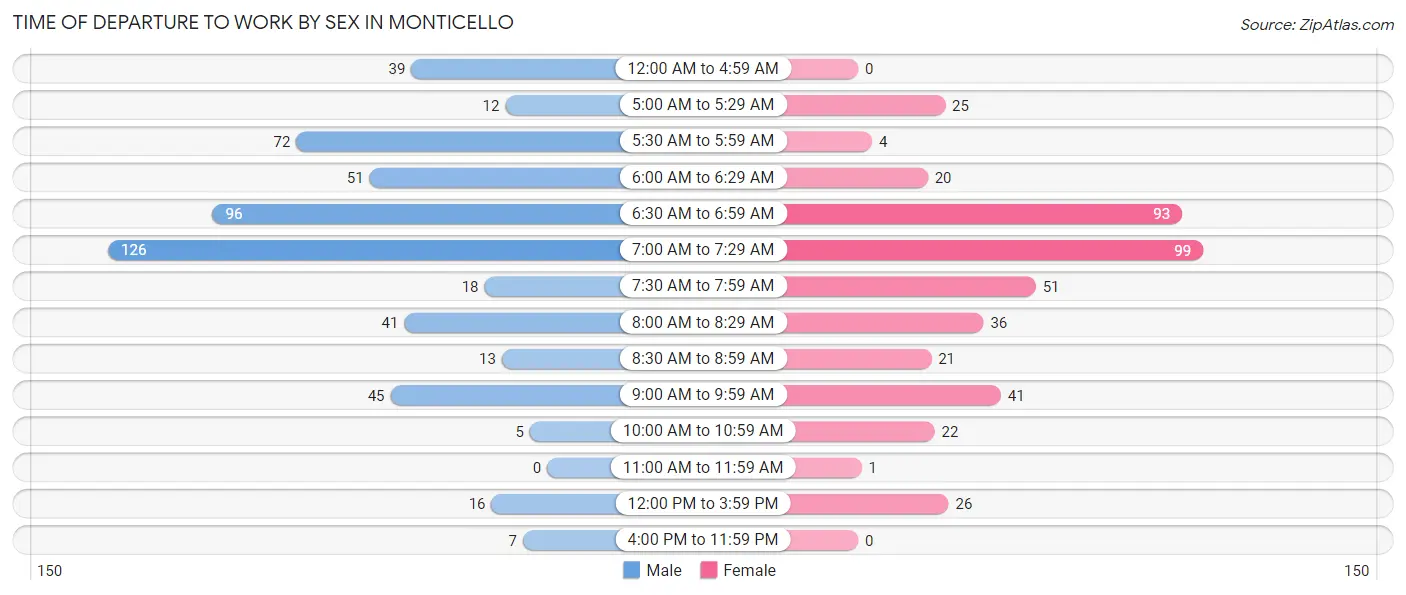
| Time of Departure | Male | Female |
| 12:00 AM to 4:59 AM | 39 (7.2%) | 0 (0.0%) |
| 5:00 AM to 5:29 AM | 12 (2.2%) | 25 (5.7%) |
| 5:30 AM to 5:59 AM | 72 (13.3%) | 4 (0.9%) |
| 6:00 AM to 6:29 AM | 51 (9.4%) | 20 (4.6%) |
| 6:30 AM to 6:59 AM | 96 (17.7%) | 93 (21.2%) |
| 7:00 AM to 7:29 AM | 126 (23.3%) | 99 (22.6%) |
| 7:30 AM to 7:59 AM | 18 (3.3%) | 51 (11.6%) |
| 8:00 AM to 8:29 AM | 41 (7.6%) | 36 (8.2%) |
| 8:30 AM to 8:59 AM | 13 (2.4%) | 21 (4.8%) |
| 9:00 AM to 9:59 AM | 45 (8.3%) | 41 (9.3%) |
| 10:00 AM to 10:59 AM | 5 (0.9%) | 22 (5.0%) |
| 11:00 AM to 11:59 AM | 0 (0.0%) | 1 (0.2%) |
| 12:00 PM to 3:59 PM | 16 (3.0%) | 26 (5.9%) |
| 4:00 PM to 11:59 PM | 7 (1.3%) | 0 (0.0%) |
| Total | 541 (100.0%) | 439 (100.0%) |
Housing Occupancy in Monticello
Occupancy by Ownership in Monticello
Of the total 1,128 dwellings in Monticello, owner-occupied units account for 730 (64.7%), while renter-occupied units make up 398 (35.3%).
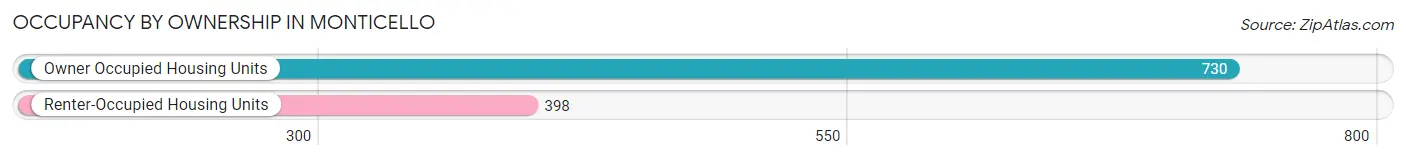
| Occupancy | # Housing Units | % Housing Units |
| Owner Occupied Housing Units | 730 | 64.7% |
| Renter-Occupied Housing Units | 398 | 35.3% |
| Total Occupied Housing Units | 1,128 | 100.0% |
Occupancy by Household Size in Monticello
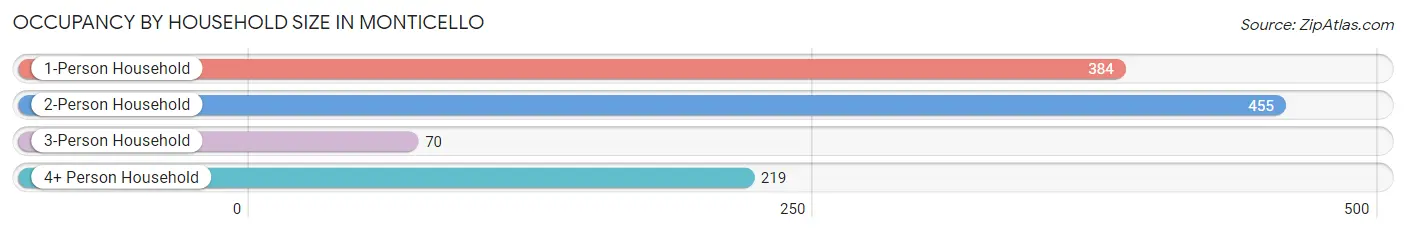
| Household Size | # Housing Units | % Housing Units |
| 1-Person Household | 384 | 34.0% |
| 2-Person Household | 455 | 40.3% |
| 3-Person Household | 70 | 6.2% |
| 4+ Person Household | 219 | 19.4% |
| Total Housing Units | 1,128 | 100.0% |
Occupancy by Ownership by Household Size in Monticello
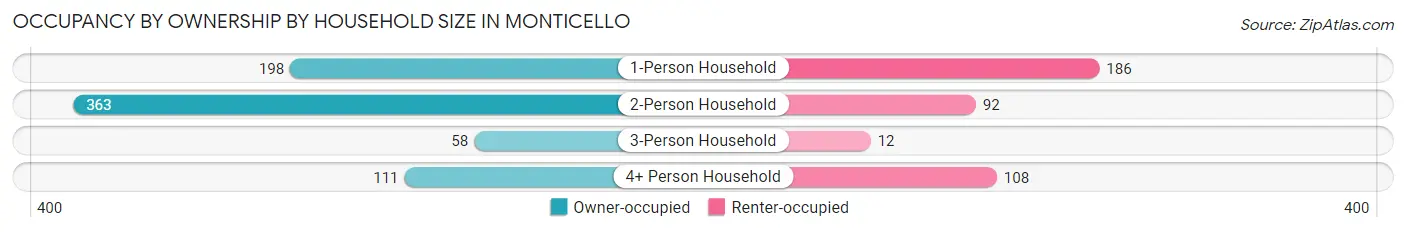
| Household Size | Owner-occupied | Renter-occupied |
| 1-Person Household | 198 (51.6%) | 186 (48.4%) |
| 2-Person Household | 363 (79.8%) | 92 (20.2%) |
| 3-Person Household | 58 (82.9%) | 12 (17.1%) |
| 4+ Person Household | 111 (50.7%) | 108 (49.3%) |
| Total Housing Units | 730 (64.7%) | 398 (35.3%) |
Occupancy by Educational Attainment in Monticello
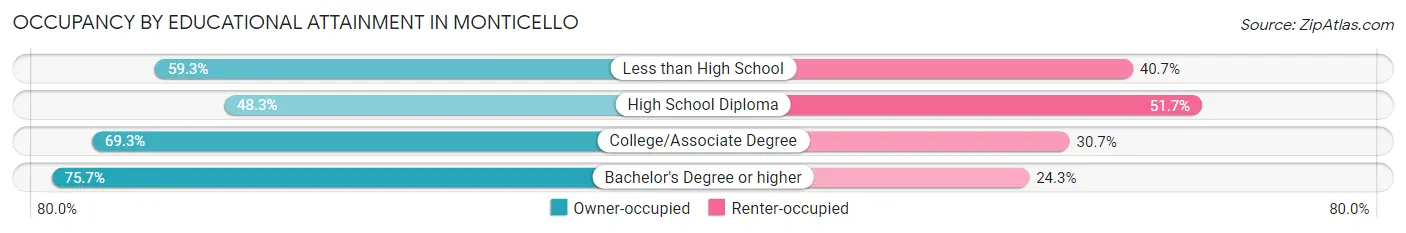
| Household Size | Owner-occupied | Renter-occupied |
| Less than High School | 102 (59.3%) | 70 (40.7%) |
| High School Diploma | 131 (48.3%) | 140 (51.7%) |
| College/Associate Degree | 235 (69.3%) | 104 (30.7%) |
| Bachelor's Degree or higher | 262 (75.7%) | 84 (24.3%) |
Occupancy by Age of Householder in Monticello
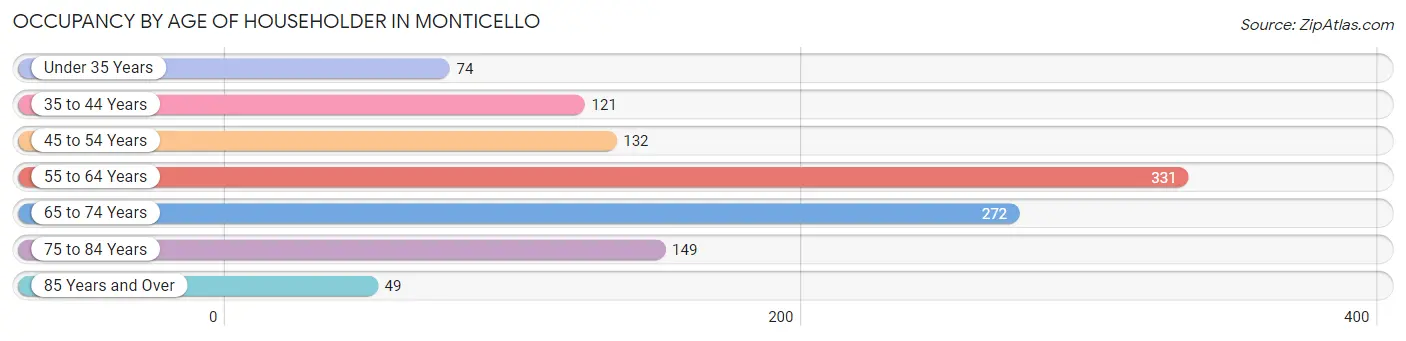
| Age Bracket | # Households | % Households |
| Under 35 Years | 74 | 6.6% |
| 35 to 44 Years | 121 | 10.7% |
| 45 to 54 Years | 132 | 11.7% |
| 55 to 64 Years | 331 | 29.3% |
| 65 to 74 Years | 272 | 24.1% |
| 75 to 84 Years | 149 | 13.2% |
| 85 Years and Over | 49 | 4.3% |
| Total | 1,128 | 100.0% |
Housing Finances in Monticello
Median Income by Occupancy in Monticello
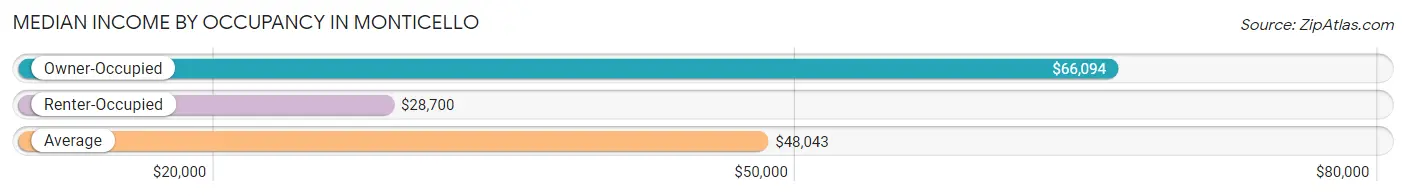
| Occupancy Type | # Households | Median Income |
| Owner-Occupied | 730 (64.7%) | $66,094 |
| Renter-Occupied | 398 (35.3%) | $28,700 |
| Average | 1,128 (100.0%) | $48,043 |
Occupancy by Householder Income Bracket in Monticello
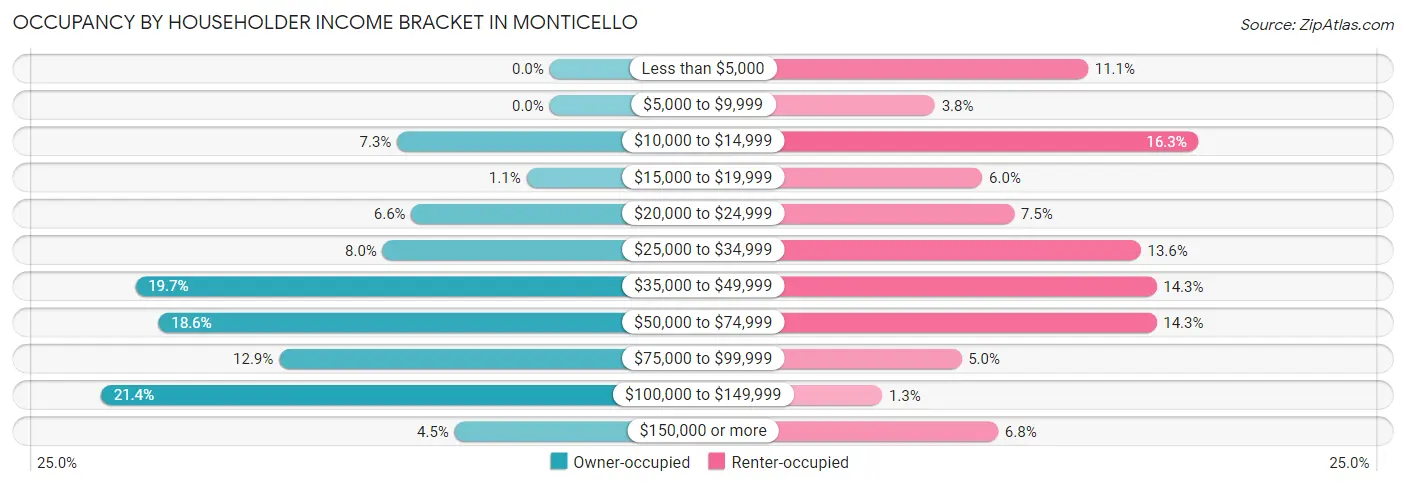
| Income Bracket | Owner-occupied | Renter-occupied |
| Less than $5,000 | 0 (0.0%) | 44 (11.1%) |
| $5,000 to $9,999 | 0 (0.0%) | 15 (3.8%) |
| $10,000 to $14,999 | 53 (7.3%) | 65 (16.3%) |
| $15,000 to $19,999 | 8 (1.1%) | 24 (6.0%) |
| $20,000 to $24,999 | 48 (6.6%) | 30 (7.5%) |
| $25,000 to $34,999 | 58 (8.0%) | 54 (13.6%) |
| $35,000 to $49,999 | 144 (19.7%) | 57 (14.3%) |
| $50,000 to $74,999 | 136 (18.6%) | 57 (14.3%) |
| $75,000 to $99,999 | 94 (12.9%) | 20 (5.0%) |
| $100,000 to $149,999 | 156 (21.4%) | 5 (1.3%) |
| $150,000 or more | 33 (4.5%) | 27 (6.8%) |
| Total | 730 (100.0%) | 398 (100.0%) |
Monthly Housing Cost Tiers in Monticello
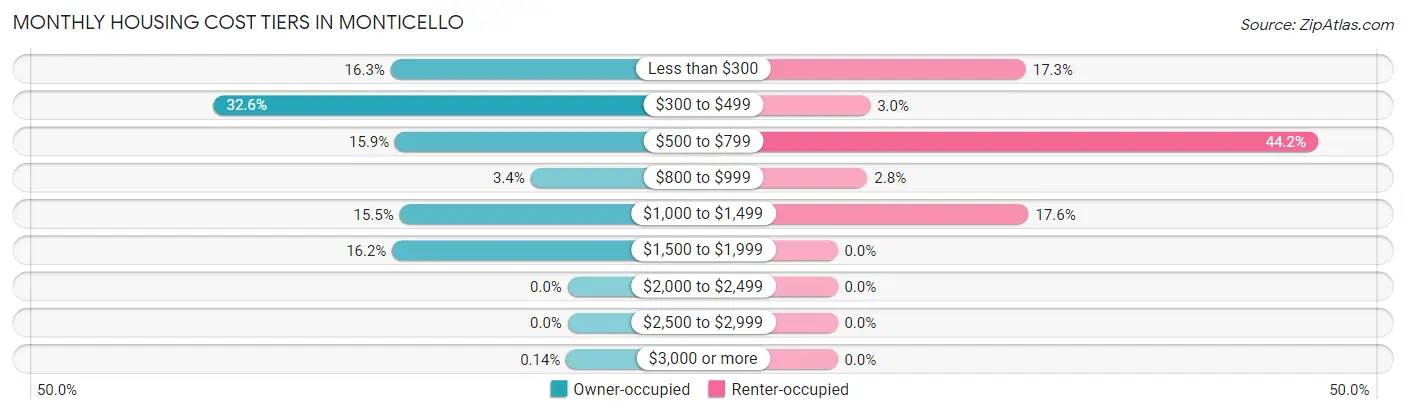
| Monthly Cost | Owner-occupied | Renter-occupied |
| Less than $300 | 119 (16.3%) | 69 (17.3%) |
| $300 to $499 | 238 (32.6%) | 12 (3.0%) |
| $500 to $799 | 116 (15.9%) | 176 (44.2%) |
| $800 to $999 | 25 (3.4%) | 11 (2.8%) |
| $1,000 to $1,499 | 113 (15.5%) | 70 (17.6%) |
| $1,500 to $1,999 | 118 (16.2%) | 0 (0.0%) |
| $2,000 to $2,499 | 0 (0.0%) | 0 (0.0%) |
| $2,500 to $2,999 | 0 (0.0%) | 0 (0.0%) |
| $3,000 or more | 1 (0.1%) | 0 (0.0%) |
| Total | 730 (100.0%) | 398 (100.0%) |
Physical Housing Characteristics in Monticello
Housing Structures in Monticello
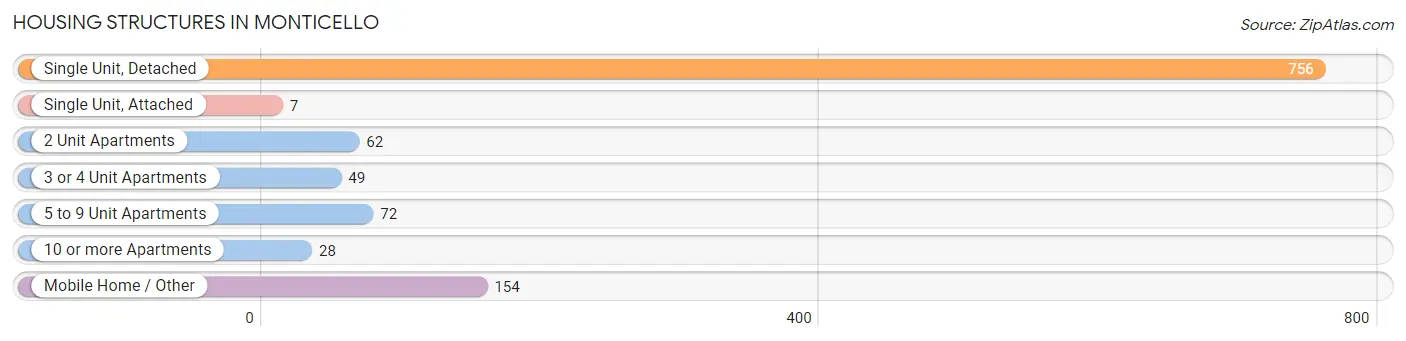
| Structure Type | # Housing Units | % Housing Units |
| Single Unit, Detached | 756 | 67.0% |
| Single Unit, Attached | 7 | 0.6% |
| 2 Unit Apartments | 62 | 5.5% |
| 3 or 4 Unit Apartments | 49 | 4.3% |
| 5 to 9 Unit Apartments | 72 | 6.4% |
| 10 or more Apartments | 28 | 2.5% |
| Mobile Home / Other | 154 | 13.7% |
| Total | 1,128 | 100.0% |
Housing Structures by Occupancy in Monticello
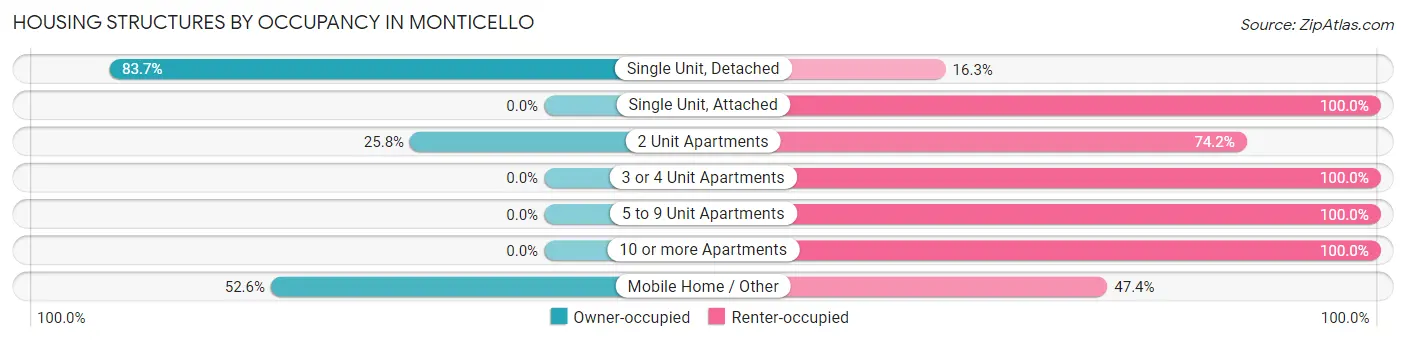
| Structure Type | Owner-occupied | Renter-occupied |
| Single Unit, Detached | 633 (83.7%) | 123 (16.3%) |
| Single Unit, Attached | 0 (0.0%) | 7 (100.0%) |
| 2 Unit Apartments | 16 (25.8%) | 46 (74.2%) |
| 3 or 4 Unit Apartments | 0 (0.0%) | 49 (100.0%) |
| 5 to 9 Unit Apartments | 0 (0.0%) | 72 (100.0%) |
| 10 or more Apartments | 0 (0.0%) | 28 (100.0%) |
| Mobile Home / Other | 81 (52.6%) | 73 (47.4%) |
| Total | 730 (64.7%) | 398 (35.3%) |
Housing Structures by Number of Rooms in Monticello
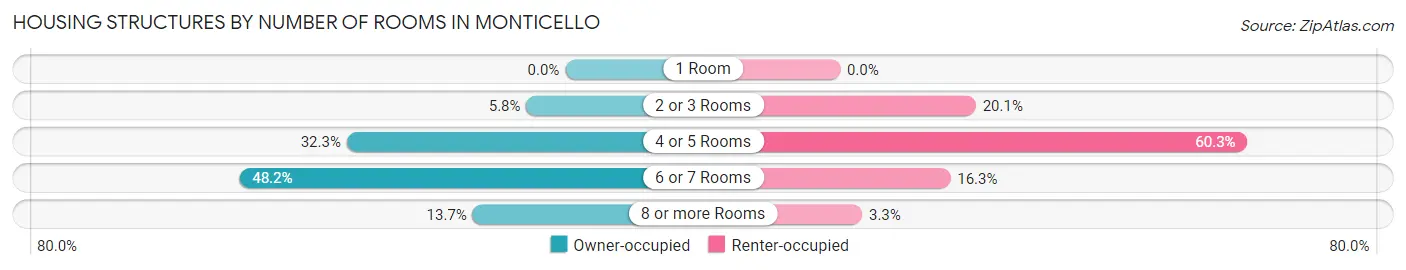
| Number of Rooms | Owner-occupied | Renter-occupied |
| 1 Room | 0 (0.0%) | 0 (0.0%) |
| 2 or 3 Rooms | 42 (5.8%) | 80 (20.1%) |
| 4 or 5 Rooms | 236 (32.3%) | 240 (60.3%) |
| 6 or 7 Rooms | 352 (48.2%) | 65 (16.3%) |
| 8 or more Rooms | 100 (13.7%) | 13 (3.3%) |
| Total | 730 (100.0%) | 398 (100.0%) |
Housing Structure by Heating Type in Monticello
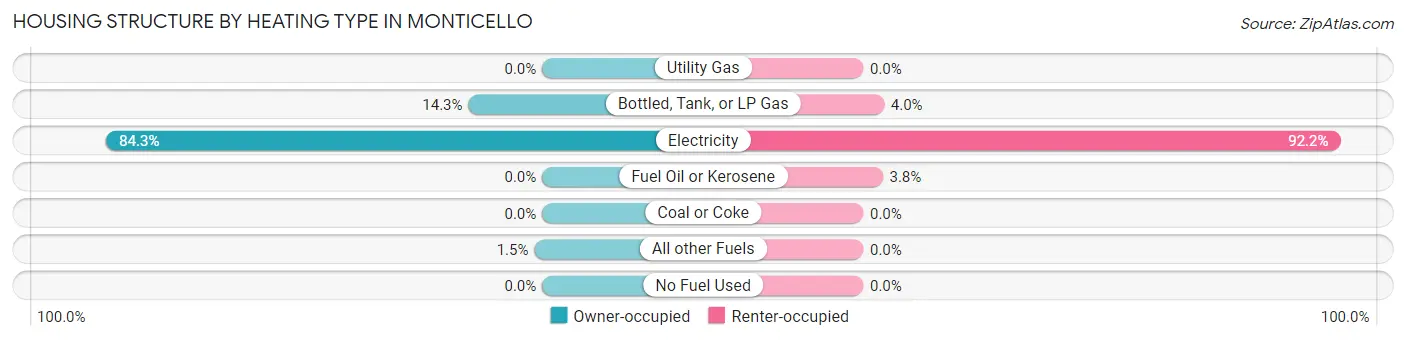
| Heating Type | Owner-occupied | Renter-occupied |
| Utility Gas | 0 (0.0%) | 0 (0.0%) |
| Bottled, Tank, or LP Gas | 104 (14.2%) | 16 (4.0%) |
| Electricity | 615 (84.3%) | 367 (92.2%) |
| Fuel Oil or Kerosene | 0 (0.0%) | 15 (3.8%) |
| Coal or Coke | 0 (0.0%) | 0 (0.0%) |
| All other Fuels | 11 (1.5%) | 0 (0.0%) |
| No Fuel Used | 0 (0.0%) | 0 (0.0%) |
| Total | 730 (100.0%) | 398 (100.0%) |
Household Vehicle Usage in Monticello
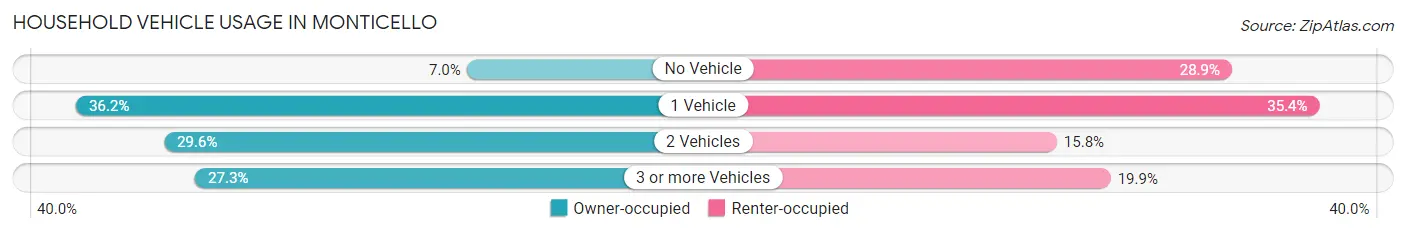
| Vehicles per Household | Owner-occupied | Renter-occupied |
| No Vehicle | 51 (7.0%) | 115 (28.9%) |
| 1 Vehicle | 264 (36.2%) | 141 (35.4%) |
| 2 Vehicles | 216 (29.6%) | 63 (15.8%) |
| 3 or more Vehicles | 199 (27.3%) | 79 (19.9%) |
| Total | 730 (100.0%) | 398 (100.0%) |
Real Estate & Mortgages in Monticello
Real Estate and Mortgage Overview in Monticello
| Characteristic | Without Mortgage | With Mortgage |
| Housing Units | 450 | 280 |
| Median Property Value | $135,800 | $184,500 |
| Median Household Income | $49,118 | $26 |
| Monthly Housing Costs | $420 | $1 |
| Real Estate Taxes | $1,047 | $6 |
Property Value by Mortgage Status in Monticello
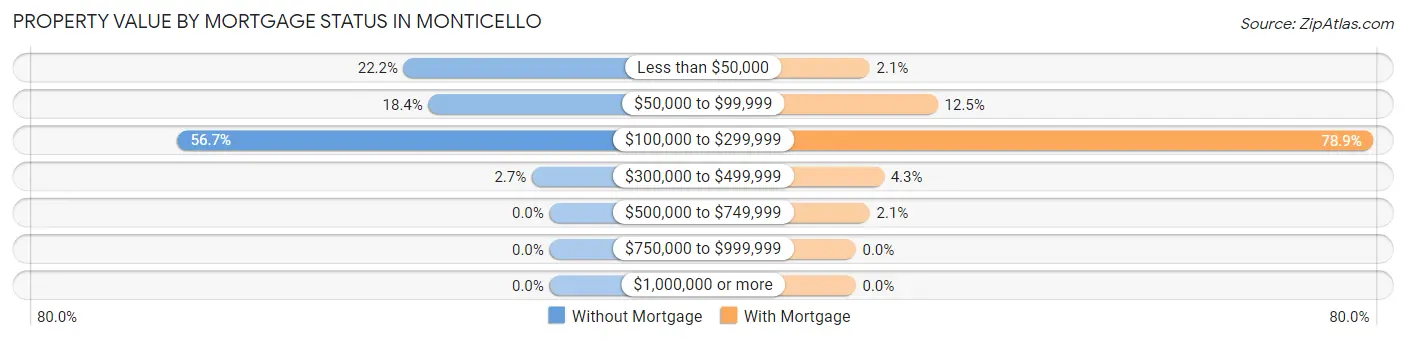
| Property Value | Without Mortgage | With Mortgage |
| Less than $50,000 | 100 (22.2%) | 6 (2.1%) |
| $50,000 to $99,999 | 83 (18.4%) | 35 (12.5%) |
| $100,000 to $299,999 | 255 (56.7%) | 221 (78.9%) |
| $300,000 to $499,999 | 12 (2.7%) | 12 (4.3%) |
| $500,000 to $749,999 | 0 (0.0%) | 6 (2.1%) |
| $750,000 to $999,999 | 0 (0.0%) | 0 (0.0%) |
| $1,000,000 or more | 0 (0.0%) | 0 (0.0%) |
| Total | 450 (100.0%) | 280 (100.0%) |
Household Income by Mortgage Status in Monticello
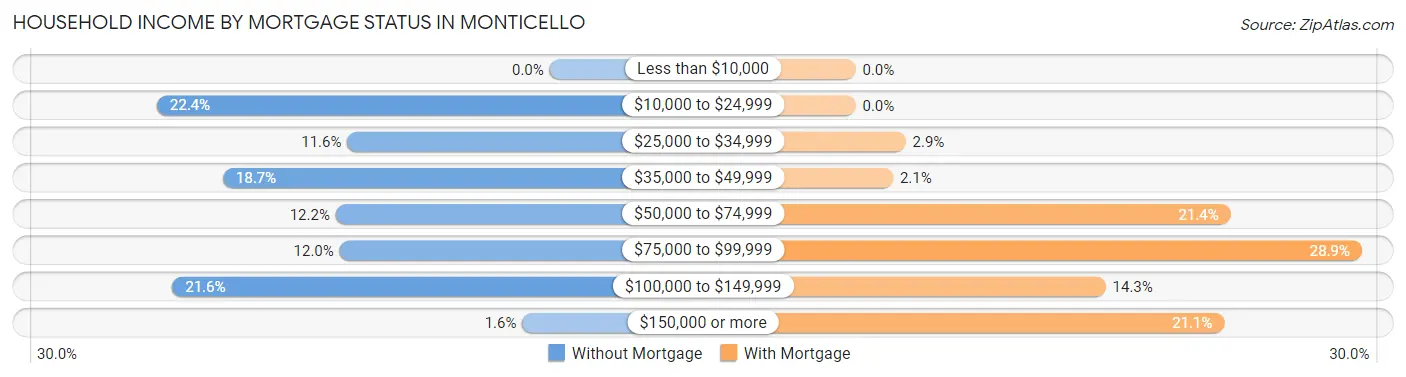
| Household Income | Without Mortgage | With Mortgage |
| Less than $10,000 | 0 (0.0%) | 0 (0.0%) |
| $10,000 to $24,999 | 101 (22.4%) | 0 (0.0%) |
| $25,000 to $34,999 | 52 (11.6%) | 8 (2.9%) |
| $35,000 to $49,999 | 84 (18.7%) | 6 (2.1%) |
| $50,000 to $74,999 | 55 (12.2%) | 60 (21.4%) |
| $75,000 to $99,999 | 54 (12.0%) | 81 (28.9%) |
| $100,000 to $149,999 | 97 (21.6%) | 40 (14.3%) |
| $150,000 or more | 7 (1.6%) | 59 (21.1%) |
| Total | 450 (100.0%) | 280 (100.0%) |
Property Value to Household Income Ratio in Monticello
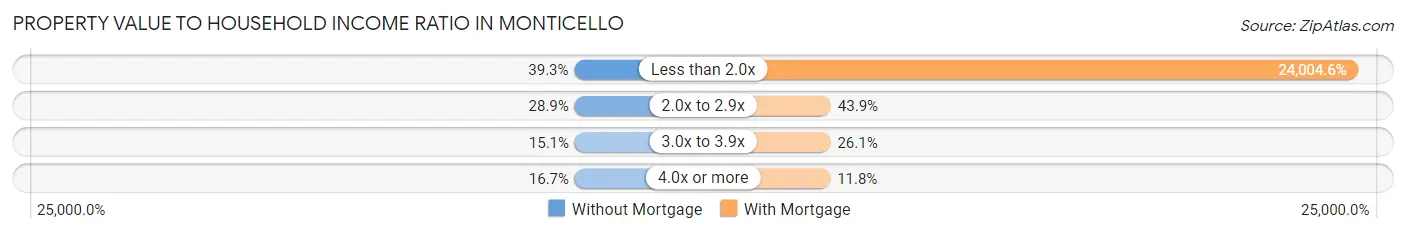
| Value-to-Income Ratio | Without Mortgage | With Mortgage |
| Less than 2.0x | 177 (39.3%) | 67,213 (24,004.6%) |
| 2.0x to 2.9x | 130 (28.9%) | 123 (43.9%) |
| 3.0x to 3.9x | 68 (15.1%) | 73 (26.1%) |
| 4.0x or more | 75 (16.7%) | 33 (11.8%) |
| Total | 450 (100.0%) | 280 (100.0%) |
Real Estate Taxes by Mortgage Status in Monticello
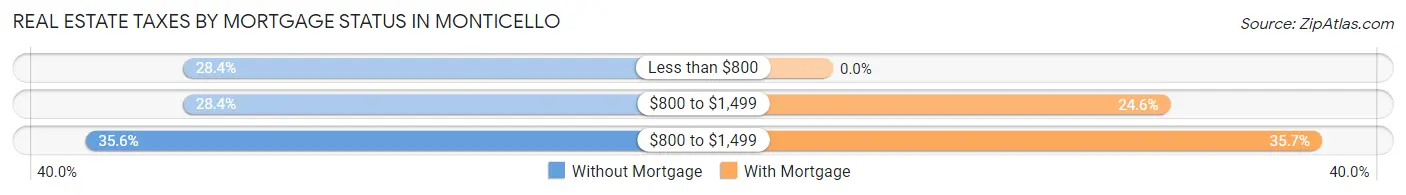
| Property Taxes | Without Mortgage | With Mortgage |
| Less than $800 | 128 (28.4%) | 0 (0.0%) |
| $800 to $1,499 | 128 (28.4%) | 69 (24.6%) |
| $800 to $1,499 | 160 (35.6%) | 100 (35.7%) |
| Total | 450 (100.0%) | 280 (100.0%) |
Health & Disability in Monticello
Health Insurance Coverage by Age in Monticello
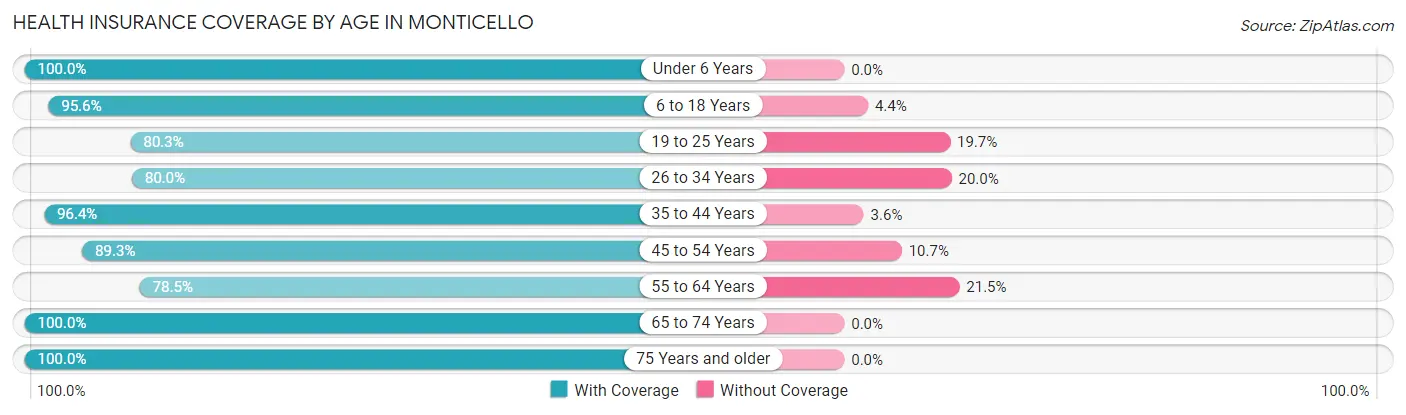
| Age Bracket | With Coverage | Without Coverage |
| Under 6 Years | 233 (100.0%) | 0 (0.0%) |
| 6 to 18 Years | 216 (95.6%) | 10 (4.4%) |
| 19 to 25 Years | 171 (80.3%) | 42 (19.7%) |
| 26 to 34 Years | 168 (80.0%) | 42 (20.0%) |
| 35 to 44 Years | 187 (96.4%) | 7 (3.6%) |
| 45 to 54 Years | 175 (89.3%) | 21 (10.7%) |
| 55 to 64 Years | 421 (78.5%) | 115 (21.5%) |
| 65 to 74 Years | 398 (100.0%) | 0 (0.0%) |
| 75 Years and older | 274 (100.0%) | 0 (0.0%) |
| Total | 2,243 (90.4%) | 237 (9.6%) |
Health Insurance Coverage by Citizenship Status in Monticello
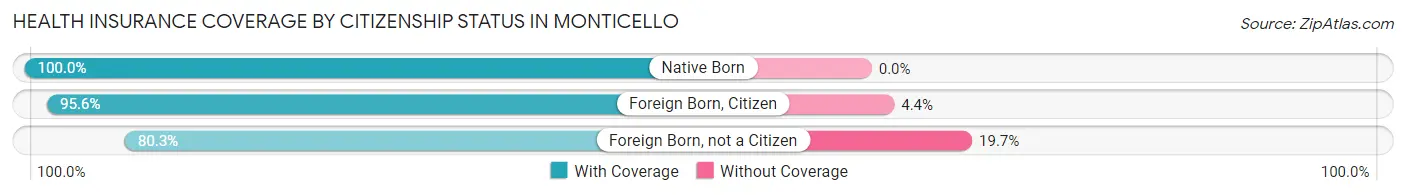
| Citizenship Status | With Coverage | Without Coverage |
| Native Born | 233 (100.0%) | 0 (0.0%) |
| Foreign Born, Citizen | 216 (95.6%) | 10 (4.4%) |
| Foreign Born, not a Citizen | 171 (80.3%) | 42 (19.7%) |
Health Insurance Coverage by Household Income in Monticello
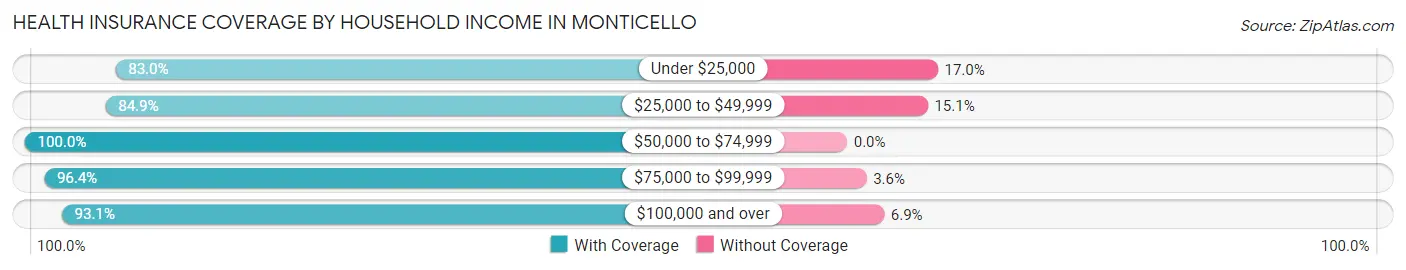
| Household Income | With Coverage | Without Coverage |
| Under $25,000 | 376 (83.0%) | 77 (17.0%) |
| $25,000 to $49,999 | 612 (84.9%) | 109 (15.1%) |
| $50,000 to $74,999 | 413 (100.0%) | 0 (0.0%) |
| $75,000 to $99,999 | 319 (96.4%) | 12 (3.6%) |
| $100,000 and over | 523 (93.1%) | 39 (6.9%) |
Public vs Private Health Insurance Coverage by Age in Monticello
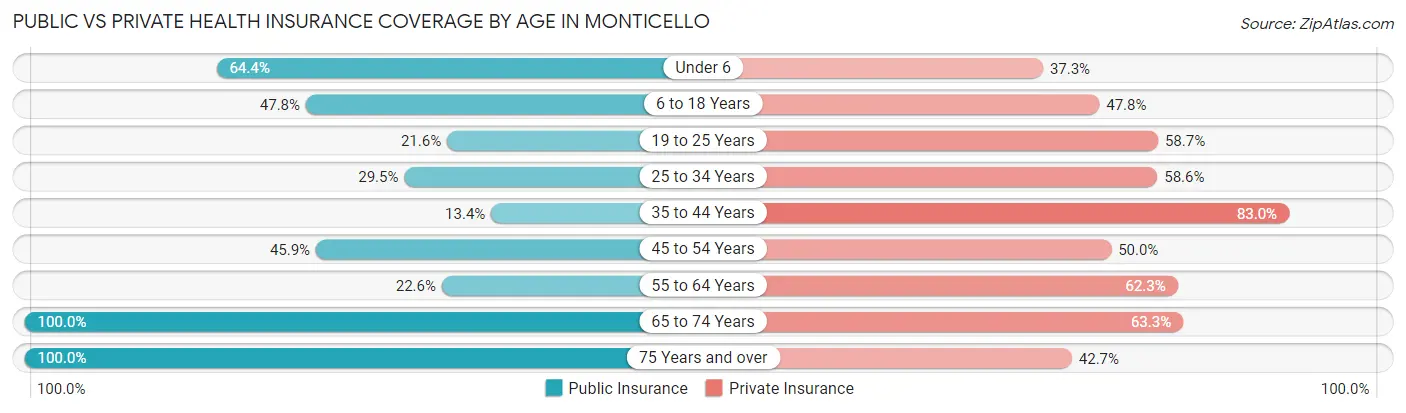
| Age Bracket | Public Insurance | Private Insurance |
| Under 6 | 150 (64.4%) | 87 (37.3%) |
| 6 to 18 Years | 108 (47.8%) | 108 (47.8%) |
| 19 to 25 Years | 46 (21.6%) | 125 (58.7%) |
| 25 to 34 Years | 62 (29.5%) | 123 (58.6%) |
| 35 to 44 Years | 26 (13.4%) | 161 (83.0%) |
| 45 to 54 Years | 90 (45.9%) | 98 (50.0%) |
| 55 to 64 Years | 121 (22.6%) | 334 (62.3%) |
| 65 to 74 Years | 398 (100.0%) | 252 (63.3%) |
| 75 Years and over | 274 (100.0%) | 117 (42.7%) |
| Total | 1,275 (51.4%) | 1,405 (56.7%) |
Disability Status by Sex by Age in Monticello
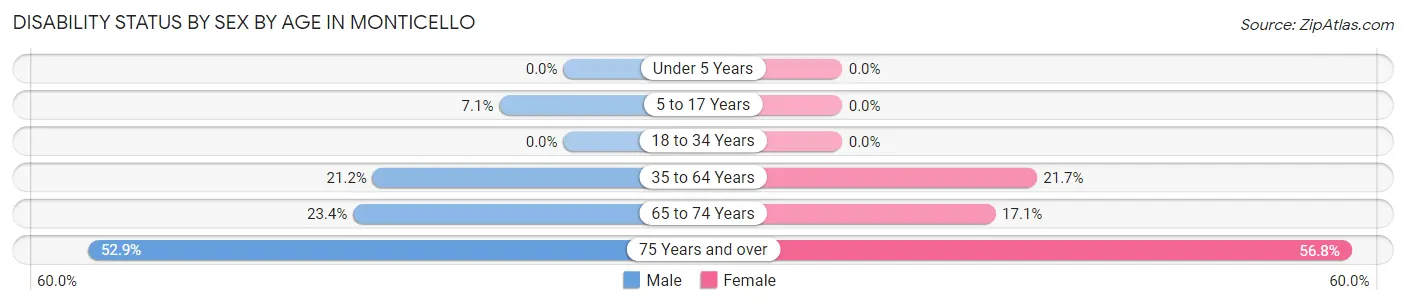
| Age Bracket | Male | Female |
| Under 5 Years | 0 (0.0%) | 0 (0.0%) |
| 5 to 17 Years | 7 (7.1%) | 0 (0.0%) |
| 18 to 34 Years | 0 (0.0%) | 0 (0.0%) |
| 35 to 64 Years | 82 (21.2%) | 117 (21.7%) |
| 65 to 74 Years | 37 (23.4%) | 41 (17.1%) |
| 75 Years and over | 63 (52.9%) | 88 (56.8%) |
Disability Class by Sex by Age in Monticello
Disability Class: Hearing Difficulty
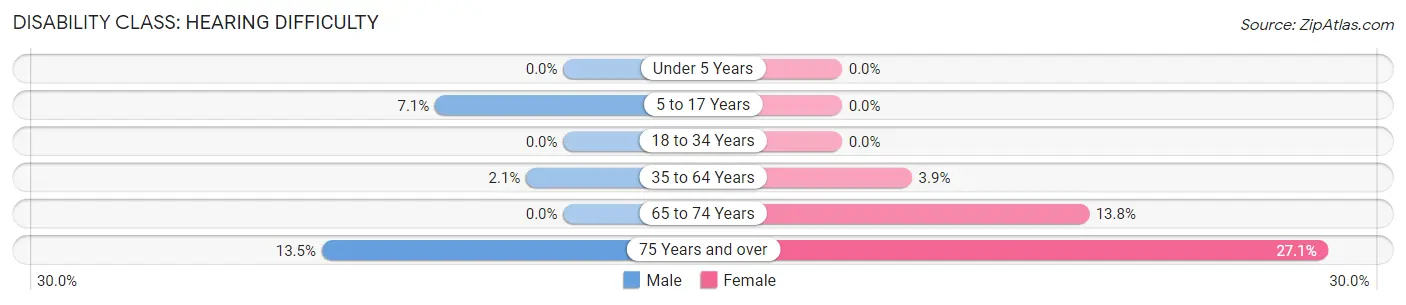
| Age Bracket | Male | Female |
| Under 5 Years | 0 (0.0%) | 0 (0.0%) |
| 5 to 17 Years | 7 (7.1%) | 0 (0.0%) |
| 18 to 34 Years | 0 (0.0%) | 0 (0.0%) |
| 35 to 64 Years | 8 (2.1%) | 21 (3.9%) |
| 65 to 74 Years | 0 (0.0%) | 33 (13.8%) |
| 75 Years and over | 16 (13.5%) | 42 (27.1%) |
Disability Class: Vision Difficulty
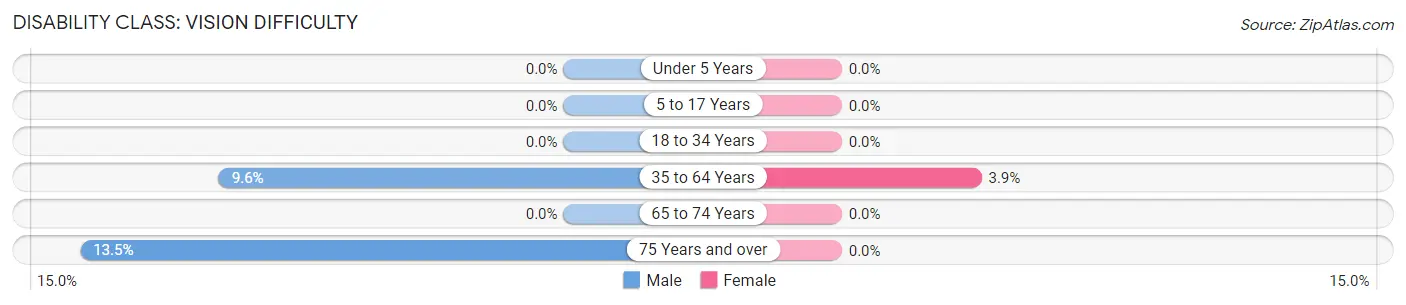
| Age Bracket | Male | Female |
| Under 5 Years | 0 (0.0%) | 0 (0.0%) |
| 5 to 17 Years | 0 (0.0%) | 0 (0.0%) |
| 18 to 34 Years | 0 (0.0%) | 0 (0.0%) |
| 35 to 64 Years | 37 (9.6%) | 21 (3.9%) |
| 65 to 74 Years | 0 (0.0%) | 0 (0.0%) |
| 75 Years and over | 16 (13.5%) | 0 (0.0%) |
Disability Class: Cognitive Difficulty
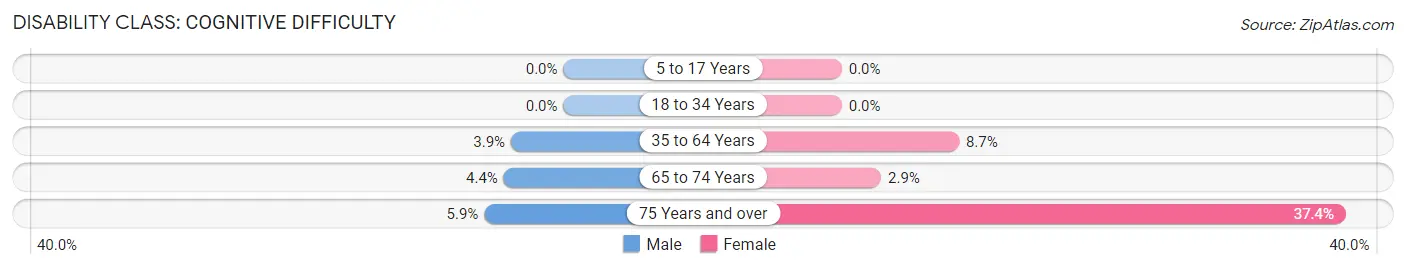
| Age Bracket | Male | Female |
| 5 to 17 Years | 0 (0.0%) | 0 (0.0%) |
| 18 to 34 Years | 0 (0.0%) | 0 (0.0%) |
| 35 to 64 Years | 15 (3.9%) | 47 (8.7%) |
| 65 to 74 Years | 7 (4.4%) | 7 (2.9%) |
| 75 Years and over | 7 (5.9%) | 58 (37.4%) |
Disability Class: Ambulatory Difficulty
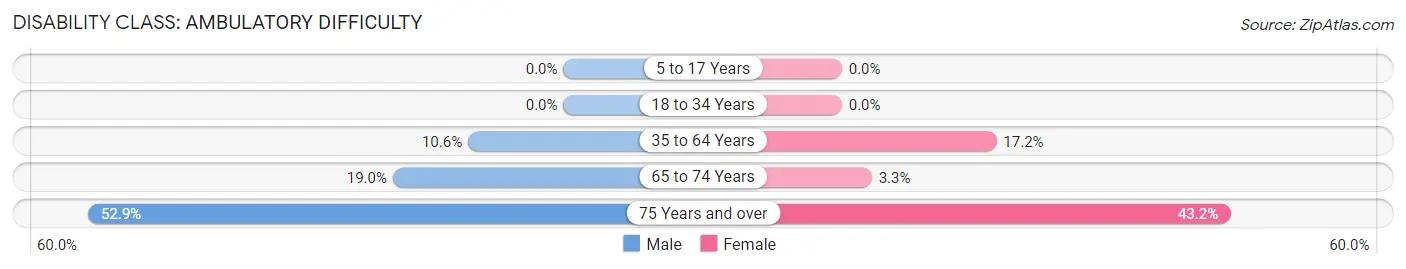
| Age Bracket | Male | Female |
| 5 to 17 Years | 0 (0.0%) | 0 (0.0%) |
| 18 to 34 Years | 0 (0.0%) | 0 (0.0%) |
| 35 to 64 Years | 41 (10.6%) | 93 (17.2%) |
| 65 to 74 Years | 30 (19.0%) | 8 (3.3%) |
| 75 Years and over | 63 (52.9%) | 67 (43.2%) |
Disability Class: Self-Care Difficulty
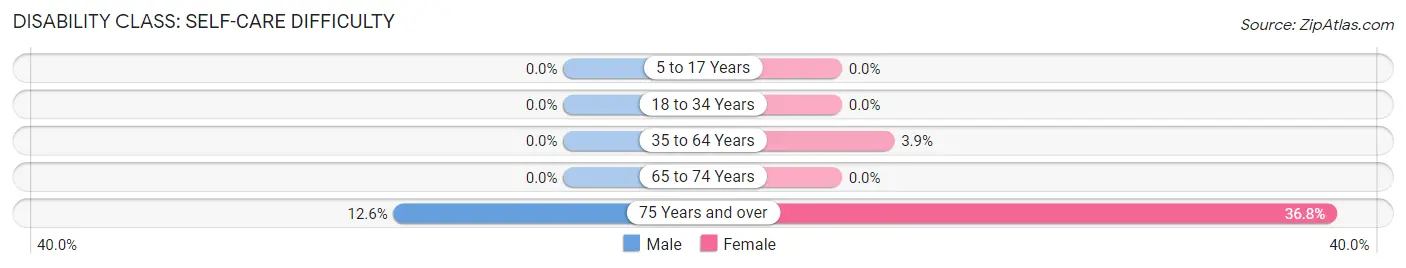
| Age Bracket | Male | Female |
| 5 to 17 Years | 0 (0.0%) | 0 (0.0%) |
| 18 to 34 Years | 0 (0.0%) | 0 (0.0%) |
| 35 to 64 Years | 0 (0.0%) | 21 (3.9%) |
| 65 to 74 Years | 0 (0.0%) | 0 (0.0%) |
| 75 Years and over | 15 (12.6%) | 57 (36.8%) |
Technology Access in Monticello
Computing Device Access in Monticello
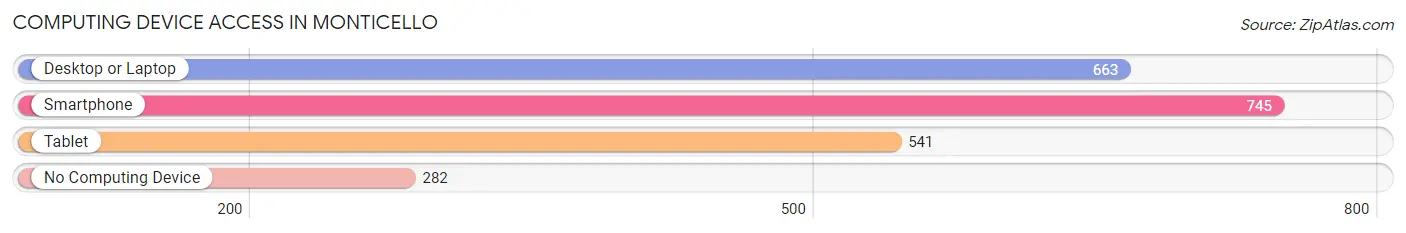
| Device Type | # Households | % Households |
| Desktop or Laptop | 663 | 58.8% |
| Smartphone | 745 | 66.0% |
| Tablet | 541 | 48.0% |
| No Computing Device | 282 | 25.0% |
| Total | 1,128 | 100.0% |
Internet Access in Monticello
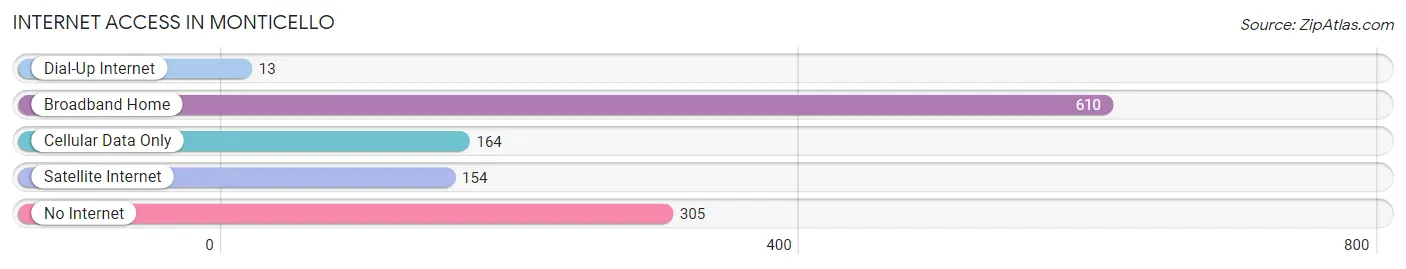
| Internet Type | # Households | % Households |
| Dial-Up Internet | 13 | 1.1% |
| Broadband Home | 610 | 54.1% |
| Cellular Data Only | 164 | 14.5% |
| Satellite Internet | 154 | 13.7% |
| No Internet | 305 | 27.0% |
| Total | 1,128 | 100.0% |
Monticello Summary
Monticello, Florida is a small town located in the panhandle of Florida, approximately 40 miles east of Tallahassee. It is the county seat of Jefferson County and is home to a population of approximately 2,500 people. The town was founded in 1828 and is named after Thomas Jefferson’s home in Virginia.
History
Monticello was founded in 1828 by William Wirt, a former United States Attorney General. Wirt purchased the land from the local Native American tribes and named the town after Thomas Jefferson’s home in Virginia. The town was incorporated in 1834 and was the county seat of Jefferson County.
In the late 1800s, Monticello was a thriving agricultural center, with cotton, tobacco, and citrus being the main crops. The town also had a thriving lumber industry, with several sawmills located in the area.
In the early 1900s, Monticello experienced a period of growth and prosperity. The town was home to several banks, a hotel, a movie theater, and a variety of stores. The town also had a thriving African-American community, with several churches, schools, and businesses.
In the 1950s, Monticello experienced a period of decline. The town’s economy was hurt by the decline of the lumber industry and the rise of mechanized farming. The town’s population also declined as people moved away in search of better opportunities.
In the late 1970s, Monticello began to experience a period of revitalization. The town was designated as a National Historic District in 1978 and several historic buildings were restored. The town also experienced a period of economic growth, with the opening of several new businesses.
Geography
Monticello is located in the panhandle of Florida, approximately 40 miles east of Tallahassee. The town is situated on the banks of the Aucilla River and is surrounded by rolling hills and pine forests. The town is located in a humid subtropical climate zone, with hot, humid summers and mild winters.
Economy
Monticello’s economy is largely based on agriculture and tourism. The town is home to several farms, which produce a variety of crops, including cotton, tobacco, and citrus. The town is also home to several tourist attractions, including the Monticello Opera House, the Jefferson County Historical Museum, and the Monticello Antique Mall.
Demographics
As of the 2010 census, Monticello had a population of 2,506 people. The racial makeup of the town was 75.3% White, 19.2% African American, 0.4% Native American, 0.7% Asian, 0.1% Pacific Islander, and 4.3% from other races. The median household income was $30,938 and the median family income was $37,813. The per capita income was $17,845.
Conclusion
Monticello, Florida is a small town located in the panhandle of Florida, approximately 40 miles east of Tallahassee. It is the county seat of Jefferson County and is home to a population of approximately 2,500 people. The town was founded in 1828 and is named after Thomas Jefferson’s home in Virginia. Monticello’s economy is largely based on agriculture and tourism, and the town is home to several tourist attractions. The town has a diverse population, with a median household income of $30,938 and a median family income of $37,813.
Common Questions
What is Per Capita Income in Monticello?
Per Capita income in Monticello is $26,359.
What is the Median Family Income in Monticello?
Median Family Income in Monticello is $66,471.
What is the Median Household income in Monticello?
Median Household Income in Monticello is $48,043.
What is Income or Wage Gap in Monticello?
Income or Wage Gap in Monticello is 18.1%.
Women in Monticello earn 81.9 cents for every dollar earned by a man.
What is Inequality or Gini Index in Monticello?
Inequality or Gini Index in Monticello is 0.43.
What is the Total Population of Monticello?
Total Population of Monticello is 2,589.
What is the Total Male Population of Monticello?
Total Male Population of Monticello is 1,165.
What is the Total Female Population of Monticello?
Total Female Population of Monticello is 1,424.
What is the Ratio of Males per 100 Females in Monticello?
There are 81.81 Males per 100 Females in Monticello.
What is the Ratio of Females per 100 Males in Monticello?
There are 122.23 Females per 100 Males in Monticello.
What is the Median Population Age in Monticello?
Median Population Age in Monticello is 55.5 Years.
What is the Average Family Size in Monticello
Average Family Size in Monticello is 2.8 People.
What is the Average Household Size in Monticello
Average Household Size in Monticello is 2.2 People.
How Large is the Labor Force in Monticello?
There are 1,094 People in the Labor Forcein in Monticello.
What is the Percentage of People in the Labor Force in Monticello?
50.8% of People are in the Labor Force in Monticello.
What is the Unemployment Rate in Monticello?
Unemployment Rate in Monticello is 2.0%.